https://doi.org/10.1140/epjp/s13360-019-00067-2 R eg u l a r A r t i c l e
Room-temperature magnetoresistance
of nanocrystalline Ni metal with various grain sizes
V. A. Isnaini1,5, T. Kolonits2,5 , Zs. Czigány2 , J. Gubicza3 , S. Zsurzsa1,4, L. K. Varga1 , E. Tóth-Kádár1, L. Pogány1, L. Péter1 , I. Bakonyi1,a
1Wigner Research Centre for Physics, Hungarian Academy of Sciences, Konkoly-Thege út 29-33, Budapest 1121, Hungary
2Centre for Energy Research, Institute for Technical Physics and Materials Science, Hungarian Academy of Sciences, Konkoly-Thege út 29-33, Budapest 1121, Hungary
3Department of Materials Physics, Eötvös Loránd University, Pázmány Péter sétány 1/A, Budapest 1117, Hungary
4Present Address: Infineon Technologies Cegléd Kft., Cegléd, Hungary 5Eötvös University, Doctoral School of Physics, Budapest, Hungary
Received: 6 July 2019 / Accepted: 20 October 2019 / Published online: 10 January 2020
© The Author(s) 2020
Abstract The room-temperature magnetoresistance (MR) characteristics of nanocrystalline (nc) Ni metal with various grain sizes (between 30 and 100 nm) are investigated in this work for the first time. The nc-Ni foils were produced by electrodeposition and the results are compared with data measured on coarse-grained (bulk) pure Ni metal samples prepared by cold-rolling and annealing. The MR(H) curves measured in magnetic fields up toH 9 kOe are analyzed in detail to determine the anisotropic magnetoresistance (AMR) ratio.
The magnitude of the AMR ratio was found to be around 2.5% for bulk Ni and in the range from about 2 to 2.5% for the nc-Ni samples, the latter data not exhibiting a systematic dependence on the grain size. On the other hand, the field-induced resistivity anisotropy splittingρAMR in the magnetically saturated state of the nc-Ni series was found to be proportional to the zero-field resistivity of the same samples with different grain sizes. The slope of this proportionality relation provided an AMR ratio of 2.4% for all nc-Ni samples, matching well the value for the bulk Ni samples. Thus, the AMR ratio for polycrystalline Ni metal seems to be fairly independent of the microstructural features. This also means that the AMR ratio is an inherent characteristic of the Ni metal matrix and it remains the same even if the matrix resistivity changes (e.g., by introducing grain boundaries) without noticeably modifying the electronic density of states at least in the vicinity of the Fermi level.
1 Introduction
Spintronic and magnonic materials are two important classes of advanced materials and their study is at the forefront of materials science. Such materials are typically composed of nanoscale ferromagnetic entities separated by a non-magnetic metal, an air gap or another ferromagnetic metal of different magnetic characteristics. The interest in these materials arises, on the one hand, due to the already existing applications, e.g., in spintronics devices
ae-mail:bakonyi.imre@wigner.mta.hu
such as the read heads of magnetic hard disk drives based on the giant magnetoresistance effect [1,2]. The ongoing demand for improving these existing applications necessitates further study of nanoscale magnetic heterostructures. On the other hand, there are further prospective technological applications of such structures, e.g., information storage in magnonic crystals [3,4].
Since the ferromagnetic elements Fe, Co and Ni as well as their alloys with each other often appear as basic ingredients of these magnetic nanostructures, it is important to have a reliable detailed knowledge of their electrical transport and magnetic properties since it appears from the literature that available data are not always satisfactorily accurate. This justifies revisiting, e.g., the zero-field electrical resistivity and the magnetoresistance (MR) characteristics of these ferromagnets both in the bulk state and in their various nanostructured forms.
In the present work, the room-temperature MR characteristics of Ni metal in the nanocrys- talline (nc) state are investigated for the first time. The investigated nc-Ni foils were produced by electrodeposition and the results will be compared with data measured on coarse-grained (bulk) pure Ni metal samples prepared by cold-rolling and annealing.
For the electrodeposited Ni foils, the grain size could be varied by the deposition parame- ters between about 30 and 100 nm, and thus the possible influence of grain size on the electri- cal transport parameters could be investigated. This is of interest since in the nanocrystalline state, the presence of a large amount of lattice defects such as grain boundaries represent excess scattering centers for the conduction electrons carrying the current and this leads finally to an increase of the zero-field resistivity [5]. This was, indeed, often observed for nc-Ni as summarized in Ref. [6] in which we have analyzed the grain-size dependence of the zero-field resistivity (ρo) of the current electrodeposited nc-Ni samples together with all previously reported relevant data to extract the specific grain-boundary resistivity of Ni metal.
Although Madduri and Kaul [7] investigated in detail the temperature and field depen- dence of the resistivity of electrodeposited nc-Ni samples, they have measured the transverse magnetoresistance component only. Thus, the anisotropic magnetoresistance (AMR) could not be derived from their measurements since for deducing the AMR, the longitudinal mag- netoresistance should also be measured. Therefore, in the present work the MR(H) curves were measured on nc-Ni samples with two orientations of the magnetic field with respect to the current: field parallel to the current flow (longitudinal MRLMR) and field perpendicu- lar to the current flow (transverse MRTMR). From the saturation value of the longitudinal and transverse MR components, obtained by extrapolation from the magnetically saturated (single-domain) state toH 0, the AMR ratio [8–13] was determined. The main aim of the present study was to reveal whether the grain size has an influence on the AMR of a ferromagnetic metal.
This contribution is organized as follows. In Sect.2, the investigated Ni samples and the electrical transport measurement technique will be presented. The experimental results for the room-temperature MR behavior of the samples studied are described in Sect.3, where they are also discussed in comparison with previous reports on Ni metal, either in bulk, thin film or nanocrystalline form. In Sect.4, the correlation between the zero-field resistivity data and the saturation value of the magnetic-field-induced resistivity change is discussed. A summary of the present results will be given in Sect.5.
2 Experimental
2.1 Samples investigated
The results of electrical transport measurements to be presented here were obtained on the same metallurgically processed and electrodeposited pure Ni metal foil samples for which we have recently reported room-temperature zero-field resistivity data [6]. Therefore, only a brief description and characterization of these samples will be given here.
(1) Metallurgically processed Ni foils were prepared by cold rolling and annealing ingots from two different sources. The samples prepared in this manner included the follow- ing Ni foils: sample #B5 prepared from electrolytic grade Ni and sample #Ni(99.99+
%) prepared from a high-purity ingot. An additional Ni sample was also included in the electrical transport studies: sample #GF-Ni(50 μm) purchased from Goodfellow Company in the form of a foil with a thickness of 50μm.
The structural characterization of sample #B5 revealed [6] that this Ni foil sample can be considered as representing the bulk state of Ni (it can also be termed as microcrystalline (μc) Ni since it exhibits grain sizes in the micrometer range). Although no structural study was carried out for the two other above mentioned Ni foil samples (#Ni(99.99+
%) and #GF-Ni(50μm)), they should exhibit fairly similar structural features as sample
#B5, i.e., they can also be considered as representing bulk Ni. This is further supported by the fact that the room-temperature zero-field resistivity of all these samples was in good agreement with that of bulk Ni [6].
(2) Electrodeposition (ED) was used to prepare about 20μm thick nc-Ni foils with grain sizes ranging from 30 to 100 nm. The metallic substrates were removed from the nc-Ni samples by mechanical stripping and/or electrochemical etching. A sample set denoted here as ED Ni series is identical with those electrodeposited Ni samples for which a detailed structural characterization was described in Refs. [14] and [15] and their zero- field resistivity data were reported in Ref. [6]. Two other electrodeposited Ni samples (sample #B2 and #Ni(TKE)) prepared earlier under different conditions were also inves- tigated and structurally characterized in Ref. [6] and they will also be included in the present MR study.
According to the chemical analysis reported in Ref. [6], neither metallic, nor non-metallic impurities could be detected up to a level of about 0.1 at.% in most of these investigated Ni foil samples, apart from some C and O contamination, very probably on the surface of the foils only since these elements could be detected roughly in the same amount for each sample even for the metallurgically processed ones. Two of the ED Ni series samples, however, contained about 3 at.% Co due to the Co impurity in the chemicals used for the electrodeposition of these two particular samples. Whereas it was pointed out in Ref. [6] that such an amount of Co impurity has a negligible influence only on the room-temperature zero-field resistivity of Ni metal, it can cause a significant increase of the AMR of Ni metal [12]. Therefore, these two Co-containing nc-Ni samples will be treated separately from the pure nc-Ni samples.
2.2 Electrical transport measurements
For the electrical transport measurements, a rectangular strip of about 1–2 mm wide and about 5–20 mm long was cut from the Ni foils.
The magnetoresistance was measured with a four-point-in-line probe with flat gold-coated spring contacts at room temperature. The measurements were performed with both the current
-1.6 -1.4 -1.2 -1.0 -0.8 -0.6 -0.4 -0.2 0.0 0.2 0.4 0.6 0.8 1.0 1.2 1.4
-10 -9 -8 -7 -6 -5 -4 -3 -2 -1 0 1 2 3 4 5 6 7 8 9 10
H (kOe)
MR (%)
LMR TMR
bulk Ni [#Ni(99.99+%)]
T = 300 K -0.8
-0.4 0.0 0.4 0.8
-0.4 -0.2 0.0 0.2 0.4
H (kOe)
MR (%)
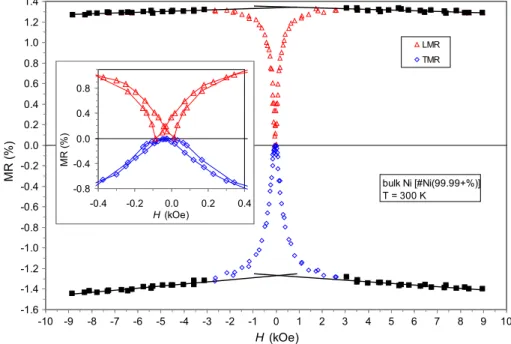
Fig. 1Room-temperature longitudinal (LMR) and transverse (TMR) MR(H) curves for the bulk Ni foil sample
#Ni(99.99+ %). The solid squares over the high-field (|H|≥3 kOe) data points indicate data used for a linear fitting and the fit is also indicated (thick solid line). The inset shows a magnified view around zero magnetic field to demonstrate that by the densely measured points aroundH0, the real maximum and minimum resistivity values were captured. The magnified inset also allows revealing the hysteretic behavior of the magnetoresistance, analogous to the magnetic hysteresis
and the magnetic field being applied in the foil plane. The MR(H) curves were measured in both the longitudinal and transverse configurations as described in the Introduction. A d.c.
current was used for the resistivity measurements which were carried out at room temperature up toH9 kOe. The MR ratio at a magnetic fieldHwas defined with the formula MR(H) [R(H)−Ro]/RowhereR(H) is the resistance in an external magnetic fieldHandR0is the resistance maximum/minimum close to zero magnetic field.
3 Magnetoresistance of bulk and nanocrystalline Ni
3.1 Bulk (microcrystalline) Ni
Figure1shows the MR(H) curves for one of the bulk Ni samples of the present study for both the LMR and TMR measurement configurations. The results are in qualitative agreement with the well-known MR(H) curves reported for bulk Ni [8,16]. The other two bulk Ni foils investigated exhibited MR(H) curves very similar to those shown in Fig.1.
The low-field sections (below about 2–3 kOe) of the MR(H) curves in Fig.1reflect the magnetization process [8,9] with its field evolution depending on the sample shape, magnetic anisotropy, stresses, etc. Therefore, the MR(H) curves of individual bulk Ni samples may differ from each other below the external field corresponding to the magnetic saturation.
However, above magnetic saturation (i.e., in the single-domain state), the magnetoresistance
also achieves saturation and this manifests itself in a nearly linear variation of the resistivity in this field range [12,13] which will be discussed later.
The inset in Fig.1shows a magnified view of the measured data aroundH0. We can observe that a sufficient number of data points were measured around the resistance maxima and minima close to zero magnetic field, approximately at the corresponding coercive fields, ensuring that we could capture the true maximum and minimum resistance values. This is important since the maximum/minimum resistance values corresponding to the optimally demagnetized state of the samples serve as the normalization values for the resistance and their accurate knowledge is necessary to get the correct values for the AMR. It should be stressed that having not enough data aroundH 0, one may miss the true resistance maximum/minimum, leading to a smaller AMR value than the true one.
In the saturated (single-domain) state at room temperature, the resistivity depends only on the relative orientation of the magnetization and measuring current [8–13]. For the LMR configuration (magnetization and current are parallel), the resistivity is maximum and for the TMR configuration (magnetization and current are perpendicular to each other), the resistivity is minimum. The difference between the LMR and TMR components in the saturation region defines the AMR [8–13]. The origin of the difference between the LMR ad TMR components is the different conduction electron scattering cross-section that is larger for the parallel than for the perpendicular configuration of current flow and magnetization [9–11].
The reduction of the resistivity with increasing magnetic field in the saturation region is due to the gradual suppression of the magnon contribution to the resistivity [7,9,13,17,18].
This contribution arises from the scattering of conduction electrons on the thermally induced spin-disorder (magnons) at finite temperatures (the magnon suppression is often termed also as paraprocess [18]). In the relatively low magnetic fields investigated here, the magnon suppression contribution can be considered as nearly linearly varying with magnetic field at room temperature [13].
The evaluation of the MR(H) data was, therefore, performed by fitting a straight line to the data in the saturation region (|H|≥3 kOe) [12,13]. The measured magnetoresistance data for |H|≥3 kOe were fitted to the function XMR(H)XMRs+m HwhereXLorT andm< 0 is the slope of the field dependence in the saturation region and characterizes the magnon suppression term. From the longitudinal (LMRs) and transverse (TMRs) saturation components of the magnetoresistance, the AMR ratio was obtained as AMRLMRs− TMRs. The resistivity anisotropy splittingρAMRwas obtained as the product of the AMR ratio and the zero-field resistivityρ0.
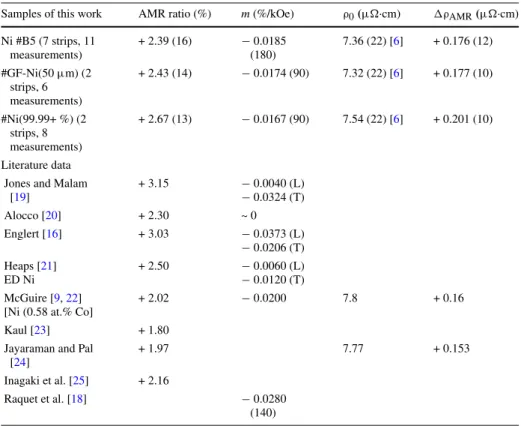
The values of these parameters for the bulk (microcrystalline) Ni samples as obtained in the present work are given in Table1. The data given represent averages over several strips and measurements for a given sample as indicated in the first column of Table1. Our AMR values for the bulk Ni samples Ni #B5 and #GF-Ni(50μm) agree with each other very well whereas the AMR value for the #Ni(99.99+ %) sample is slightly higher by about a factor of 1.11. As noted before, there was no Co or Fe contamination in the third sample that could cause a measureable increase of the AMR ratio. Thus, at the moment we do not have an explanation for the slightly higher AMR ratio of the third sample.
Table1lists also all previously reported AMR data for bulk Ni metal [16,19–25]. Unfor- tunately, not much structural and impurity information is available about most of the samples used in these earlier studies. The two AMR values above 3% [16,19] may originate, e.g., from Co impurities in the Ni samples investigated since it is known [12] that the addition of a few percent of Co can increase the AMR of Ni metal to this extent. Some of the other data are close to our AMR values, but most of them are smaller and scattered around 2%. The
Table 1Room-temperature electrical transport parameters of theμc-Ni foils investigated, together with rel- evant literature data on bulk Ni metal
Samples of this work AMR ratio (%) m(%/kOe) ρ0(μ·cm) ρAMR(μ·cm) Ni #B5 (7 strips, 11
measurements)
+ 2.39 (16) −0.0185 (180)
7.36 (22) [6] + 0.176 (12)
#GF-Ni(50μm) (2 strips, 6 measurements)
+ 2.43 (14) −0.0174 (90) 7.32 (22) [6] + 0.177 (10)
#Ni(99.99+ %) (2 strips, 8 measurements)
+ 2.67 (13) −0.0167 (90) 7.54 (22) [6] + 0.201 (10)
Literature data Jones and Malam
[19]
+ 3.15 −0.0040 (L)
−0.0324 (T)
Alocco [20] + 2.30 ~ 0
Englert [16] + 3.03 −0.0373 (L)
−0.0206 (T) Heaps [21]
ED Ni
+ 2.50 −0.0060 (L)
−0.0120 (T) McGuire [9,22]
[Ni (0.58 at.% Co]
+ 2.02 −0.0200 7.8 + 0.16
Kaul [23] + 1.80
Jayaraman and Pal [24]
+ 1.97 7.77 + 0.153
Inagaki et al. [25] + 2.16
Raquet et al. [18] −0.0280
(140)
The measured magnetoresistance data for |H|≥3 kOe were fitted to the function XMR(H)XMRs+m H whereXLorTandm< 0. From the saturation longitudinal (LMRs) and transverse (TMRs) components of the magnetoresistance, the AMR ratio was obtained as AMRLMRs−TMRs. The resistivity anisotropy splittingρAMRwas obtained as the product of the AMR ratio and the zero-field resistivityρ0.The figures in brackets after the data represent the scatter to cover all measured data for the given parameter
smaller AMR values in comparison with ours may have resulted, e.g., from missing the true maxima/minima ofRaroundH0 as discussed above.
It is useful to quote the room-temperature value of ρAMR which is the resistivity anisotropy splitting between the longitudinal and transverse configurations in the satura- tion region (ρAMRρLMRs−ρTMRs) and can be conveniently obtained as the product of the zero-field resistivity and the AMR ratio. When measuring the magnetoresistance of ferromagnets, in most cases only the AMR ratio is determined since it can be measured with relatively large accuracy without the need of knowing the precise sample dimension param- eters. As demonstrated in Ref. [6], our resistivity measurement accuracy is about 3% and so we can get theρAMRdata given in Table1with the same accuracy. There are relatively few ρAMRdata for bulk Ni [9,24] and these are shown also in Table1; corresponding to the smaller AMR for these samples, the reportedρAMRvalues are also smaller than our values.
The second column in Table1gives the high-field slopemof the MR(H) curves. It is noted that whereas the AMR ratio could be determined for a given sample with reason- able reproducibility (within less than 10% of the average), the experience with the current magnetotransport workstation was that the magnon-suppression term characterized by the
-0.8 -0.6 -0.4 -0.2 0.0 0.2 0.4 0.6 0.8 1.0 1.2 1.4 1.6 1.8 2.0
-10 -9 -8 -7 -6 -5 -4 -3 -2 -1 0 1 2 3 4 5 6 7 8 9 10
H (kOe)
MR (%)
LMR TMR
nc-Ni (#SC8) T = 300 K
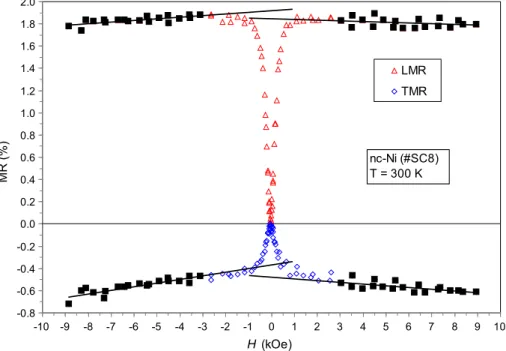
Fig. 2Room-temperature longitudinal (LMR) and transverse (TMR) MR(H) curves for the nc-Ni sample with the smallest grain size. The solid squares over the high-field (|H|≥3 kOe) data points indicate data used for a linear fitting and the fit is also indicated (thick solid line)
high-field slopemof the MR(H) curves could not be established accurately. Ourmvalues were very scattered and for a given sample, we often obtainedmvalues differing by a factor of 2 or 3 in consecutive measurements. The same large scatter can be observed also for the literature data summarized in Table1. Nevertheless, according to the data listed in Table1, the averagemvalue for bulk Ni can be in the range−0.0100%/kOe <m<−0.0300%/kOe.
To determinemwith sufficient accuracy for the present bulk Ni foils having a thickness of typically 50μm, we need to improve the electronic stability of our measurement setup by at least an order of magnitude.
3.2 Nanocrystalline Ni
The MR(H) curves of all nc-Ni foil samples were qualitatively very similar to those of the bulk Ni samples (see Sect.3.1). The measured MR(H) curves for the nc-Ni sample with the highest resistivity (smallest grain size) [6] is shown in Fig.2.
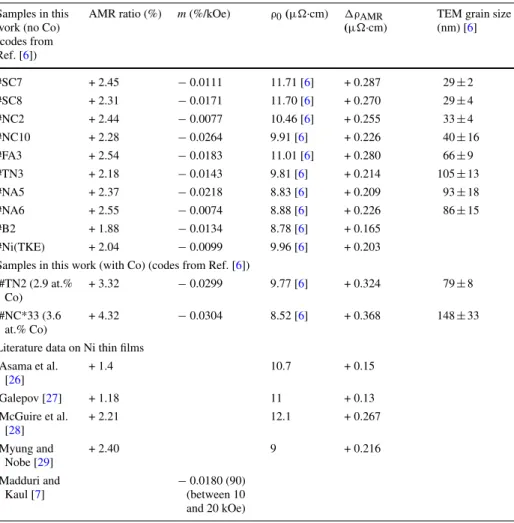
The evaluation of the MR(H) curves of the nc-Ni samples proceeded in the same manner as for the bulk Ni samples in Sect.3.1. The results are summarized in Table2. Included are here also theρAMRvalues (column 5) obtained with the help of the resistivity data reported on the same samples in Ref. [6] and reproduced in column 4 together with their grain sizes in column 6. We have also listed relevant literature data for Ni thin films [26–29] which are presumably also nanocrystalline.
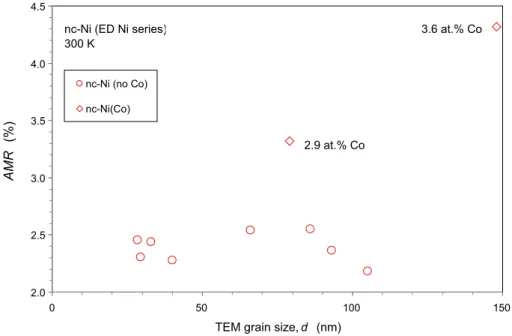
The AMR data of the ED Ni series samples are displayed in Fig.3as a function of the grain size of the same samples taken from Ref. [6]. The AMR values are scattered between + 2.2 and + 2.5% for the nc-Ni samples free of Co impurity and no obvious trend can be
Table 2Room-temperature electrical transport parameters of the electrodeposited nc-Ni foils investigated, together with reported Ni thin film data
Samples in this work (no Co) (codes from Ref. [6])
AMR ratio (%) m(%/kOe) ρ0(μ·cm) ρAMR (μ·cm)
TEM grain size (nm) [6]
#SC7 + 2.45 −0.0111 11.71 [6] + 0.287 29±2
#SC8 + 2.31 −0.0171 11.70 [6] + 0.270 29±4
#NC2 + 2.44 −0.0077 10.46 [6] + 0.255 33±4
#NC10 + 2.28 −0.0264 9.91 [6] + 0.226 40±16
#FA3 + 2.54 −0.0183 11.01 [6] + 0.280 66±9
#TN3 + 2.18 −0.0143 9.81 [6] + 0.214 105±13
#NA5 + 2.37 −0.0218 8.83 [6] + 0.209 93±18
#NA6 + 2.55 −0.0074 8.88 [6] + 0.226 86±15
#B2 + 1.88 −0.0134 8.78 [6] + 0.165
#Ni(TKE) + 2.04 −0.0099 9.96 [6] + 0.203
Samples in this work (with Co) (codes from Ref. [6])
#TN2 (2.9 at.%
Co)
+ 3.32 −0.0299 9.77 [6] + 0.324 79±8
#NC*33 (3.6 at.% Co)
+ 4.32 −0.0304 8.52 [6] + 0.368 148±33
Literature data on Ni thin films Asama et al.
[26]
+ 1.4 10.7 + 0.15
Galepov [27] + 1.18 11 + 0.13
McGuire et al.
[28]
+ 2.21 12.1 + 0.267
Myung and Nobe [29]
+ 2.40 9 + 0.216
Madduri and Kaul [7]
−0.0180 (90) (between 10 and 20 kOe)
The measured magnetoresistance data for |H|≥3 kOe were fitted to the function XMR(H)XMRs+m H whereXLorTandm< 0. From the saturation longitudinal (LMRs) and transverse (TMRs) components of the magnetoresistance, the AMR ratio was obtained as AMRLMRs−TMRs. The resistivity anisotropy splittingρAMRwas obtained as the product of the AMR ratio and the zero-field resistivityρ0
observed from these data. On the other hand, the two nc-Ni(Co) samples with a small amount of Co impurity (about 3 at.%) have significantly larger AMR values, and the observed AMR increase is in good quantitative agreement with the reported influence of Co on the AMR of Ni metal at low Co concentrations [12].
Themvalues are given in column 3 of Table2. These data could be obtained with better accuracy here than for the bulk Ni foils since the nc-Ni foils had a typical thickness of 20μm or even less. Themvalues for the pure nc-Ni samples are typically between−0.0100 and
−0.0200%/kOe and very similar values were obtained also by Madduri and Kaul [7] for their ED nc-Ni samples. By looking at the data given above for the bulk Ni samples (Table 1), we can also establish that the microstructural differences between bulk (μc) and nc-Ni
2.0 2.5 3.0 3.5 4.0 4.5
0 50 100 150
TEM grain size, d (nm)
AMR (%)
nc-Ni (no Co) nc-Ni(Co)
3.6 at.% Co
2.9 at.% Co nc-Ni (ED Ni series)
300 K
Fig. 3AMR data as a function of the grain size for the present nc-Ni and nc-Ni(Co) samples
do not result in a noticeable change of the magnon suppression term which can actually be expected.
An analysis of the magnetotransport parameters of the nc-Ni samples will be attempted in Sect.4where we will look for a correlation between the zero-field resistivity and theρAMR
values of the corresponding samples.
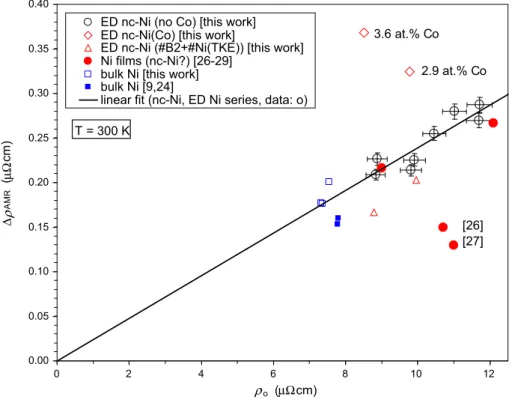
4 Correlation ofρAMRwith the zero-field resistivityρo
The available present and literature room-temperature data forρAMRand for the zero-field resistivity,ρo, of Ni metal are displayed against each other in Fig.4. It can be seen that the larger the zero-field resistivity, the larger the quantityρAMR. The data of Co-free nc-Ni samples from the ED Ni series can be fitted to a straight line going through the origin and the slope of the line yields AMR+ 2.39%. (It is noted that the fit was performed by forcing the fit line to go through the origin and the fit quality wasR20.8196. Performing the fit in a manner that the ordinate intercept was a free variable, the result wasρAMR0.0246ρo
−0.0075 with a fit qualityR20.8203 and the position of the fit line over the data points was hardly different from the forced-fit line going through the origin. Since the fit quality was practically the same in both cases and the slopes differed by some 3% only, we can rely on the forced fit result which corresponds to physical expectation in that if the resistivity is zero, no anisotropic splitting can occur).
The other two investigated Co-free ED Ni samples which were prepared under different conditions as those of the ED Ni series yielded data points below the fitted line. As to the (probably also nanocrystalline) Ni thin film data, two of them are in good agreement with the results for the current Co-free ED Ni series whereas the other two data deviate markedly
0.00 0.05 0.10 0.15 0.20 0.25 0.30 0.35 0.40
0 2 4 6 8 10 12
ρo (μΩcm) ΔρAMR (μΩcm)
ED nc-Ni (no Co) [this work]
ED nc-Ni(Co) [this work]
ED nc-Ni (#B2+#Ni(TKE)) [this work]
Ni films (nc-Ni?) [26-29]
bulk Ni [this work]
bulk Ni [9,24]
linear fit (nc-Ni, ED Ni series, data: o) T = 300 K
2.9 at.% Co 3.6 at.% Co
[26]
[27]
Fig. 4Correlation ofρAMRwith the zero-field resistivityρ0at room temperature for bulk (μc) and nc- Ni metal. The solid line corresponds to a linear fit withρAMR0.0239ρ0(fit quality:R20.8196) to the data of the Co-free nc-Ni samples of the present ED Ni series (circle) for which the±3% error bars mentioned in the text are also indicated. The two nc-Ni samples with Co impurity (diamond) are displayed with different symbols and, similarly, also the two other ED nc-Ni samples prepared earlier under different conditions (triangle). Our bulk (μc) Ni results are indicated by the open squares (square). Several literature data are also included (see the legend) for (probably nc) Ni film samples (filled circle) and for bulk Ni samples (filled square)
form the common trend. The nc-Ni(Co) samples clearly deviate from the trend indicated by the fit line and the presence of Co is responsible for this.
It can be observed that theρAMRvalues for two of the bulk Ni samples (Ni #B5 and
#GF-Ni(50μm)) lie very close to the fitted line, in agreement with their similar AMR values (2.39% and 2.43%, respectively, see Table1). The data for the third bulk Ni sample of the present work (#Ni(99.99+ %)) and two literature data are slightly further apart from, but still fairly close to the fit line.
Of course, not surprisingly, the average of the AMR values in Table1(and shown also in Fig.3) for the pure (Co-free) nc-Ni samples agrees exactly with the AMR+ 2.39% value derived from the slope of the straight line in Fig.4. However, displaying the magnetoresistance data in the form of Fig.4underpins that the apparent scatter of the AMR data in Fig.3is not of random nature, but rather governed by the zero-field resistivity of the individual nc-Ni samples.
The majority of the data included in Fig.4demonstrate that in pure Ni metal the anisotropy splitting of the longitudinal and transverse magnetoresistance components in the magnetically saturated state as measured by the quantityρAMRis clearly proportional to the absolute value
of the zero-field resistivity. This proportionality is apparently independent of the microstruc- tural features of the Ni samples and is an inherent characteristic of Ni metal, reflecting the anisotropy of electron scattering as far as the electron flow direction with respect to the local magnetic moment orientation is concerned (parallel or perpendicular).
At room temperature, the dominant contribution to the resistivity of bulk Ni metal is due to the electron–phonon and, to a less extent, the electron-magnon interaction [7]. In the case of the pure (i.e., Co-free) nc-Ni samples, we were able to induce an increase in the zero- field resistivity by introducing a large amount of grain boundaries representing additional scattering centers for the conduction electrons. On the other hand, the electron scattering processes causing the spontaneous anisotropy of the resistivity (i.e., the AMR) depend on the electronic band structure of the metal matrix. The linear relation betweenρAMRandρ0in Fig.4may suggest that we could increase here the resistivity without noticeably modifying the overall electronic density of states (DOS) around the Fermi level since the resistivity anisotropy increased only in proportion to the enhancement of the resistivity itself.
According to the following considerations, we can make an estimate to what extent the Fermi level DOS remains unchanged in our nc-Ni samples with respect to bulk Ni. The smallest grain size was around 30 nm (see Table2). Palumbo et al. [30] estimated that at this grain size about 10% of the atoms are in the grain boundaries whereas the fraction of atoms in triple line junctions is negligible here. They assumed a grain boundary width of 1 nm and the modeling results of Derlet et al. [31] for nc-Ni indicated that the width can actually be even smaller, depending on the way of defining the grain boundary width. For the largest grains sizes in our samples (around 100 nm), the grain boundary atomic fraction drops down to about 3%. Furthermore, Crampin et al. [32] has carried out a detailed calculation of the local electronic DOS for several atomic layers near the core of a (210) tilt boundary in nickel.
It is generally known that any deviation from structural perfectness leads to a smearing out of the fine peaks of DOS curve which latter reflect the details of the crystal symmetry of the given metal. Since only electrons around the Fermi level can participate in the conduction process, the DOS at the Fermi level is of interest only for us currently. Bulk Ni metal itself has a steep flank of the DOS at the Fermi level. Crampin et al. [32] has found that there is indeed a smearing out of the DOS peaks for atomic layers close to the core of the grain boundary and bandwidth reduction also appears here. On the other hand, they could also demonstrate that the bandwidth is fully restored already for layer 3 and for this layer the DOS flank at the Fermi level is already indistinguishable from bulk Ni. If we take now into account that layer 3 in their model consists of atoms which are actually first neighbors to atoms of the grain boundary core (defined as layer 0), we can come to the conclusion that the width of the grain boundary over which the atoms have a Fermi level DOS different from that of bulk Ni is below even a half of a nanometer. Thus, the fraction of atoms with different DOS than bulk Ni are indeed very small and we can assume that in our samples the overall DOS at the Fermi level may not differ significantly from that of bulk Ni. In this manner, in the grain size range investigated, nc-Ni can be considered as behaving like bulk Ni from the viewpoint of the spontaneous anisotropy of the resistivity and we can expect the linear relation between ρAMRandρ0as observed in Fig.4.
The distinctly deviatingρAMRvalues for the Ni samples with a small Co-content further underpin that the observed linear behavior derives from the electronic structure of the pure Ni metal matrix since adding a small amount of Co to Ni changes slightly the matrix electronic structure in a manner that a larger resistivity anisotropy splittingρAMRarises.
Evidently, another means of resistivity modification without substantially altering the Fermi level DOS of the metal matrix is a change of the temperature of the metal, either in the bulk (μc) or nc state. According to the note of Campbell and Fert [10], the AMR ratio is
fairly independent of the temperature. This actually corresponds to the statement that for a given metal matrix,ρAMRis proportional to the zero-field resistivity if the temperature is used as an internal parameter.
Along this line, our next step is to study the correlation ofρAMRand the zero-field resistivity for both bulk (μc) and nc Ni metal below room temperature. It can be expected that the data should fall for both structural states on the straight line of Fig.4of the present work.
5 Summary
In this work, the room-temperature magnetoresistance (MR) characteristics of nc-Ni metal with various grain sizes (between 30 and 100 nm) were investigated for the first time. The MR(H) curves were measured to determine the AMR ratio and the results were analyzed together with corresponding data measured on bulk (microcrystalline) Ni metal samples. The magnitude of the AMR ratio was found to be in the range from about 2 to 2.5% for both bulk Ni and nc-Ni and did not show a systematic dependence on the grain size. On the other hand, the field-induced resistivity anisotropy splittingρAMRin the magnetically saturated state was found to be proportional to the zero-field resistivity of the same samples with different grain sizes. The slope of this proportionality relation provided an AMR ratio of 2.4% for polycrystalline Ni metal which seems to be fairly independent of the microstructural features (coarse grained or nanocrystalline).
Thus, the present room-temperature magnetoresistance results demonstrated that the resis- tivity anisotropy splittingρAMR is proportional to the zero-field resistivity of the metal matrix in the sense that if we can change the resistivity of the matrix without changing noticeably the electronic density of states of the metal matrix, at least around the Fermi level, then the induced change ofρAMRwill be proportional to the resistivity change. The proportionality factor, which is actually the AMR ratio, is an inherent characteristic of the metal matrix.
Acknowledgements Work supported by the Research Group Linkage Programme (Project Ref. 3.4-1001292- HUN-IP) of the Alexander von Humboldt Foundation, Germany with the funding provided by the Federal Ministry of Education and Research, Germany. A critical reading of the manuscript by H. Ebert is gratefully acknowledged.
Funding Open access funding provided by MTA Wigner Research Centre for Physics (MTA Wigner FK, MTA EK).
Open Access This article is licensed under a Creative Commons Attribution 4.0 International License, which permits use, sharing, adaptation, distribution and reproduction in any medium or format, as long as you give appropriate credit to the original author(s) and the source, provide a link to the Creative Commons licence, and indicate if changes were made. The images or other third party material in this article are included in the article’s Creative Commons licence, unless indicated otherwise in a credit line to the material. If material is not included in the article’s Creative Commons licence and your intended use is not permitted by statutory regulation or exceeds the permitted use, you will need to obtain permission directly from the copyright holder.
To view a copy of this licence, visithttp://creativecommons.org/licenses/by/4.0/.
References
1. G. Binasch, P. Grünberg, F. Saurenbach, W. Zinn, Phys. Rev. B39, 4828 (1989)
2. M.N. Baibich, J.M. Broto, A. Fert, F. Nguyen Van Dau, F. Petroff, P. Etienne, G. Creuzet, A. Friederich, J. Chazelas, Phys. Rev. Lett.61, 2472 (1988)
3. V.V. Kruglyak, S.O. Demokritov, D. Grundler, J. Phys. D Appl. Phys.43, 264001 (2010) 4. M. Krawczyk, D. Grundler, J. Phys. Condens. Matter.26, 123202 (2014)
5. J.M. Ziman,Electrons and phonons, VI(Clarendon Press, Oxford, 1960)
6. I. Bakonyi, V.A. Isnaini, T. Kolonits, Z. Czigány, J. Gubicza, L.K. Varga, E. Tóth-Kádár, L. Pogány, L.
Péter, H. Ebert, Philos. Mag.99, 1139 (2019).https://doi.org/10.1080/14786435.2019.1580399 7. P.V.P. Madduri, S.N. Kaul, Phys. Rev. B95, 184402 (2017)
8. R.M. Bozorth,Ferromagnetism(Van Nostrand, New York, 1951) 9. T.R. McGuire, R.I. Potter, IEEE Trans. Magn.11, 1018 (1975)
10. I.A. Campbell, A. Fert, inTransport Properties of Ferromagnets, ed. E.P. Wohlfarth. Ferromagnetic materials, vol. 3 (North-Holland, Amsterdam, 1982)
11. R.C. O’Handley,Modern magnetic materials principles and applications(Wiley-Interscience, New York, 2000)
12. B.G. Tóth, L. Péter, Á. Révész, J. Pádár, I. Bakonyi, Eur. Phys. J. B75, 167 (2010) 13. I. Bakonyi, Eur. Phys. J. Plus133, 521 (2018)
14. T. Kolonits, P. Jenei, B.G. Tóth, Z. Czigány, J. Gubicza, L. Péter, I. Bakonyi, J. Electrochem. Soc.163, D107 (2016)
15. T. Kolonits, P. Jenei, L. Péter, I. Bakonyi, Zs Czigány, J. Gubicza, Surf. Coat. Technol.349, 611–621 (2018)
16. E. Englert, Ann. Phys.14, 589 (1932)
17. B. Raquet, M. Viret, J.M. Broto, E. Sondergard, O. Cespedes, R. Mamy, J. Appl. Phys.91, 8129 (2002) 18. B. Raquet, M. Viret, E. Sondergard, O. Cespedes, R. Mamy, Phys. Rev. B66, 024433 (2002)
19. W. Jones, J.E. Malam, Philos. Mag.27, 649 (1914) 20. G. Alocco, Nuovo Cim.10, 153 (1932)
21. C.W. Heaps, Phys. Rev.55, 1069 (1939) 22. T.R. McGuire, AIP Conf. Proc.24, 435 (1975) 23. S.N. Kaul, J. Phys. F7, 2091 (1977)
24. V. Jayaraman, B. Pal, Indian J. Phys.52A, 411 (1978)
25. M. Inagaki, M. Suzuki, Y. Iwama, U. Mizutani, Jpn. J. Appl. Phys.25, 1514 (1986) 26. K. Asama, K. Takahasi, M. Hirano, AIP Conf. Proc.18, 110 (1973)
27. P.S. Galepov, Izv. VUZ Fizika9, 64 (1974)
28. T.R. McGuire, J.A. Aboaf, E. Klokholm, IEEE. Trans. Magn.20, 972 (1984) 29. N.V. Myung, K. Nobe, J. Electrochem. Soc.148, C136 (2001)
30. G. Palumbo, S.J. Thorpe, K.T. Aust, Scripta Met. Mater.24, 1347 (1990)
31. P.M. Derlet, S. Van Petegem, H. Van Swygenhoven, Phys. Rev. B71, 024114 (2005) 32. S. Crampin, D.D. Vvedensky, J.M. MacLaren, M.E. Eberhart, Phys. Rev. B40, 3413 (1989)