Open Access : : ISSN 1847-9286 www.jESE-online.org Original scientific paper
In-depth component distribution in electrodeposited alloys and multilayers
László Péter1,, Kálmán Vad2, Attila Csik2, Rocío Muñíz3, Lara Lobo3, Rosario Pereiro3, Sašo Šturm4, Kristina Žužek Rožman4, György Molnár5, Katalin Németh1,
Katalin Neuróhr1, Krisztina Boros1, Lajos Pogány1, Imre Bakonyi1
1Wigner Research Centre for Physics, Hungarian Academy of Sciences, Konkoly-Thege út 29-33, 1121 Budapest, Hungary
2Institute of Nuclear Research of the Hungarian Academy of Sciences, Bem tér 18/c, 4026 Debrecen, Hungary
3Department of Physical and Analytical Chemistry, University of Oviedo, Julián Clavería 8, 33006 Oviedo, Spain
4Jožef Stefan Institute, Jamova 39, 1000 Ljubljana, Slovenia
5Institute of Technical Physics and Materials Science, Centre for Energy Research, Hungarian Academy of Sciences, Konkoly-Thege út 29-33, 1121 Budapest, Hungary
Corresponding authors E-mail: peter.laszlo@wigner.mta.hu; Tel.: +36-1-392-2222, ext 3614;
Fax: +36-1-392-2768
Received: November 30, 2017; Accepted: January 8, 2018
Abstract
It is shown in this overview that modern composition depth profiling methods like secondary neutral mass spectroscopy (SNMS) and glow-discharge – time-of-flight mass spectrometry (GD-ToFMS) can be used to gain highly specific composition depth profile information on electrodeposited alloys. In some cases, cross-sectional transmission electron microscopy was also used for gaining complementary information; nevertheless, the basic component distribution derived with each method exhibited the same basic features. When applying the reverse sputtering direction to SNMS analysis, the near- substrate composition evolution can be revealed with unprecedented precision. Results are presented for several specific cases of electrodeposited alloys and mulitlayers. It is shown that upon d.c. plating from an unstirred solution, the preferentially deposited metal accumulates in the near-substrate zone, and the steady-state alloy composition sets in at about 150-200 nm deposit thickness only. If there is more than one preferentially deposited metal in the alloy, the accumulation zones of these metals occur in the order of the deposition preference. This accumulation zone can be eliminated by well-controlled hydrodynamic conditions (like the application of rotating disc electrodes) or by pulse
plating where the systematic decrease in the duty cycle provides a gradual transition from a graded to a uniform composition depth profile. The application of composition depth profile measurements enabled detecting the coincidence in the occurrence of some components in the deposits down to the impurity level. This was exemplified by the GD- ToFMS measurements of Ni-Cu/Cu multilayers where all detected impurities accumulated in the Cu layer. The wealth of information obtained by these methods provides a much more detailed picture than the results normally obtained with bulk analysis through conventional integral depth profiling and help in the elucidation of the side reactions taking place during the plating processes.
Keywords
Alloy formation; near-substrate composition modulation; hydrodynamic conditions; component distribution correlations
Introduction
Electrodeposited metal coatings have been widely used for the corrosion protection as well as for the improvement of the appearance of the coated objects for more than a century. For both above mentioned purposes, the mean composition of the coating, the even lateral component distribution within the coating and the quality of the final surface (e.g., roughness and passivity) are the crucial parameters.
Nowadays, electroplating is much more than a workhorse of the coating industry. Electrode- position has found its role in the preparation of various nanostructures [1-9], whose functionality strongly depends on, e.g., the component distribution of the electroplated material also at the nanometer scale. Inhomogeneities can influence various physical and chemical parameters such as adhesion of the coating, strain (that impacts hardness and yield strength), electrical resistivity, saturation magnetization, magnetostriction and hence the coercive field, band gap (of semiconductors), catalytic properties etc. Therefore, the compliance of the component distribution of a coating to a predefined pattern is a prerequisite for achieving the desired functionality.
In parallel to the emergence of electrochemical nanotechnologies, local composition analysis methods working at the nanoscale as well as the composition depth profile methods have undergone a significant development. Concerning techniques that can be used for planar surfaces, most of the non-destructive composition depth profiling methods (such as X-ray and neutron reflectometry, ellipsometry and angle-resolved X-ray photoelectron spectroscopy /ARXPS/) are sensitive to a narrow range beneath the sample surface only (typically at most a few tens of nanometers). Rutheford backscattering spectroscopy is capable of detecting the in-depth component distribution at a larger depth, nevertheless the depth resolution is limited. The common disadvantages of these methods (except for ARXPS) are that they require a preliminary assumption on the component/phase distribution that makes the model boundary conditions, a large number of input parameters necessary for the evaluation of the measurements and the lack of direct chemical information.
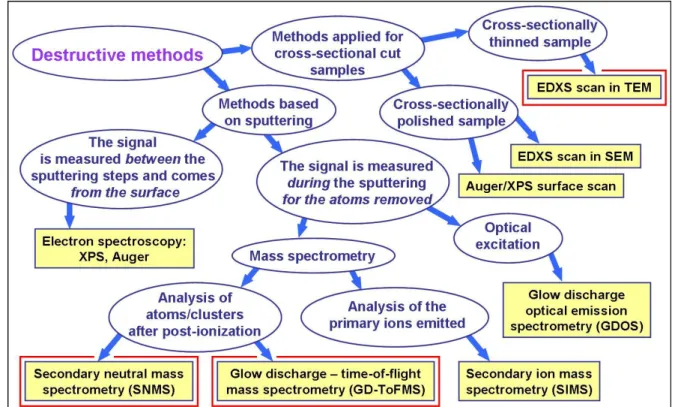
The family of the destructive composition depth profile analysis methods is also quite complex, as presented in Figure 1. All of the methods shown in Figure 1 yield direct composition information, a few of them (Auger/XPS techniques) being also sensitive to the oxidation state of the elements.
Although the destructive nature of these methods leads to at least a partial consumption of the samples, all can be used without a preliminary assumption on either the sample structure or composition.
Historically, the spontaneous variation of the alloy composition during d.c. plating was detected as the change of the average composition as a function of the thickness [10-14]. Although this procedure is well indicative of a composition change, it is an integral method, which also means that its sensitivity to either local effects or subtle changes is very little. In contrast to integral methods, methods based on a local analysis exhibit a much higher sensitivity. This is true regardless of whether the information obtained either from the deposit itself (like in transmission electron microscopy /TEM/ energy dispersive X-ray spectroscopy /EDXS/) or from the composition of the sputtered material (with secondary neutral mass spectrometry /SNMS/ and with glow discharge – time-of-flight mass spectrometry /GD-ToFMS/). This is particularly important or even indispensable when a multilayer is deposited because a bulk analysis cannot reveal practically any detail of the component distribution.
Figure 1. Organization chart of destructive composition depth profile analysis methods. Methods used in the studies to be described later are labeled with a red square. Key to acronyms not resolved in the figure: EDXS:
energy-dispersive X-ray spectroscopy; TEM: transmission electron microscopy; SEM: scanning electron microscopy; XPS: X-ray photoelectron spectroscopy
The goal of this study was twofold: (i) to establish general trends that serve as guidelines concerning the alloy composition change in the growth direction during the plating process; and (ii) to analyze the component distribution in two-pulse-plated multilayers, including major components and impurities. It was our intention to use the most advanced composition depth profiling methods and also to confront their results with each other for obtaining a detailed picture on the phenomena studied and, also, for comparing the peculiarities of some specific methods.
Experimental
Materials and chemicals
Plating baths were made of analytical grade chemicals. Purified water with 18 Mcm resistivity (ELGA Purelab R7) was used in each case for the preparation of the solutions. When the solution to
be used contained an oxidation-sensitive component (like Fe2+), the solution was freshly prepared every day. A new portion of bath was used in every experiment. A sacrificial anode was typically a sheet or a wire spiral made of the most noble metallic component to be deposited in order to avoid a spontaneous cementation process. Since the sample studies were obtained with a large variety of baths, the solution components will be given in the sections where a specific group of deposit is reported.
Substrate
Samples were deposited onto Si wafers that were pre-coated by evaporation. The Si(100) wafers with approximately 3 nm root-mean-square roughness were cleaned but the native oxide layer was not removed. The evaporated coating consisted of a 5-nm chromium adhesion layer and a 20-nm copper conducting layer.
Electrodeposition apparatus
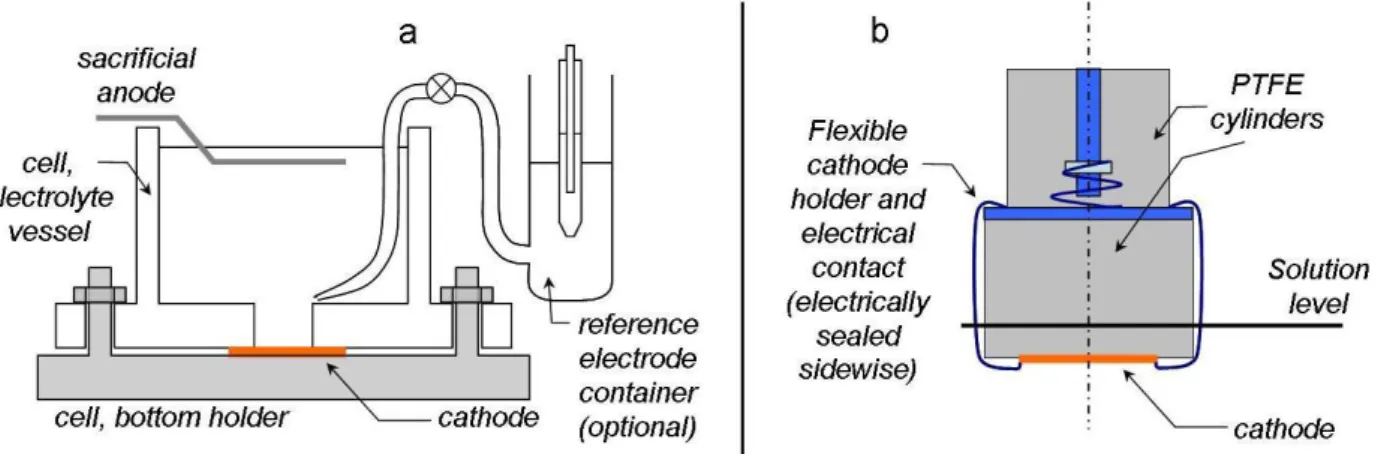
The majority of the electrodeposition experiments were carried out in a 50-ml volume Plexigrass cell [15] which is shown in Figure 2a. The cathode was fixed in an upward-facing position to the bottom of the cell with a recess. In this cell, the solution was stagnant, and the even current distribution was provided by the recess and the parallel anode/cathode arrangement. The surface area was nominally 8 mm x 20 mm that might be a bit lower due to the compression of the gasket between the body of the cell and the cathode. The actual surface area of the deposit was measured after the removal of the cathode.
A few experiments were also performed with a home-built rotating disc electrode (Figure 2b). In these experiments, a 1-inch diameter pre-coated silicon wafer was fixed to a rotating PTFE cylinder of the same diameter. The electrical connection to the metallic coating of the wafer was provided with two clamps which also served to hold the wafer at the bottom surface of the electrode holder.
The stainless-steel clamps were electrically sealed on the sides, hence minimizing the current passing elsewhere than through the wafer coating. The rotation rate of this electrode was less than 350 rpm. The counter electrode was a metal spiral at the bottom of the cell whose material was chosen according to the same principle as for the other cell.
Figure 2. a - Structure of the cell for experiments with a stagnant solution (after Ref. 15).
b - Construction of the rotating disc electrode for experiments with controlled hydrodynamics.
The majority of the d.c.-plated samples were prepared with galvanostatic control; therefore, a reference electrode was only seldom used for checking the cathode potential variation during the deposition. Multilayered samples were deposited in a mixed G/P deposition mode [16] where the
less and more noble metal layers were produced during the constant-current (G) and the constant- potential (P) pulse, respectively. The more noble metal (e.g. Cu) was deposited with the limiting- current conditions, while the ratio of currents during the G and P pulses was used for the estimation of the deposit composition prepared during the G pulse (e.g. NixCuy). As power source for the sample preparation, three potentiostat/galvanostat units were used, all of them capable of operating without a pause between the pulses even during the G/P pulse sequence (Electroflex EF453, IviumStat, Ivium CompactStat).
Sample preparation for in-depth composition analysis
For SNMS depth profile analysis, samples were peeled off from the substrate. In order to carry out this process and to obtain a self-supporting sample with a sufficient mechanical strength, the deposition of the sample of interest was followed by the electrodeposition of at least one additional layer. After the deposition of the layer of interest onto the Si/Cr/Cu substrate, the solution was changed without disassembling the cell, and a Ni plating bath was used to obtain a Ni layer of at least 3 micrometer thickness. In some cases, especially when the deposit of interest was rich in Ni, a zinc interlayer was also deposited before the sample was finally covered with the nickel supporting layer. This made it possible to find the boundary of the layer of interest easily. After the coating process, the back side of the Si wafer was scratched and then broken by bending it, the sample being always at the concave side where it could not be torn apart. Then, the sample was gently separated from the Si wafer. The separation took place at the weakest interface, which was the Si/Cr boundary in the case of Si/Cr/Cu substrates. Further details of the process can be found elsewhere [17-20].
This procedure led to samples where the sputtering could be started from the substrate side of the sample (reverse sputtering direction), and the initial roughness at the beginning of the sputtering process was essentially the same as that of the Si wafer prior to the coating process.
For the GD-ToFMS study [21], the sample remained on the Si substrate and the deposit could be analyzed as it was obtained after the electrodeposition procedure. In this case, the sputtering direction was the conventional one; i.e., it started at the surface where the deposit formation finished. As the sample is deposited onto a Si substrate and it is used for sealing the discharge chamber, the reverse sputtering arrangement could not be applied with this method.
TEM specimens were initially prepared from a pair of delaminated electrodeposited films, which were glued together and inserted between Si wafer dummies. Discs with 3 mm diameter were cut from the central area of these bulk specimens, mechanically ground to a final thickness of 20 μm and ion-milled using 4-keV Ar+ to achieve thin, electron-transmissive areas located in the film regions. Then, the TEM specimens were further ion-milled at a low energy of 500 eV and an incident angle of 6° for 30 minutes to remove all contamination.
Analysis instruments
SNMS depth profile analysis of the samples was performed with an INA-X type instrument (SPECS GmbH, Berlin, Germany) in direct bombardment mode by using Ar+ ions with a fairly low energy for sputtering (typically with E[Ar+]= 350 eV). The erosion area was confined to a circle of 2 to 3 mm diameter by means of Ta masks. The lateral homogeneity of the ion bombardment was checked by profilometric analysis of the craters sputtered.
A pulsed radiofrequency GD-ToFMS instrument (Horiba Scientific, France) was also used for depth profiling of some samples. The ion source was a copper-based 4 mm diameter anode with a 20 mm long flow tube. The sample was placed horizontally and rf power was supplied through the back of the sample. A quadrupole filter was placed just after the extraction cone, allowing
attenuation of the signal of up to four ion types of different masses in order to reduce the overload of the detector. ToFMS extraction frequency was set to 30 KHz, which made it possible to obtain mass spectra in every 33 μs. Data acquisition periods of 0.58 s were averaged for obtaining one data point in the depth profile. After the initial argon flush period, at 160 Pa pressure and with 30 W of power, 1 ms pulse width and 25 % duty cycle were selected for sample analysis.
For both sputtering-based analysis methods, the transformation of the intensity vs. time function to the mole fraction vs. depth function was carried out with a standard multi-matrix calibration procedure. The sputtering rate of the samples was measured with the help of a profilometer.
The TEM investigation was performed by a JEOL JEM-ARM200F instrument, using the cold field emission source, equipped with an EDXS system (Centurio 100 mm2, JEOL). The probe size for scanning TEM (STEM) imaging was set to 0.1 nm, with a current of 20 pA and a convergence semi- angle of 24 mrad. STEM images were acquired in a so-called bright-field (BF) and a high-angle annular dark-field (HAADF) mode, respectively. The EDXS spectrum images were recorded with a lateral probe size of 0.2 nm, under continuous scanning mode with a pixel dwell time of 25 microseconds and by using probe currents of 250 pA.
Results and discussion
Composition depth profile of d.c.-plated Ni-Cd alloys obtained from a stagnant solution
During the study of the formation of binary alloys, first the composition depth profile of electroplated Ni-Cd alloys is analyzed where Cd is a minority component of the alloy. Nickel alloys have the advantage in such investigations that Ni exhibits a relatively small exchange current density, which makes its deposition quite hindered. This prevents nickel from developing dendrites in a wide range of current density. As opposed to metals having a high exchange current density (like Cu, Ag or Bi), the increment of the surface roughness of Ni with increasing deposit thickness is slow. The limited roughening, together with the favorable mechanical properties of nickel, makes it an ideal major component for depth profiling studies of alloy formation.
Figure 3 summarizes the composition depth profile information obtained for various Ni-Cd alloys.
Samples were obtained from a Watts-type bath (0.85 mol dm3 NiSO4, 0.15 mol dm-3 NiCl2, 0.4 mol dm-3 H3BO3; pH 2.5) doped with the CdSO4 (3–30 mmol dm-3) [19]. The current density that was used for the deposition of these samples (-19.5 mA cm-2) was much above the limiting current density of the Cd deposition from a Ni-free solution for all Cd2+ concentrations used. This means that the Cd deposition can be regarded as a diffusion-limited deposition process where the Ni deposition absorbs the current that cannot be covered by the transport of the Cd2+ ions.
Figure 3(a) shows the near-substrate quantitative composition depth profile of the main components. Cr and Cu signals come from the substrate layers that were detached from the Si wafer. The good resolution of these layers indicates that the sample detachment from the substrate did not cause any significant damage to the sample. The decay of the Cu mole fraction to the half of its maximum is approximately at the depth that is the sum of the nominal thickness of the Cr and Cu layers (5 nm + 20 nm, respectively). It can be well seen that the mole fraction of Cd is about four times larger in the near-substrate zone than in the bulk of the sample.
The Cd accumulation is due to its preferred deposition, while the Cd concentration decay is explained with the depletion of the solution layer near the cathode surface with respect to the fast- reacting Cd2+ ions. The decay of the mole fraction of the component with high relative deposition preference is the consequence of the interplay of the large reaction rate and the depletion of the bath with respect to this component in the unstirred solution.
Figure 3. (a) Reverse SNMS composition depth profile of a Si/Cr/Cu//Ni-Cd sample; c(Cd2+) = 10 mmol dm-3. (b) Comparison of the Cd mole fractions from the reverse depth profile measurements of alloys obtained
with different Cd2+ concentrations. The depth scale is corrected for the substrate thickness.
(c) Raw SNMS measurement data indicating the reverse depth profile with the signal intensities of all elements detected. In this experiments, the Cd2+ ion concentration was c(Cd2+) = 30 mmol dm-3. Figure 3(b) indicates that the trend of the accumulation of the metal with higher deposition preference near the substrate is the same for a wide range of the concentration of its precursor
cation. However, some quantitative differences of the depth profile functions can also be observed.
The relative accumulation of Cd near the substrate (calculated as the ratio of the peak mole fraction and the mean mole fraction in the bulk) depends on the concentration. The smaller the Cd2+concentration, the larger its relative accumulation, varying from 14 to 2.4 as c(Cd2+) increases from 3 to 30 mmol dm-3. At the same time, the decay depth of the concentration maximum increases with the Cd concentration (from 35 nm to about 110 nm as c(Cd2+) increases by an order of magnitude from 3 to 30 mmol dm-3).
The display of the data on a logarithmic intensity scale makes it possible to present the composition depth profile of all important components in a single plot, as shown in Figure 3(c). The fast decay of the signal of the substrate components, Cr and Cu, to their background level is an indication of (i) the low surface roughness of samples peeled off from the Si substrate; (ii) the lack of the redeposition of these components; and (iii) the complete removal of the products from the chamber after the sputtering of the corresponding layers finished. It can also be seen that Co appears with the occurrence of the Ni-rich layer. This is because Co is a very common impurity in Ni compounds and is deposited preferentially besides Ni. Therefore, a small concentration of Co in the precursor materials manifests itself as a Co signal in the SNMS measurement. It is worthwhile noting that the Co intensity increases to its steady-state value in the same depth range in the near- substrate zone where the Ni signal grows to its plateau value.
Although it is very tempting to treat the formation of dilute alloys merely by the mass transport effect of the precursor ions, the data for the Ni-Cd system also show that the phenomenon is by far not that simple. For instance, it can be seen from the quantitative analysis that the Cd mole fraction is not linearly proportional to the Cd2+ concentration (see Figure 3(b)), although the mass transport- based contemplation would rationalize this view. Besides the mass transport, various other factors that are difficult to treat simultaneously should be taken into account; i.e., the change in the deposition efficiency due to the alloy formation because of the impact of the alloying element on the hydrogen evolution overvoltage, structural effects during alloy formation etc. [22-24]. An earlier study showed that Co as a minor component beside Ni accumulates in the near-substrate zone in the same manner as Cd does [19]. However, due to the formation of various structurally incoherent phases (with the most likely composition of CdNi and Cd5Ni [23,25-27]), the Ni-Cd system is not suitable for a depth profiling study in a wide concentration range.
Comparison of d.c. plating and pulse plating: Ni-Fe alloys obtained from a stagnant solution
The Ni-Fe system enables studying the composition change during codeposition in a wide concentration range because the structural incoherency does not prevent the formation of a compact deposit. Iron is codeposited with nickel with the so-called anomalous codeposition mode [28-33], which means a high deposition preference of Fe2+ ions. Therefore, the baths that can be used for the deposition of Ni-Fe alloys are usually fairly dilute for Fe2+ as compared to Ni2+. In the present study, the following solution concentrations were applied [20]: 0.55 mol dm-3 NiSO4, 0.005-0.1 mol dm-3 FeSO4, 0.3 mol dm-3 Na2SO4 (supporting electrolyte), 0.1 mol dm-3 H3BO3
(buffering agent), 0.2 g dm-3 saccharin (stress reliever) and 0.03 g dm3 sodium dodecylsulfate (wetting agent).
Typical reverse composition depth profile curves obtained for Ni-Fe alloys are shown in Figure 4, for both galvanostatic and potentiostatic deposition modes. It is obvious from the measurements presented in Figure 4 that the enrichment of the preferentially deposited metal (here, Fe) in the near-substrate zone is not the consequence of the choice of the regulated electrical parameter, but
it is a general feature of the Fe-Ni codeposition. This statement is well in accord with the reason of the enrichment as described above; i.e., it is related to the solution depletion, whichever deposition mode leads to the consumption of the precursor ions. It is also to be noted that the change in the deposition potential during the galvanostatic deposition or the change in the current density during the potentiostatic deposition is insignificant and cannot be related to the composition change.
0 100 200 300
0.0 0.2 0.4 0.6 0.8 1.0
Cu
Mole fraction Fe
Sputtering depth, nm Ni
Potentiostatic deposition:
E = -1.15 V vs. SCE
(a)
0 100 200 300
0 20 40 60 80 100
Galvanostatic deposition:
j = -20 mAcm-2
(b) Cu
Fe Ni
Mole fraction
Sputtering depth, nm
Figure 4. Reverse SNMS composition depth profile of two Si/Cr/Cu//Ni-Fe samples; c(Fe2+) = 45 mmol dm-3 for both specimens. (a) potentiostatic deposition, (b) galvanostatic deposition. In both graphs, the unlabeled
black line refers to Cr.
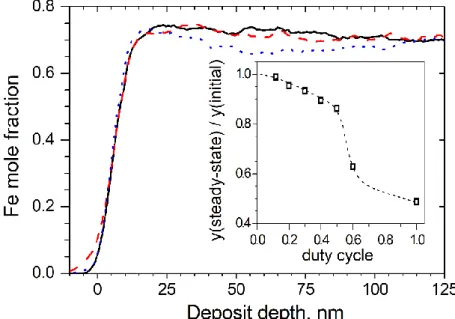
When pulse plating is applied, the composition depth profile function is nearly flat [20]. The small near-substrate composition transient can be minimized by decreasing the duty cycle. This provides that all circumstances, especially the electrolyte concentrations in the close vicinity of the substrate, recover to the same value as in the bulk solution by the start of the next deposition pulse. Therefore, the material deposited during each current pulse will be identical in composition. The lower the concentration of the Fe2+ ions in the solution, the smaller the duty cycle has to be in order to achieve the flat composition depth profile [20]. This is well understood since the smaller the composition of the ions of the preferentially deposited metal, the more the deposition approaches the diffusion- limited character (where the surface concentration of the reacting ions becomes zero). For the same
reason, the higher the on-time current density, the smaller the duty cycle has to be in order to achieve a flat composition depth profile. Although the above trends are well established, no quantitative description is available at the time being for anticipating the necessary duty cycle range for suppressing the initial composition change below a particular predefined limit. Figure 5 presents the summary of the data obtained for a number of pulse-plated samples.
Figure 5. Reverse SNMS composition depth profile of three pulse-plated Si/Cr/Cu//Ni-Fe samples. Deposition conditions: c(Fe2+) = 45 mmol dm-3, tON=0.1 s, tOFF = 0.4 s; jON = -26.7, -20 and -13.3 mA cm-2 for the solid black, dashed red and dotted blue curves, respectively. Data were corrected for the substrate thickness and Fe mole fractions are only displayed for the sake of simplicity. Inset: Dependence of the ratio of steady-state
and initial Fe mole fractions on the duty cycle for jON = -13.3 mA cm-2 (other deposition conditions are the same as for the main graph).
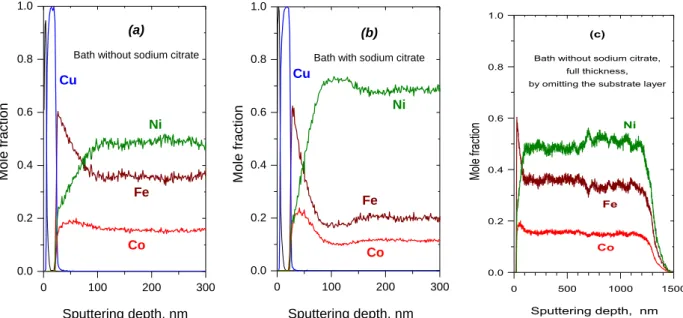
Composition depth profile of d.c.-plated ternary Ni-Co-Fe alloys obtained from a stagnant solution For binary alloys, it was clear that the metal with high deposition preference accumulates near the substrate. For a ternary alloy, an order of deposition preference can be deducted from the composition data of d.c. deposits. For iron-group metal alloys, this deposition preference is as follows: Fe>Co>Ni [34-36]. It is an open question how the order of the deposition preferences affects the composition evolution in the near-substrate zone. In this study, the solution contained 0.2 mol dm-3 NiSO4, 0.075 mol dm-3 CoSO4, 0.025 mol dm-3 FeSO4, 0.4 mol dm-3 H3BO3, 0.03 g dm-3 sodium dodecylsulfate and 0.2 g dm-3 saccharin, while the pH was set to 2.8 with sulfuric acid. The order of the concentration of the metal sulfates is the opposite as the deposition preference. This provides that the mole fractions in the deposit have comparable orders of magnitude. When sodium citrate was also added to the bath, its concentration was 0.2 mol dm-3, and the pH of the bath was 5.5 (which required no adjustment). Some composition depth profile data for the near-substrate zone of electrodeposited Ni-Co-Fe system are also available elsewhere [18,37], but these data are in contradiction to the long-range composition vs. thickness functions published in some other studies (e.g, Fig 5 of Ref. [38]).
Figure 6 presents the comparison of the reverse SNMS depth profile of two samples, deposited from a bath either without (Figure 6(a)) or with (Figure 6(b)) sodium citrate as complexing agent. In both measurements, the layer structure of the components originating from the substrate can be well seen, so much that the Cu mole fraction during the sputtering of the Cu layer achieves 1. This
indicates that the preparation of the samples led to undamaged specimens with intact Cr and Cu layers remaining on the deposit upon the removal from the Si wafer. Otherwise, the signals of the substrate layers and the deposit would smear out, strongly diminishing the apparent sharpness of the interfaces. The successful sample preparation also means that all differences found in the spectra are an inherent feature of the deposits and cannot be attributed to artefacts.
0 100 200 300
0.0 0.2 0.4 0.6 0.8 1.0
Mole fraction
Sputtering depth, nm (a)
Bath without sodium citrate
Cu
Co Fe
Ni
0 100 200 300
0.0 0.2 0.4 0.6 0.8 1.0
Cu
Co Fe (b)
Bath with sodium citrate
Mole fraction
Sputtering depth, nm Ni
0 500 1000 1500
0.0 0.2 0.4 0.6 0.8 1.0
Mole fraction
Sputtering depth, nm (c)
Bath without sodium citrate, full thickness, by omitting the substrate layer
Co Fe
Ni
Figure 6. Reverse SNMS composition depth profile of two d.c.-plated Si/Cr/Cu//Ni-Co-Fe samples with a current density j = -12 mA cm-2. (a) No sodium citrate, pH 2.8; (b) c(Na3Cit) = 0.2 mol dm-3, pH 5.5.
(c) Same profile as for (a) at the full depth scale.
The scheme of the composition change is the same in the spectra of both d.c.-plated Ni-Co-Fe deposits. Namely, the deposition starts with an iron-rich material with an Fe mole fraction of about 0.6, and the Fe mole fraction starts to decay immediately. The sharpness of the Fe peak at the substrate/deposit boundary is determined by the experimental transient during the SNMS measurement. The signal corresponding to Co also exhibits a maximum, but the rise of the Co mole fraction is far less fast as that of the Fe, and the Co mole fraction maximum follows the Fe maximum delayed by about 20-30 nm. Then, the Co mole fraction also decreases, and the steady-state composition is achieved after some 150 nm deposit thickness.
The data presented above (like several others, see [18,19]) indicate that the components of the electrodeposited alloys accumulate sequentially in the order of their deposition preference. The deposition rate of Fe is high at the beginning, which manifests itself by a large Fe mole fraction in the near-substrate zone of the deposit. Since the Fe2+ concentration in the bath is small, the depletion of the solution in the cathode vicinity leads to a decrease in the deposition rate, and the Fe mole fraction declines. As the deposition rate of Fe decreases, Co starts replacing it, but the combination of deposition preference and depletion results in a Co mole fraction maximum, too.
The achievement of the steady-state is related to a stabilization of the depletion (composition profile of the precursor ions) in the solution that determines then the transport rate of the ions toward the substrate.
The quantitative comparison of the samples deposited from citrate-free and citrate-containing solutions supports the view that the spontaneous initial composition change is related to the transport processes in the solution. The citrate ions form a complex with the majority of the metal cations, and the reason of its application to Ni-Co-Fe baths lies in the beneficial impact on the bath stability and the resulting phase structure and magnetic properties of the deposits [39,40]. The
sodium citrate concentration is 2/3 of the total metal ion concentration in the present study. Even under these conditions, the diffusion of the complexed precursor ions can be assumed to be slower than that of the non-complexed ones. Hence, the decay rate of the mole fractions of the preferentially deposited metals (dy/dx where x is the thickness and y is the mole fraction) is larger if the transport rate is smaller. This can be well seen in the comparison of the profiles of the two alloys in Figure 6. It is to be noted that the pH also differs for the two baths used in the above comparison. It is also known [41-43] that the mole fraction of Fe and Co in Ni-Co-Fe deposits decrases with the increase in pH if pH >2.8. However, we can exclude that the effect of the pH is dominant in the composition change observed since the initial Fe mole fraction is nearly the same.
If the pH had a major impact on the composition, the near-substrate mole fractions should also change significantly, which was not observed.
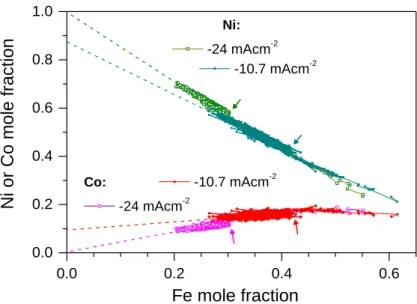
As Figure 6(c) indicates, the composition depth profile can be uneven also after the decay of the initial transient. It can be easily observed that the composition variations are not a consequence of the random experimental errors since they are well correlated with each other. The changes in the mole fraction of Fe and Co exhibit the same direction, while the mole fraction of Ni always shows a countermotion. Further interesting details can be revealed from the interrelation of the mole fractions of the components of the samples if they are displayed as a function of each other. The mole fraction of Fe was selected as the independent variable and all other mole fractions were plotted as a function of y(Fe). This can be seen in Figure 7 for two samples deposited from the same bath with different current densities.
If the sample is deposited with a large enough current density (-24 mA cm-2, see Figure 7), the Co mole fraction is linearly proportional to the iron mole fraction: y(Co) = ky(Fe), and k 1/3. The value of the proportionality factor k can be compared to the c(Co2+)/c(Fe2+) ratio, which was 3. If both components were deposited at the diffusion limited rate, the concentration ratio should be close to the k factor since the transport coefficient of the Me2+ ions with nearly the same size and weight must be very close to each other. Therefore, we can conclude that at least the Co deposition does not take place at the diffusion-limited rate. There must be, however, a governing factor in the codeposition kinetics which ensures this proportionality. At -24 mA cm-2, the extrapolation to zero Fe2+ concentration leads to the result that the Co mole fractions should be zero. This is clearly impossible since, in the absence of Fe2+, the anomalous codeposition should lead to a relatively Co- rich deposit. These data indicate indirectly that the anomalous codeposition involves the inhibition of the deposition of some metals of lower deposition preference, as it was also indicated by the measurements of Podlaha et al. [30,36]. As the current density decreases (see data corresponding to -10.6 mA cm-2 in Figure 7), the mole fraction of both Fe and Co increases. At the same time, the relationship between the mole fractions of the components remains linear, but the functional form is different: y(Co) = y(Co)0 + k’y(Fe); i.e., the extrapolation to zero Fe2+ concentration does not result in zero Co content, and k’<k. This indicates that at a relatively low current density, the anomalous codeposition preference between Co and Ni can also manifest itself, and the dependence of the Co content on the Fe content becomes weaker. Since Ni is the metal of the weakest deposition preference but with the highest precursor ion concentration, its deposition can be regarded as the reaction that takes the “leftover” current not used by either Fe or Co deposition. Hence, the countermotion of the Ni mole fraction with both the Fe and Co mole fractions is the consequence of the deposition preference and the concentration ratios.
0.0 0.2 0.4 0.6 0.0
0.2 0.4 0.6 0.8 1.0
Co: -10.7 mAcm-2 -24 mAcm-2
Ni or Co mole fraction
Fe mole fraction
Ni:
-24 mAcm-2 -10.7 mAcm-2
Figure 7. Interrelation of the mole fractions of two d.c.-plated Si/Cr/Cu//Ni-Co-Fe samples obtained with two different current densities as indicated next to the datasets. The solution composition was the same as
for Figure 5(a) and the depth profiles were taken from SNMS measurements. Dashed lines are a guide for the eye only and show the extrapolation of the trend of the corresponding experimental data. The small
arrows next to the datasets indicate where the initial composition change decayed (data with larger Fe mole fractions in the same dataset belong to the initial transient).
It is to be solved yet what can cause a simultaneous increase/decrease in the Fe and Co concentrations in one particular sample in a wide range of current density. One can conclude that this behaviour is the result of the random fluctuation in the mass transport in the solution. If the surface concentration of the two preferentially deposited components, Fe and Co, cannot change simultaneously, the strong correlation between their mole fractions could not occur. It also has to be noted that this fluctuation must extend over the entire substrate surface area, otherwise the sputtering method carried out on spots of 2-3 mm diameter would not be able to reveal it. This problem is also worthwhile to be studied with a direct imaging method that reveals also the lateral composition map of the samples.
TEM analysis of d.c.-plated Ni-Co-Fe alloys obtained from a stagnant solution
The difference in the SNMS composition profile of the d.c.-plated and pulse-plated alloys indicate that the initial composition change observed for the d.c.-plated sample cannot be an instrumental artefact. Nevertheless, it seemed to be worthwhile cross-investigating the results with a direct imaging method. This is why TEM was applied for Ni-Co-Fe samples deposited with analogous conditions than those studied with SNMS reverse depth profiling. In former reports describing a TEM study of Ni-Co-Fe samples [39,41,44-46], the near-substrate composition gradient shownin the previous chapter was not mentioned.
The composition change in the near-substrate zone was observed also with TEM and the features of the initial transition zone proved to be identical to those detected by SNMS. As it is shown in Figure 8, the TEM EDXS results show consecutive maxima in the signal intensities of the components in the order of their deposition preference. The initial transition range was about 200 nm thick, which is only a bit larger than the thickness of these zones as established from SNMS measurements.
The TEM investigation could also confirm that spontaneous long-range composition oscillation can occur during the deposition of Ni-Co-Fe samples from stagnant solutions. The spontaneous composition oscillation beyond the near-substrate zone ranged to a wider interval of the mole
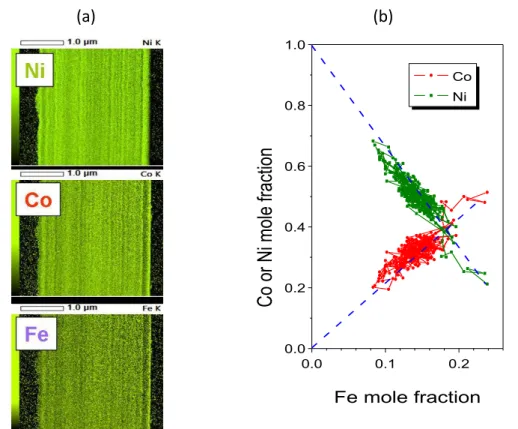
fraction of the components if the current density was larger. At -20 mA cm-2 current density, the spontaneous composition oscillation is obvious from the elemental maps (see Figure 9(a)).
Distance from the substrate, m
Figure 8. TEM EDXS study of a d.c.-plated Ni-Co-Fe sample. The dashed lines correspond to the maximum of the signal intensity of the corresponding component in the near-substrate zone.
(a) (b)
0.0 0.1 0.2
0.0 0.2 0.4 0.6 0.8 1.0
Co or Ni mole fraction
Fe mole fraction
Co Ni
Figure 9. (a) TEM EDXS elemental maps obtained for a d.c.-plated Ni-Co-Fe sample. The substrate is on the right dark edge of the images. (b) Mutual dependence of the mole fraction of the components
of the same sample as calculated from the line scan perpendicular to the substrate.
The elemental maps exhibit a complementary nature: light parts of the image show that the Ni intensity always corresponds to dark parts of both the Fe and Co maps and vice versa. This indicates that there is a positive correlation between the mole fractions of Co and Fe, while the Ni mole fraction has a negative correlation with that of the other components. By determining the mole fractions from a line scan performed perpendicular to the substrate, the mole fractions can be plotted in the same manner as in Figure 7 and the result can be seen in Figure 9(b). The similarity of
the character of the two figures is striking, which eliminates all doubts concerning the occurrence of any possible artefact in the SNMS measurements revealing spontaneous random concentration oscillations.
However, there is a peculiar difference between the SNMS and the TEM composition depth profiles. In both measurements, the y(Co) = ky(Fe) relationship holds, but the k parameter is very different (1/3 as derived from the SNMS measurements while nearly 2 from the TEM measure- ments). This is not yet understood and may rely in the difference in the quantification procedures of the two methods.
It has to be admitted that the preparation of a sample for TEM studies is by far more cumbersome than simply inserting the same sample to the analytical instrument that performs the sputtering and the subsequent analysis.
Nevertheless, the TEM elemental maps have also some advantage as compared to sputtering- based concentration depth profile measurements. Namely, if the undulation of the concentration fluctuation fronts becomes comparable to the thickness of the zones with identical concentration, the sputtering-based measurements will show the mean composition only. The reason of this averaging is that the sputtering front can sample various zones at the same time due to the undulation of the zones with varying composition. The TEM elemental maps can, however, yield fairly complex data: on the one hand, the concentration values as a function of the location and, on the other hand, the apparent roughness of the composition undulation fronts. Therefore, the methods used provide information content of rather complementary nature.
Composition depth profile of Ni-Co-Fe alloys plated under controlled hydrodynamics
For controlling the convection, a rotating disc electrode system was used for the deposition of the samples. The key features of the setup were described in the Experimental and are shown in Figure 2b. The solution in this study contained the following components: 0.2 mol dm-3 NiSO4, 0.075 mol dm-3 CoSO4, 0.025 mol dm-3 FeSO4, 0.4 mol dm-3 H3BO3, 0.28 mol dm-3 NH4Cl and 0.2 g dm-3 saccharin, while the pH was set to 2.8 with sulfuric acid. The ratio of the metal ions was the same as for the Ni-Co-Fe baths mentioned before. The current density was -20 mA cm-2 and the electrode rotation was 70-210 rpm.
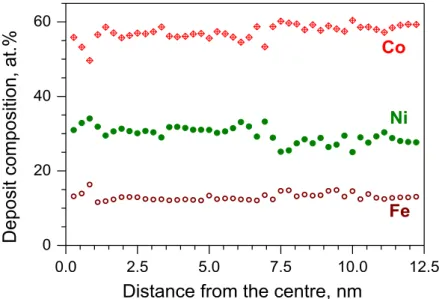
First, a sample was deposited onto a Si/Cr/Cu wafer in order to check the lateral homogeneity of the deposit. The analysis was performed with EDXS on 200 m x 200 m spots along the radius of the wafer. The result is shown in Figure 10. The composition was fairly stable along the radius and the deviations of the mole fractions of the components from their average values were uncorrelated with each other. This supports the view that the deviations should be attributed to random errors and no systematic trend can be established.
The composition analysis indicates that the electrode rotation had a significant impact on the composition. Samples prepared from a stagnant solution of nearly the same composition contained 50-70 at.% Ni, 15-10 at.% Co and 45-25 at.% Fe [18] (the molar percentages are listed above in such an order that their sequence for a given element indicates the composition change upon increasing current density). In contrast, the deposit obtained from a well-stirred solution was rich in cobalt.
This corresponds very well to the deposition preference and to the suppression of the role of the transport of the precursor ions.
Several samples were prepared with various current densities and electrode rotation frequencies for reverse depth profile analysis. A typical result of the SNMS measurements is presented in Figure 11.
0.0 2.5 5.0 7.5 10.0 12.5 0
20 40 60
Deposit composition, at.%
Distance from the centre, nm Co
Fe Ni
Figure 10. Result of the EDXS analysis of a Ni-Co-Fe deposit obtained by galvanostatic deposition on a rotating disc electrode (210 rpm).
0 400 800 1200 1600 0
20 40 60 80 100
Cu
Cr Zn
Ni Fe
Concentration, at.%
Sputtering depth, nm Co
Figure 11. Reverse SNMS composition depth profile curves of a Ni-Co-Fe deposit obtained by galvanostatic deposition on rotating disc electrode after removing the Si wafer substrate. The graph shows the complete structure with the substrate layers (Cr and Cu), the Ni-Co-Fe deposit, the Zn interlayer and the Ni covering
layer (support).
An essentially even composition profile was obtained for each sample, and the composition fluctuation often observed in samples obtained from a stagnant solution was never detected. The apparent composition fluctuation was well within the usual error of the SNMS measurement and, hence, it is unrelated to the features of the samples. The variation of the mean composition with current density was an order of magnitude smaller than in a stagnant solution. The variation of the electrode rotation rate in the 70-350 rpm range did not have a significant impact on the composition.
The composition change in the near-substrate zone was also small as compared to d.c.-plated samples obtained from stagnant solutions. Although the mole fraction of iron was always slightly larger in the near-substrate region than in the bulk, the change in the Fe concentration in the near- substrate zone was at most 6 at.% (c.f. 20-35 at.% change in samples obtained from stagnant
solutions). This mole fraction decay was compensated almost equally by a mole fraction increment of Co and Ni. The deposit thickness range in which this composition change took place shrunk in the stirred solution as compared to the stagnant one. While a 150-200 nm thick transition zone was observed for stagnant solutions, the transition zone thickness was less than 40 nm for samples deposited onto rotating discs.
Although the lack of a visible composition fluctuation in a set of samples cannot be taken as an absolute evidence for the complete elimination of the composition fluctuations, the full analysis of the composition profiles strongly underpins that the controlled hydrodynamics of the solution stabilizes the deposit composition and prevents the formation of a thick initial transition zone with large composition changes. Hence, the role of the mass transport in the occurrence of uneven composition of the alloy deposits is strongly evidenced with the latter experiments.
Composition depth profile of Ni-Cu/Cu multilayers
[Ni-Cu/Cu]N multilayers were deposited with the so-called G/P method [16] from an acetate/ci- trate bath [21,47]. By using this protocol, the alloy layer was obtained with a galvanostatic pulse, whose amplitude was suitable for the regulation of the composition of the Ni-Cu layer. The Cu partial current density (jCu) was measured and then assumed to be constant also during the high-current pulse (Ni-Cu layer). Hence, the nominal layer composition was calculated as follows: yCu = jCu/jTOTAL
and yNi = 1 - yCu. The nickel mole fraction in the layers was set to 0.9, 0.75 and 0.4, and the corresponding layers will be denoted henceforth as high (H), medium (M) or low (L) Ni-content layers, respectively. The Cu layers were deposited with a potentiostatic pulse controlling the layer thickness with the real-time current integration during deposition. The Cu deposition potential was chosen so that Ni could neither deposit nor dissolve. Further details of the sample preparation as well as the evaluation method of the GD-ToFMS spectra were published elsewhere [21]. Since the low-pressure chamber of the GD device and the ambient-pressure environment is separated by the sample itself during the measurement, the foil preparation for the reverse sputtering method could not be used here, and hence, the analysis was performed with the conventional sputtering direction for deposits still on their Si/Cr/Cu substrate (i.e., from the solution side toward the substrate).
Figure 12 shows a representative qualitative depth profile measurement for a multilayer with the L-M-H order of the Ni layers (as counted in the order of their deposition). The profile well reveals the layered structure of the sample, and the relative peak intensities of the Ni signals also indicate the sequence of the Ni layers with various composition. The layer structure as estimated from the signal of different isotopes of the same element is identical.
The curves shown in Figure 12 all exhibit a long decay period after the sputtering of the corresponding layer finished. This is an inherent feature of the GD-ToFMS method. The long decay of the signals of each isotope explains why the Ni signal cannot decrease to zero when the Cu layer is sputtered and why the multilayer components are observed when the sputtering front reached the substrate. Besides the features of the sputtering method itself, the long decay time of the signals can also be explained with the sputtering direction. Since the conventional sputtering direction could only be used here, the sputtering started at a surface which exhibits a significant roughness.
The resulting sputtering intensities are obtained as a convolution of the sputtering front to the layered structure, which leads to a widening of the wave corresponding to a particular isotope.
Therefore, the present measurements are not suitable for the direct comparison of the accuracy of the sputtering-based analysis methods themselves (SNMS and GD-ToFMS), but are highly influenced by the sputtering direction, too.
Sputtering time, s
Figure 12. GD-ToFMS composition depth profile curve of a Si/Cr/Cu//[Ni-Cu/Cu]3 multilayer. Thickness of the Ni-Cu and intermediate Cu layers: 80 nm, thickness of the top Cu layer: 40 nm. The order of the Ni-Cu layers
follows the sequence of their deposition: L-M-H (from right to left in the graph). Numbers next to the chemical symbols refer to the atomic weight of the isotope measured.
An important advantage of the mass spectrometric analysis of the samples is that the major components and the impurities can be detected at the same time. Figure 13 shows the spectra of the same multilayer as in Figure 12 by indicating the signal intensities of different components.
Figure 13 clearly shows that metallic impurities that are less noble than Cu are codeposited with Ni.
The signal intensity of Co and Fe shows the same variation at large scale as that of Ni. Both Co and Fe show an anomalous codeposition beside Ni, but they cannot be deposited at the potential where Cu is deposited. Therefore, these elements accompany nickel.
It is worthwhile drawing attention to some subtle details of Figure 13. If the variation of the Co and Fe signals is scrutinized within one particular Ni-rich layer, it can be seen that both of them decrease as the deposition proceeds. Since both Fe and Co are preferentially deposited with Ni and their ions are present in a small concentration, the bath is depleted with respect to their ions as the deposition of a particular Ni-rich layer proceeds.
Therefore, the codeposition rate of Fe and Co is expected to decrease as the Ni-rich layer grows.
Here, we can see the same phenomenon as the one discussed for Ni-Cd and Ni-Fe alloys in the previous sections. The accumulation of the preferentially deposited metals in the early phase of the deposition of the Ni layer is so obvious that it can be detected also in the conventional sputtering direction, even though the resolution of the measurement in this sputtering mode is smaller than for the reverse sputtering mode. If we compare the Co and Fe signal intensities in the subsequent Ni layers, we can see a decrease. This is related to the current density applied during the deposition of each Ni layer. Since the Co2+ and Fe2+ ions are present in the bath in small concentrations only, their deposition beside Ni becomes diffusion limited. The larger the total current density, the larger the ratio of Ni deposition rate as compared to that of the impurities. Hence, the Fe and Co concentration in Ni is expected to decrease as the current density increases. This can be well seen in the data of Figure 13.
0 20 40 60 80 100 120 140 160
0 50 100 150
sputtering time, s signal intensity, 10 6 cps
Cu63 Cu65
Ni60
Ni62
Si28
Cr52 L
M H
Signal intensity, 106 cps
Figure 13. GD-ToFMS composition depth profile curve of a Si/Cr/Cu//[Ni-Cu/Cu]3 multilayer by showing major and minor metallic components. Top: linear intensity scale, bottom: logarithmic intensity scale.
The sample is identical to that depicted in Figure 12.
The GD-ToFMS method was particularly suitable to detect non-metallic minority components, too. Figure 14 shows the component depth profile of a finer multilayer structure with 40 nm thick layers. As the data show, the signal intensity of the minor components (C, Na and Cl) follow the same oscillation pattern as the multilayer and their intensity maxima coincide with those of Cu.
The composition depth profile spectra shown in Figure 14 are not sufficient alone to determine what causes the correlation between the intensity change of some components. The most likely reasons can be (i) the preferred codeposition of the impurities with Cu rather than Ni, (ii) the adsorption and co-adsorption of the components of the solution on Cu followed by their embedding by the growing layer, and (iii) the formation of cavities in Cu with a higher probability than in Ni. The codeposition theory seems to be rather unlikely since Na cannot be deposited at all at the potential where Cu is deposited, and chloride ions do not react at the cathode either. The adsorption of the citrate ions on copper is possible. Since the citric acid has several carboxilate groups and at the pH of the solution the protons can be dissociated, attachment of the Na+ ions by Coulombic interaction is well possible. If the detachment of the citrate ion (or its fragment) cannot take place before it is embedded by the growing Cu layer, all elements whose atoms are either present in the citrate ion itself or may accompany it can appear in the depth profile spectra. However, the simultaneous
0 20 40 60 80
0 40 80 120 160
sputtering time, s signal intensity, 106 cps
Ni60
Ni62 Co59 -20 mA (H)
-6 mA (M)
-2.25 mA (L)
substrate growth
direction
1.0E+03 1.0E+04 1.0E+05 1.0E+06 1.0E+07 1.0E+08
0 40 80 120 160
sputtering time, s
signal intensity, cps Ni60
Co59
Ni62
Fe56 108
107
106 105
104 103
occurrence of Cl still requires another explanation. The cavity formation in the Cu layer can explain the occurrence of all elements of the solution. However, in this case, sulfur should also be present in the cavities due to the relatively high sulfate ion concentration of the bath. In contrast with the expectation, the sulfur signal was around the background level throughout the measurement and did not exhibit a simultaneous oscillation with the rest of the solution components. This hints at the possibility that the cavity formation theory is to be abandoned, and the preferential occurrence of the impurities in the Cu layer is to be explained with some specific chemical interaction between the growing Cu surface and the solution components.
Figure 14. GD-ToFMS composition depth profile curve of a Si/Cr/Cu//[Ni-Cu/Cu]6 multilayer. Thickness of the Ni-Cu and intermediate Cu layers: 40 nm, thickness of the top Cu layer: 20 nm. The order of the Ni-Cu layers
follows the sequence of their deposition: H-M-L-H-M-L (from right to left in the graph). Dashed lines are drawn to the maxima of the Cu intensity and serve as a guide for the eye only. The two arrows indicate the
initial surface of the substrate (right) and the final surface of the deposit (left).
The quantitative analysis of the spectra shown in Figure 14 is shown in Figure 15. The quantitative analysis clearly shows the difference between the Ni and total iron-group metal content of the Ni- rich layers as a function of the Ni concentration. The lower the Ni concentration of the Ni-rich layer (i.e., the lower the current density), the larger the contribution of Co and Fe to the total iron-group metal content of the Ni-rich layers. The carbon concentration of the deposit is rather significant, ranging to 2 at.% in the Cu layers. It is important to note that the carbon content of a deposit practically always remains hidden regardless of the nature of the major metallic constituents if the analysis is made with EDXS in an electron microscope (in both SEM and TEM) since the carbon signal is typically attributed to surface impurities only. However, in the present measurement, the low intensity of the carbon signal during the sputtering of the Ni layer indicates that the vacuum system is clean. The surface impurity occurs only at the beginning of the sputtering process and it decays fast. The oscillation of the carbon signal after the sputtering of the Ni-rich layer just beneath the top Cu layer must be attributed to the feature of the bulk of the sample.
The bottom graph in Figure 15 shows the interrelation of the C and Cu content of the multilayer sample. As the carbon signal decays shortly after the start of the sputtering due to the removal of the surface impurities, the function travels nearly the same trajectory forth and back as the sputtering front reaches a Cu and a Ni-rich layer. This indicates that the incorporation of the carbon- containing impurity takes place in parallel with the deposition of Cu and it is likely caused by a specific chemical interaction.
1.E+02 1.E+03 1.E+04 1.E+05 1.E+06 1.E+07 1.E+08 1.E+09
0 40 80 120 160
sputtering time, s
signal intensity, cps
Cu
Ni
C
Na Cl 109
108 107 106 105 104 103 102
Figure 15. GD-ToFMS composition depth profile curve of a Si/Cr/Cu//[Ni-Cu/Cu]6 multilayer (same sample as for Figure 14). Top: quantitative depth profile; bottom: interrelation of the C and Cu content of the deposit.
Dashed lines serve a guide for the eye only.
Conclusions
It was shown that modern composition depth profiling methods like SNMS and GD-ToFMS can be used to gain highly specific composition depth profile information on electrodeposited alloys.
With the reverse sputtering direction, the near-substrate composition evolution can be revealed with unprecedented precision. It was shown that upon d.c. plating from unstirred solution, the preferentially deposited metal accumulates in the near-substrate zone, and the steady-state alloy composition sets in at about 150-200 nm deposit thickness only. If there is more than one preferentially deposited metal in the alloy, the accumulation zones of these metals occur in the order of the deposition preference. This accumulation zone can be eliminated by various means.
Well-controlled hydrodynamic conditions (like the application of rotating disc electrodes) lead to a significant reduction of both the component accumulation and the thickness of the transition period. Pulse plating has a similar impact where the systematic decrease in the duty cycle provides a gradual transition from a graded to a uniform composition depth profile. These observations can be very useful where attachment of a deposit to the substrate is highly impacted by the composition
0 0.2 0.4 0.6 0.8
0 200 400 600
Depth, nm
Mole fraction
C
Si
Cu Ni Ni+Co+Fe
0 0.02 0.04 0.06 0.08
0 0.2 0.4 0.6
Cu mole fraction
C mole fraction
surface contamination (beginning of the sputtering)


![Figure 12. GD-ToFMS composition depth profile curve of a Si/Cr/Cu//[Ni-Cu/Cu] 3 multilayer](https://thumb-eu.123doks.com/thumbv2/9dokorg/1419248.120087/18.892.211.669.102.441/figure-gd-tofms-composition-depth-profile-curve-multilayer.webp)
