A barycentric coordinates-based
visualization framework for movement of microscopic organisms ∗
Andrea Bodonyi
ab, Győző Kurucz
c, Gábor Holló
c, Roland Kunkli
baUniversity of Debrecen, Doctoral School of Informatics
bUniversity of Debrecen, Faculty of Informatics {bodonyi.andrea,kunkli.roland}@inf.unideb.hu
cUniversity of Debrecen, Faculty of Humanities kurucz.gyozo@arts.unideb.hu
hollogabor@gmail.com Submitted: December 22, 2020
Accepted: April 19, 2021 Published online: May 18, 2021
Abstract
As many research projects face the need to manage a large amount of gen- erated research-specific data, usually with a specific structure, the demand for visualization systems is common. Likewise, the emerging data volume could turn substantially transparent cast in a visual appearance. Also, the non-trivial character of the dataset made the construction of a custom vi- sualization necessary. Taking the possessed requirements into account, we designed a tool for processing the simulation data and handling the issue resulted from the indirectness with a previously analyzed barycentric conver- sion method. The system also visualizes the microscopic organism’s behavior and supports a straightforward data analysis through several built-in tools.
Keywords: Visualization framework, animation, movement, microscopic or- ganism, barycentric coordinates
AMS Subject Classification:68U05
∗This work was supported by the construction EFOP-3.6.3-VEKOP-16-2017-00002. The project was supported by the European Union, co-financed by the European Social Fund.
doi: https://doi.org/10.33039/ami.2021.04.006 url: https://ami.uni-eszterhazy.hu
61
1. Introduction
Dealing with a massive volume of research-specific data is a common problem in the case of a broad spectrum of research projects. It may be about searching for anomalies, patterns, or even visual forms of data; it usually leads to a visualization system’s demand. Inspecting the microscopic world is a perfect example as the users need to extract new knowledge regarding the ecosystem’s nature [4].
As our research aimed to explore various aspects of the microscopic organ- isms’ behavior in a well-defined environment [2, 3], we encountered the problem mentioned above. The research-specific data volume could, with high probability, provide for us some higher-level properties presented visually, being difficult to ob- serve otherwise. Thanks to the non-trivial characteristics of our output datasets, no out-of-the-box solution could be put into practice, which led us to design a visualization system satisfying the condition set.
This work’s main purpose is to demonstrate our visualization framework’s cre- ation process and operation to visualize microscopic organisms’ movement and behavior. The framework first needs to deal with the input dataset’s indirectness and obtain the environmental elements’ per-frame locations. We realized this by building on a method using barycentric coordinates to convert from local to global coordinates.
The object locating problem derives from the fact that the simulation dataset includes a frame sequence describing an organism’s step-by-step movement indi- rectly, by the environment’s behavior. Each frame consists of the environmental change from the previous step described from the organism’s perspective. Consid- ering this information, we had the demand for locating every element in the global world.
First, we would like to present the starting problem in Section 2 by describing the environmental elements and the data structure. Next, we give a brief overview of the method applied to the organism localization in its world in Section 3. We also demonstrate the implementation details and its features here. We continue with the system’s evaluation throughout several test cases and present their accuracy profile in Section 4 and close our paper with a conclusion in Section 5.
2. Problem definition
2.1. Environment description
The project aims to visualize a schematic, microscopic, free-moving organism that locomotes in a 3D watery environment. In this size range and environment, viscous forces dominate over inertial forces; thus, locomotion occurs in the realm of the so- called low Reynolds numbers (e.g., [6]), where locomotion is essentially a sort of
“creeping” through the water. The environment also contains stimuli relevant for the animal modeled by point-like light sources representing food.
The scene to be visualized involves several elements. In the center of the picture,
there is a moving organism having in our case a microscopic size. The organism is built up of its main body and several sensors with fixed fields of view. Different simulations may vary in the number, the field of view, and the positioning of the sensors on the organism-body.
The organism senses one particular food if it falls into the field of view of at least one sensor and its intensity is high enough to be relevant. The animal moves around the space, possibly perceiving some of the foods, even consuming them.
The organism “eats” a piece of food if its locomotion trajectory intersects the given food point, which is much smaller than the animal. Thus, to eat food, the animal has to have a precisely oriented locomotion.
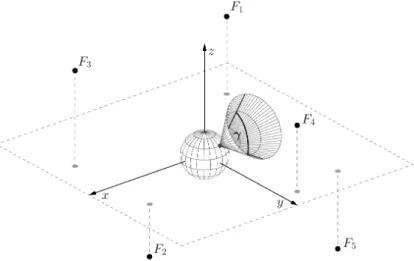
Figure 1 presents the main elements in the organism simulation. The main object located in origin represents the organism, which has a 𝛾 angle of view.
Points𝐹𝑖 (𝑖= 1,2, . . . ,5) mark the food positions in the environment.
Figure 1. Schematic overview of the main elements involved in the simulation of the organism.
The foods’ fixed lifetimes are supposed to imitate food consumption by other competitors in the space leading to the fact that some foods can expire. A food may disappear after the consumption by either our organism or one of the competitors (the food’s lifetime has expired).
2.2. Data structure
The simulation system’s only purpose is to simulate the organism’s behavior in its environment and its attitude to the foods. As it is only concerned with the simulation, the system does not provide any visual feedback. In each of the cases, the system’s output is a single dataset describing the step-by-step movement stored in a JSON format.
As Figure 2 shows, the data file contains the organism’s structural description.
It has a fixed size, several sensors, and an angle of view. The description also includes the spherical coordinates for the sensors, which indicate their position on the organism-body in its local coordinate system. In this example, the organism has four sensors distributed evenly with an 85-degree angle of view.
" structure " : {
" size " : 0.05,
" sensors " : [
{ " theta " : 0.523599, " phi " : 0.0 }, { " theta " : 0.523599, " phi " : 1.5708 }, { " theta " : 0.523599, " phi " : 3.14159 }, { " theta " : 0.523599, " phi " : 4.71239 } ],
" angleofview " : 85 }
Figure 2. Example output of the simulation framework, describing the structure of the organism.
Step-by-step movement data follow the structural description of the organism.
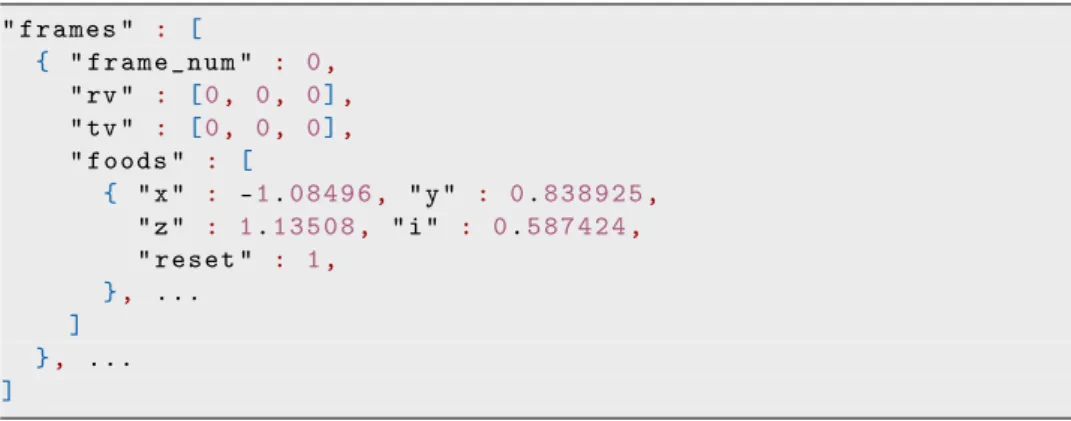
The frame sequence consisting of the steps defines the organism’s movement, each frame having the same structure. As Figure 3 presents, a frame object contains several attributes, such as the frame number, rotation vector, translation vector, and the food collection. A food object includes its coordinates relative to the organism, an intensity value, and a reset index, which indicates the potential food repositioning.
" frames " : [
{ " frame_num " : 0,
" rv " : [0, 0, 0],
" tv " : [0, 0, 0],
" foods " : [
{ "x" : -1.08496, "y" : 0.838925,
"z" : 1.13508, "i" : 0.587424,
" reset " : 1, }, ...
] }, ...
]
Figure 3. Example simulation output, describing the per-frame state of the simulated environment.
3. Visualization framework
3.1. Method for determining animal location
As the data sequence lacked the current organism positions, we needed to extract these location vectors from the indirect description of the movement relative to the organism. To this end, we implemented a previously presented mathematical method [1] for the conversion from local to the global coordinate system.
As presented in this prior work, solving the problem using the matrix-based approach leads to a higher overall floating-point error propagation, which is a direct result of relying on earlier frames. The strength of the barycentric method proposed in the previous work lies in the capability of avoiding such precision issues and in the ability to locate the object in the global system entirely without any information from earlier frames.
To apply the barycentric method to the problem at hand, we used the food po- sitions (defined in the organism’s local coordinate system) as the required reference positions. Such an approach was made possible by our prior knowledge about the simulated environment; in every input frame we have five food points, which satis- fies the constraints for obtaining the barycentric coordinates of a three-dimensional point.
With the thus-constructed reference frame available, the proposed method con- sists of two main steps. The purpose of the first step is to determine the barycentric coordinates of the central object in its local coordinate system. To this end, we relied on the fact that the input positions were relative to the organism; the direct consequence of this property is that the main object’s location is always (0,0,0).
Building on [5, p. 46] (with several simplifications) as a starting point, and using the mentioned information, we could determine the barycentric coordinates for use in the next step.
The second step of the barycentric method consists of applying the previously determined barycentric coordinates, which is the moving organism’s actual global position in the current step. This step requires a static basis in the global coordinate system. Assuming that the organism starts its path in the global origin, we own the information that the origins of the global and the organism’s local coordinate systems are the same in the first frame, which also means that the positions in the whole scene are in the global coordinate system in the starting moment. With this knowledge in our hands, we can form the required static basis by taking the first frame’s food positions. Thus, we can obtain the moving organism’s global position by converting the obtained barycentric coordinates back to the global system concerning the formed basis.
3.2. Food regeneration problem
One issue with our previously described usage of the barycentric approach is that the reference basis’s food positions are not always stationary. As we described earlier, the reference foods can arbitrarily disappear and reappear in other places,
making it necessary to update the static basis after every changing food locations.
Every food has a randomly generated, fixed lifetime in our simulation, repre- senting its other competitors’ consumption. As a result, a food can disappear either because the moving organism consumed it or because its lifetime expired, meaning that another animal consumed it.
There is always a replacement for the missing food with a new one at a new location. The newly appeared food point’s location is also in the organism’s local coordinate system, like every other one. When this situation occurs, we have to form a new reference basis with potentially new objects. To facilitate this, we can only rely on food positions for which we can obtain the global coordinates, but since we might not necessarily have required information about their world space positions (since they might have just appeared), we have to obtain their world space positions the same way as we calculate the position of the moving object.
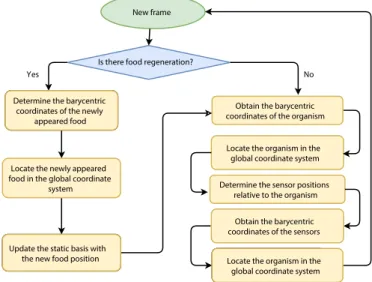
As it can be seen in Figure 4, the object locating problem always starts with an examination for food regeneration. The conversion is possible since every frame is guaranteed to contain more than four surrounding points, so if one disappears, we use the remaining ones as the reference points for the barycentric coordinates.
Is there food regeneration?
Obtain the barycentric coordinates of the organism Determining the barycentric
coordinates of the newly appeared food
New frame
Locate the organism in the global coordinate system
Determine the sensor positions relative to the organism
Locating the organism in the global coordinate system Updating the static basis with
the new food position Determine the barycentric
coordinates of the newly appeared food
Locate the newly appeared food in the global coordinate
system
Update the static basis with
the new food position Locate the organism in the
global coordinate system Obtain the barycentric coordinates of the sensors
Yes No
Figure 4. Building blocks of the localization method extended by the regeneration problem.
In the first step, we calculate the barycentric coordinates for the new reference objects based on the remaining four points of the frame, then use these to compute new global coordinates by weighting the world space positions of said remaining points the same way we did for the main object, as described in Section 3.1. In the last step, the newly calculated positions have to be stored as a new reference basis to use them later for the barycentric calculations.
3.3. Implementation
Considering all the requirements described in Section 2 and properties of the bary- centric method, we constructed a tool to process the datasets resulting from the organism simulation, to determine the necessary global positions and visualize the results in a three-dimensional scene. Figure 4 presents the entire process for locat- ing the object (including the ability to handle regenerated food points).
Throughout the framework’s implementation, we considered it essential to pro- vide a system capable of delivering an interactive visualization environment, which serves as an efficient means of exploring the input data with user-driven mecha- nisms.
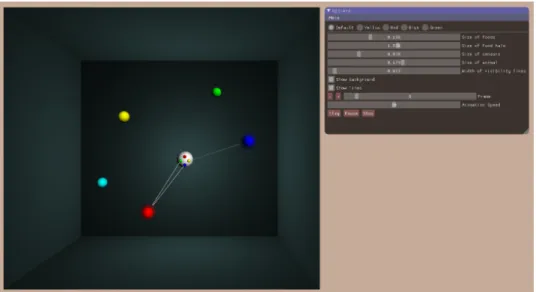
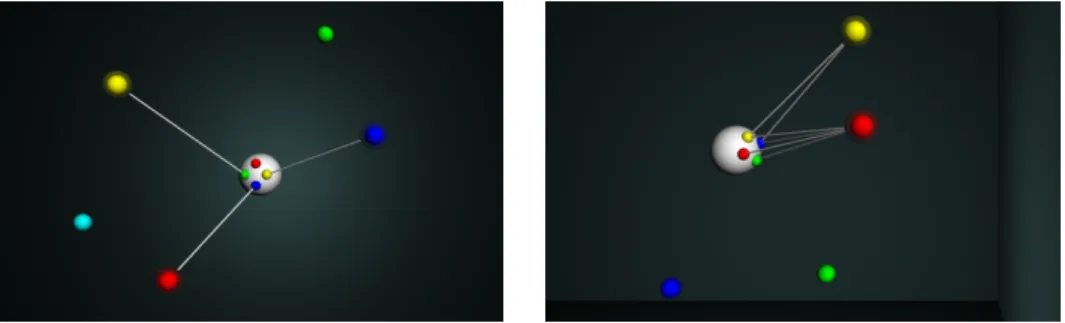
We implemented the visualization system using OpenGL in C++. Figure 5 shows an example output of the framework with the main elements. As shown in this example, the simulation objects are represented by spheres in our framework, mimicking the model described in Section 2.1. The object colors serve as a way for the efficient and unequivocal identification of the particular food objects and the sensors located on the organism-body.
Figure 5. Example output of the visualization framework. In this scenario, the central, white sphere representing the moving organ- ism perceives the red food with two sensors and the blue food with one sensor. The translucent haloes around the sensed foods and the
links to the appropriate sensor visualize the perceptions.
3.4. Features
While designing the framework, we implemented several functionalities that pro- vide the necessary tools for the users for an easy and transparent data analysis,
which offers an accessible way to answer their questions. First, we made the nav- igation in the frame sequence to any desired moment, both in the forward and backward direction. Similarly, there is a possibility of freezing the simulation at any time to move around the scene so that the user can examine the organism’s momentary behavior from multiple viewpoints. Furthermore, the camera can be repositioned arbitrarily into any existing sensor, narrowing down the viewpoint only to the region that the selected sensor perceives. The user can also manage specific visualization settings through the graphical user interface, such as object sizes, line widths, and object visibilities, which eases their ability to focus on any simulation aspect.
From the perspective of visual analytics, the marking of the food visibilities was essential. As already mentioned, the organism sensed one particular food if it falls into its field of view and has an intensity high enough to be relevant. First, foods perceived by at least one sensor are marked by a translucent halo with an adjustable size. Furthermore, we link the foods sensed with a line to the sensor(s) perceiving them, so it is easy to analyze which food the organism chooses for consumption and which direction the organism selects for movement. A bounding box surrounds the environment representing the maximum possible extent of the foods and animal positions from the loaded dataset.
Figure 6 shows two different moments from the same dataset visualization with a zoomed-in viewpoint. The halos and the links can easily determine the food visibilities. On the left side, three different sensors sense all of the three perceptible foods. By comparison, the organism perceives only two of the foods on the right side, but it senses the red one with all of the four sensors.
Figure 6. Two scenarios from the visualization framework with a zoomed in point of view with different food perceptions.
4. Results
To obtain our visualization system’s accuracy profile, we analyzed its precision characteristics through several different test scenarios. Since the datasets resulting from the simulation do not provide the true location information necessary for such
a comparison, we first had to produce a suitable basis for the precision measure- ments. To this end, we generated multiple different artificial animal movements, which established a baseline for testing the accuracy of the proposed barycentric approach.
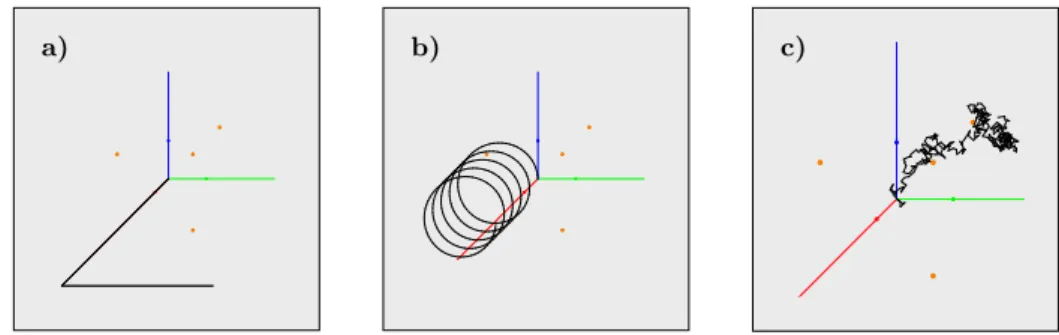
Figure 7 shows the movement paths in three of the aforementioned, custom generated test scenarios. Thanks to the absence of the organism’s physiological properties and the surrounding environment’s essential attributes, these object movements tend to be simpler and rule-following than the real-life organism be- havior. Black lines visualize the generated movement paths, and the orange points mark the reference food positions.
a) b) c)
Figure 7. Artificially generated movement paths. a) Periodic movement with a few direction changesb)Spiral movementc)Fully
random movement with random rotations.
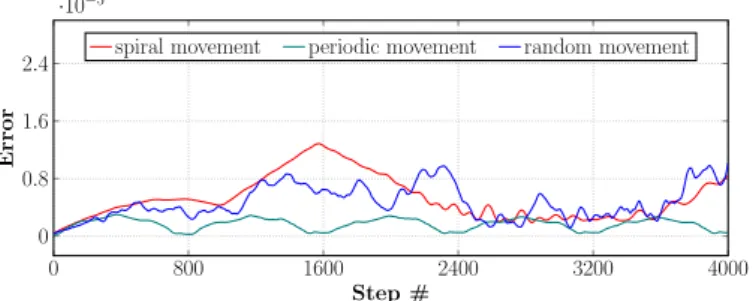
As the previous test cases provided us a ground-truth data for the resulting organism locations to be compared to, we concluded the precision measurements of the system in Figure 8 and Figure 9. The red line marks the location difference for the spiral movement, the green for the periodic movement with a few direction changes, while the blue for the random movement. Figure 8 presents these cases without any food replacement, while Figure 9 presents the precision in the same cases, but with a food regeneration in every 200 frames. The magnitude of the object positions extends to approximately 14–15 units. In Figure 8 and Figure 9 can be seen that the precision difference is about three to five magnitudes lower in each of the cases.
The analysis of the resulting error metrics showed that the reconstruction error and the average distance of the reference points from the animal correlate in each frame. This is best illustrated by the oscillation of the error in the case of the spiral movement with regenerating foods, where the reference points tend to get clustered after a number of food regenerations, which leads to a constantly alter- nating increase and decrease of the average animal-food distances as the animal traverses the spiral path.
Finally, we evaluated our visualization system on real-life datasets, which de- scribed a specific organism’s movement in their well-defined environment. We show a few of such datasets in Figure 10. Specific cases differed in the attributes of the
organism and the movement lengths. The tested datasets’ organisms contained varying numbers of sensors in a potentially different alignment in each input sce- nario. The dataset owners validated the output of the system in these cases.
0 800 1600 2400 3200 4000
0 0.8 1.6 2.4
·10−5
Step #
Error
spiral movement periodic movement random movement
Figure 8. Precision measurements for the artificially generated movement paths shown in Figure 7 without food regeneration.
0 800 1600 2400 3200 4000
0 0.6 1.2 1.8 2.4
3·10−4
Step #
Error
spiral movement periodic movement random movement
Figure 9. Precision measurements for the artificially generated movement paths shown in Figure 7 with a food regeneration in
every 200 frames.
a) b) c)
Figure 10. Movement paths generated using real-life datasets.
The three paths are traversed by organisms with different sensor positions.
5. Conclusion
In this paper we presented our framework’s creation process and operation, aiming to visualize microscopic organisms’ movement and behavior in a well-defined envi- ronment. Considering all the requirements demonstrated in this work and putting the proposed barycentric method in [1] into practice, we created a research-specific data processing tool, dealing with the speciality arising from the type of data and delivering the results’ visualization in a three-dimensional scene. It facilitates ef- ficient analysis of the input data through real-time, user-driven mechanisms such as simulation freezing, scene inspection from multiple viewpoints, using analytical tools, and managing visualization-specific settings.
We first demonstrated the problem leading to our system’s demand by a world description and presenting the special data structure. Then we gave a brief overview of the method building on barycentric coordinates for the conversion process that originates from the need to go from local to global coordinates. Building on the barycentric method, we could solve the problem given by the research-specific datasets’ non-trivial characteristics. Next, we presented the implementation de- tails and our framework’s operation throughout the description of unique features making a transparent and straightforward data analysis possible.
As soon as the system’s design process was finished, we installed it to the main research project regarding the properties of microscopic organisms’ behavior.
During its operation, our tool provided for us a wide range of higher-level knowledge through transforming our simulation data into a visual form, which would otherwise has been left unnoticed by the tool. We could exploit a great benefit in the moments when a portion of food was just being consumed in front of our organism. The recognition of which direction the organism chose to replan its way for the nutrition was a cardinal question, and along with several issues, they would not have been observable without any visual representation.
References
[1] A. Bodonyi,R. Kunkli:Efficient object location determination and error analysis based on barycentric coordinates, Visual Computing for Industry, Biomedicine, and Art 3 (2020), 18:1–7,
doi:https://doi.org/10.1186/s42492-020-00052-y.
[2] G. Holló:A new paradigm for animal symmetry, Interface Focus 5.6 (2015), 20150032:1–10, doi:https://doi.org/10.1098/rsfs.2015.0032.
[3] G. Holló,M. Novák:The manoeuvrability hypothesis to explain the maintenance of bilateral symmetry in animal evolution, Biology Direct 7.1 (2012), 22:1–7,
doi:https://doi.org/10.1186/1745-6150-7-22.
[4] T. Ishikawa:Suspension biomechanics of swimming microbes, Journal of The Royal Society Interface 6.39 (2009), pp. 815–834,
doi:https://doi.org/10.1098/rsif.2009.0223.
[5] S. Marschner,P. Shirley:Fundamentals of Computer Graphics, 4th ed., A K Peters/CRC Press, 2015,isbn: 9781482229394.
[6] S. Vogel:Comparative Biomechanics: Life’s Physical World, 2nd ed., Princeton University Press, 2013,isbn: 9780691155661.