https://doi.org/10.1007/s11120-018-0594-9 EMERGING TECHNIQUES
Maximum fluorescence and electron transport kinetics determined by light-induced fluorescence transients (LIFT) for photosynthesis phenotyping
Beat Keller1,3 · Imre Vass2 · Shizue Matsubara1 · Kenny Paul2 · Christoph Jedmowski1 · Roland Pieruschka1 · Ladislav Nedbal1 · Uwe Rascher1 · Onno Muller1
Received: 10 November 2017 / Accepted: 9 October 2018 / Published online: 24 October 2018
© The Author(s) 2018
Abstract
Photosynthetic phenotyping requires quick characterization of dynamic traits when measuring large plant numbers in a fluctu- ating environment. Here, we evaluated the light-induced fluorescence transient (LIFT) method for its capacity to yield rapidly fluorometric parameters from 0.6 m distance. The close approximation of LIFT to conventional chlorophyll fluorescence (ChlF) parameters is shown under controlled conditions in spinach leaves and isolated thylakoids when electron transport was impaired by anoxic conditions or chemical inhibitors. The ChlF rise from minimum fluorescence (Fo) to maximum fluorescence induced by fast repetition rate (Fm−FRR) flashes was dominated by reduction of the primary electron acceptor in photosystem II (QA). The subsequent reoxidation of QA− was quantified using the relaxation of ChlF in 0.65 ms (Fr1) and 120 ms (Fr2) phases. Reoxidation efficiency of QA− (Fr1/Fv, where Fv = Fm−FRR − Fo) decreased when electron transport was impaired, while quantum efficiency of photosystem II (Fv/Fm) showed often no significant effect. ChlF relaxations of the LIFT were similar to an independent other method. Under increasing light intensities, Fr2′/Fq′ (where Fr2′ and Fq′ represent Fr2 and Fv in the light-adapted state, respectively) was hardly affected, whereas the operating efficiency of photosystem II (Fq′/Fm′) decreased due to non-photochemical quenching. Fm−FRR was significantly lower than the ChlF maximum induced by multiple turnover (Fm−MT) flashes. However, the resulting Fv/Fm and Fq′/Fm′ from both flashes were highly correlated.
The LIFT method complements Fv/Fm with information about efficiency of electron transport. Measurements in situ and from a distance facilitate application in high-throughput and automated phenotyping.
Keywords Fluorescence transient · Photosynthesis · Fast repetition rate · Electron transport kinetics
Introduction
Photosynthetic processes, from light absorption by the chlorophyll-based pigments through charge separation in the photosystem II (PSII) reaction centers and sequential electron transport, are related to the redox state of the pri- mary quinone electron acceptor (QA) and coupled to the signature of chlorophyll fluorescence (ChlF) (Kautsky and Hirsch 1931; Baker 2008; Müh et al. 2012). Based on ChlF, parameters such as the maximum quantum efficiency of PSII (Fv/Fm) and non-photochemical quenching (NPQ) estimating the proportion of absorbed light energy utilized for PSII photochemistry and non-photochemical energy dis- sipation, respectively, were established (Butler 1978; Baker 2008; Lazár 2013). The quick assessment of ChlF makes this signal a powerful tool for plant phenotyping (Furbank and Tester 2011; Fiorani and Schurr 2013). Phenotyping
Electronic supplementary material The online version of this article (https ://doi.org/10.1007/s1112 0-018-0594-9) contains supplementary material, which is available to authorized users.
* Beat Keller
beat.keller@usys.ethz.ch
1 Institute of Bio- and Geosciences, IBG-2: Plant Sciences, Forschungszentrum Jülich GmbH, 52425 Jülich, Germany
2 Institute of Plant Biology, Biological Research Center, 6726 Szeged, Hungary
3 Present Address: Molecular Plant Breeding, ETH Zürich, 8092 Zurich, Switzerland
requires characterization of a large plant set which needs to be completed before significant changes in the measured traits occur. This is particularly difficult when phenotyping photosynthesis because this process is highly dynamic and sensitive to environmental conditions (Ananyev et al. 2005a;
Kono and Terashima 2014).
In order to determine Fv/Fm, the ChlF signal is compared under conditions when QA is in a fully oxidized state result- ing in minimal ChlF (Fo) respective to the fully reduced state resulting in maximal ChlF (Fm). Two approaches using strong light pulses are widely accepted to reduce QA fully:
the single turnover flash (STF) and the multiple turnover flash (MTF) (Kalaji et al. 2017). A saturating STF has to provide high enough excitation power to induce one sin- gle charge separation in all PSII reaction centers and fully reduce QA in order to yield maximum ChlF level (Fm−ST) (Malkin and Kok 1966; Schreiber 1986a; Samson and Bruce 1996; Kolber et al. 1998; Steffen et al. 2001). The excita- tion flash needs to be short enough (from fs to few µs) to prevent reoxidation of QA− and reexcitation of PSII reaction centers (Malkin and Kok 1966; Belyaeva et al. 2014). In contrast, a saturating MTF requires at least 0.2-s duration of excitation at a few 1000 µmol photons m−2 s−1 (Ögren and Baker 1985; Schreiber et al. 1986b; Schreiber 2004).
Within this time range, QA is reduced and reoxidized several times followed by reduction of the plastoquinone (PQ) pool and electron transfer to Photosystem I (PSI) (Vernotte et al.
1979; Schansker et al. 2005). MTFs ultimately result in an about 50% higher maximum ChlF level (Fm−MT) compared to Fm−ST (Schreiber 1986a; Schreiber et al. 1986b; Schan- sker et al. 2011). The difference between Fm−ST and Fm−MT was named the thermal phase because it is dependent on temperature, i.e., it is rate-limited (Delosme 1967). Later, the ChlF rise of the thermal phase was related to electron transport kinetics, particularly the accumulation of second- ary quinone acceptors (QB) in a reduced state (Strasser et al.
1995; Lazár 2006). However, the origin of the thermal phase is not yet localized due to the complex and overlying kinet- ics of different electron transport processes (Rascher and Nedbal 2006; Müh et al. 2012) and the probable involvement of additional ChlF quenchers (Schansker et al. 2011, 2014;
Prášil et al. 2018; Magyar et al. 2018).
Alternatively, electron transport kinetics in the dark- adapted state were studied by following reoxidation of QA− coupled to ChlF relaxation after a STF (Vass et al.
1999; Petrouleas and Crofts 2005). According to an exponential decay model with three time constants, ChlF relaxes due to electron transport from QA− to QB with a time constant (τ1) of 0.1–0.2 ms when the QB site is occu- pied by a PQ (Bowes and Crofts 1980; Vass et al. 1999;
Shinkarev 2004; Petrouleas and Crofts 2005). The sec- ond exponential component represents the reoxidation of QA− which had initially no PQ molecule bound (Taoka
and Crofts 1990; Petrouleas and Crofts 2005). Therefore, this time constant (τ2) represents the binding of PQ mol- ecule to the QB site of PSII and is estimated to be between 2.2 and 10 ms (Vass et al. 1999; Eshaghi et al. 2000).
The third component (τ3) is slow (500 ms to seconds) and interpreted as a back reaction from QA− to the donor side components of PSII, specifically the S2 state of the oxygen evolving complex (OEC) (Robinson and Crofts 1983; Vass et al. 1999). Most of the existing ChlF-based techniques apply STFs either from a measuring head in direct contact with the leaf surface, or from a few cm dis- tance. Fm−ST is then recorded from a dark-adapted sample with an oxidized electron transport chain (Vernotte et al.
1979; Schansker et al. 2014). This allows standardized examination and modeling of ChlF relaxation kinetics in the dark (Vass et al. 1999). However, these requirements are impractical under conditions of ambient illumination, specifically when the presence of light is required for manifestation of stress conditions in the targeted plants.
One such example is temperature stress, where low tem- perature enhances the photodamage effects of excess light (Pieruschka et al. 2010). In addition, the conventional fluo- rometric techniques may not provide sufficient resolution and throughput to capture highly dynamic regulation of photosynthesis.
The light-induced fluorescence transient (LIFT) method probes PSII from a distance using subsaturating (actinic) measuring flashlets in fast repetition rate (FRR) (Kolber et al. 1998; Osmond et al. 2017). In contrast to other tech- niques, no separate saturating flash is required in the LIFT method because the FRR probe flashlets are used directly for that purpose. The short measuring time of 0.2 s allows integration into automated systems for phenotyping in high spatio-temporal resolution. Following application in marine research (Kolber et al. 1998; Suggett et al. 2001;
Oxborough et al. 2012; Robinson et al. 2014), a stationary LIFT system was installed for monitoring plant canopy from a distance of 50 m using laser excitation (Pieruschka et al. 2010, 2014; Raesch et al. 2014). Operating efficiency of PSII (Fq′/Fm′) measured with this previous LIFT system correlated well with pulse amplitude modulation (PAM) measurements (R2 = 0.89) and CO2 assimilation rates (R2 = 0.94) (Ananyev et al. 2005a; Pieruschka et al. 2010, 2014).
Here, we evaluated a newly developed LIFT device for its capacity to yield robust fluorometric parameters useful in plant phenotyping. Parameters as maximum ChlF induced by FRR flash (Fm−FRR) and QA− reoxidation efficiency in 0.65 ms (Fr1/Fv) and 120 ms (Fr2/Fv) relaxation phases were introduced. The parameters were determined in isolated thy- lakoids and intact plants subjected to different treatments (electron transport inhibitors, anaerobiosis, or light) and approximated well-established ChlF parameters.
Materials and methods
Plant cultivationIn total, 36 spinach (Spinacia oleracea) plants of genotype Matador were grown in the greenhouse in Jülich, Ger- many, under 16-h/8-h day/night cycle at 20 °C/18 °C. Light intensity was kept automatically between 60 and 300 µmol photons m−2 s−1 using additional lamps or shading nets.
400-mL pots were filled with a turf-clay substrate (ED73, Einheitserdewerke, Sinntal-Altengronau, Germany). Plants were watered automatically twice a day during cultivation.
Measurements were performed using plants 28 or 32 days after sowing.
Isolation of thylakoids and PSII enriched membrane particles
For isolation of spinach thylakoids and PSII-enriched thy- lakoid membrane particles (BBY particles), fresh spinach leaves were bought from a local supermarket in Szeged, Hungary, and prepared as described in Berthold et al.
(1981). For measurements with LIFT and FL3000, the final concentration of thylakoids was adjusted to equivalent chlo- rophyll a concentration of 10 µM (~ 10 µg mL−1).
DCMU and DBMIB treatment
To manipulate the ChlF relaxation kinetics in thylakoid samples, we used 3-(3,4-dichlorophenyl)-1,1-dimethylurea (DCMU) and 2,5-dibromo-5-methyl-6-isopropyl-benzoqui- none (DBMIB), which inhibit selectively the reoxidation of QA− in PSII and of PQH2 at the cytb6f complex, respectively (Lazár et al. 2001; Kurisu et al. 2003). A thylakoid suspen- sion of 3 mL was transferred to transparent plastic cuvettes.
After 5-min dark-adaption, DCMU and DBMIB were added to final concentration of 5 µM (1.17 µg mL−1) and 0.66 µM (0.213 µg mL−1), respectively. Samples were stirred manu- ally and followed by either LIFT or FL3000 measurements using FRR flash for 0.75 ms (FRRF0.75ms) or STF, respec- tively. The number of technical replicates was 3–5. In addi- tion, intact leaves were treated with DCMU to observe ChlF induction curves under conditions of blocked electron transport between QA and QB. Plants were dark-adapted overnight, then fully expanded leaves were left untreated or were subjected to 200 µM DCMU in 50 mL Milli-Q water (Tóth et al. 2005). The control was left untreated because a control with 1% ethanol in distilled water showed no effect on Fm and little effect on the ChlF rise compared to untreated leaves (Tóth et al. 2005). However, no etha- nol was used in the DCMU solution to avoid possible side
effects (Haldimann and Tsimilli-Michael 2005). DCMU was grinded to powder in order to dissolve it better in water. In the dark, one leaf per plant was left for 6 h in DCMU solu- tion, then wiped and left for 30 min in the air. Measurements on attached leaves were done using 5 FRRFs0.75ms followed by one MTF for 750 ms (MTF750ms). Only the first of the 5 FRRFs0.75ms is shown in the result section. Measurements were replicated with six different plants.
Anaerobic treatment under nitrogen atmosphere Oxygen depletion inhibits the plastid terminal oxidase (PTOX), which normally keeps PQ in an oxidized state in the dark (Bohme et al. 1971; Cournac et al. 2000; Feilke et al. 2014). Anoxic treatment was used to manipulate the level of PQ reduction non-invasively in living plants (Tóth et al. 2007b). The anoxic atmosphere was maintained in the LI-COR 6400 transparent 2 × 3 cm chamber head (LI-COR, Inc., Nebraska USA) using nitrogen gas (N2). Air inflow into the chamber came either from the ambient air (as control, with 400 ppm CO2) or from N2 gas supply without oxygen (containing < 1.5 ppm CO2). The air flow rate during the measurements was 300 µmol air s−1, and the block tempera- ture of the LI-COR was kept at 20 °C. Prior to measure- ments, plants were dark-adapted overnight. A fully expanded leaf was inserted into the chamber and measured with the LIFT instrument through the transparent front window.
Measurements were started after 5-min exposure to con- trol or N2 atmosphere using 5 FRRFs0.75ms followed by one MTF750ms. After another 5 min, measurements were repeated using 5 FRR flashes for 2.5 ms (FRRFs2.5ms). Each first flash of the 5 FRRFs0.75ms and 5 FRRFs2.5ms is shown the result section. Measurements were replicated with six different plants.
Light response curves
To study electron transport kinetics of light-adapted plants, control plants of the N2 atmosphere experiment were sub- jected to increasing levels of blue light provided by the LED (445 nm) light source of the LIFT instrument. The size of the illumination spot was around 3 cm2. A light response measurement consisted of a total of 160 FRRF0.75ms trig- gered at a 5-s interval. At every light intensity (30, 100, 300, 700 µmol photons m−2 s−1), ChlF was monitored over a period of 200 s by applying 40 consecutive FRRF0.75ms. Light response curves were replicated with six different plants.
Fluorescence measurements
Different methods have been developed to separate abso- lute ChlF intensity and background radiation from relative
changes of ChlF yield due to QA reduction. This allows com- parison of minimal ChlF (Fo in dark-adapted state, and F′ in background light) and maximal ChlF (Fm in dark-adapted state, and Fm′ in background light) at initial redox state of QA and when QA is fully reduced at the end of a saturating flash, respectively (Schreiber et al. 1986a; Strasser et al. 1995;
Kolber et al. 1998). Two different fluorometers as described below were used in this study. The LIFT method requires no additional saturating light pulse besides the measuring flashlets. Therefore, it is referred to as a modulated method.
In contrast, the FL3000 fluorometer uses weak measuring pulses and a strong excitation flash. Therefore, it is referred to as a double-modulated method.
FL3000 measurements
ChlF relaxation after a STF was monitored by weak, non- actinic measuring flashes in increasing time intervals (Trtilek et al. 1997; Vass et al. 1999). These double-modulated ChlF measurements were performed with a FL3000 fluorometer (Photon Systems Instruments Ltd., Brno, Czech Republic) (Trtilek et al. 1997). The instrument is equipped with red LEDs (639 nm) for both actinic (20 µs with an excitation power of 1020 µmol photons m−2 s−1) and weak, non-actinic measuring flashes of 8 µs, with a measuring delay of 7 µs.
Changes in ChlF yield can be measured in a very broad time range, from 100 µs to 100 s. Within this time range, reoxida- tion of QA− by both forward and backward reactions can be studied (Vass et al. 1999). The reoxidation phase after the STF usually shows three relaxation phases with correspond- ing τ1, τ2, and τ3 time constants.
LIFT measurements
The newly developed compact LIFT instrument (Version LIFT-REM, Soliense Inc., New York, USA) is equipped with a blue LED (445 nm) excitation source. Excitation protocols composed of up to 7500 flashlets are used to manipulate the level of photosynthetic activity and ChlF (Fig. 1). ChlF emission is detected at 685 (± 10) nm. The LIFT device monitors any background signal in the detector range during inter-flashlet periods and subtracts this signal from the in-flashlet ChlF signal. The ChlF yield is internally normalized against excitation power of each flashlet to cor- rect for smaller fluctuations. Flashlet excitation power along the entire FRR excitation phase is kept at a constant level.
This was verified by observing a flat fluorescence transient using a fluorescence standard with constant quantum yield of fluorescence.
All measurements were done from a 0.6 m distance with flashlet length of 1.6 µs. The three used FRR flashes differ in the length of flashlet interval and ChlF induction phase (Table 1). FRRF0.75ms consists of 300 flashlets with a 2.5-µs
interval summing up to the 0.75 ms induction phase. The ChlF relaxation phase after the FRRF0.75ms consists of 127 flashlets. The interval between those flashlets increases exponentially with
where ji is the interval length of the ith flashlet. For the DCMU and DBMIB experiments, the excitation power was approximately 20,000 µmol photons m−2 s−1 for the ChlF induction phase using FRRF0.75ms. Due to the restricted excitation power of the LEDs, the FRRF0.75ms lasts longer than a proper STF in order to get Fm−FRR saturated. For intact plants, the excitation power was 40,000, 24,000, and 1000 µmol photons m−2 s−1 for the ChlF induction phase using FRRF0.75ms, FRRF2.5ms, and MTF750ms, respec- tively. The interval between the flashlets for MTF750ms was extended from 2.5 to 100 µs due to exhausting of LED at
ji=101.28+0.0215×i𝜇s,
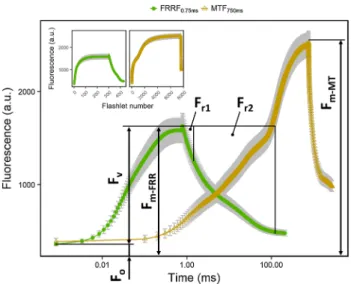
Fig. 1 Chlorophyll fluorescence transients of spinach leaves induced by fast repetition rate flash (FRRF0.75ms) and multiple turnover flash (MTF750ms) are presented on a logarithmic time scale. The FRRF0.75ms protocol (green circles) consists of 300 subsaturating flashlets (40,000 µmol photons m−2 s−1) in the first 0.75 ms to satu- rate maximum fluorescence (Fm−FRR). Minimum fluorescence (Fo), Fm−FRR, and variable fluorescence (Fv) were used for calculation of the quantum efficiency of photosystem II (Fv/Fm) in the dark-adapted state. The excitation flash is followed by 127 flashlets at exponen- tial decreasing repetition rate resulting in chlorophyll fluorescence relaxation. The area above this relaxation curve was restricted by two time period (r1 = 0.65 ms and r2 = 120 ms after Fm−FRR was reached) resulting in two relaxation phases (Fr1 and Fr2). The areas were normalized with the corresponding time period and with Fv in order to retrieve the reoxidation efficiency of the primary quinone acceptor (QA) in the given relaxation phases (Fr1/Fv and Fr2/Fv). The MTF750ms (yellow triangles) protocol consists of 7500 subsaturating flashlets (1000 µmol photons m−2 s−1) in the first 750 ms and induced the maximum fluorescence (Fm−MT). Inset: Chlorophyll fluorescence transients against flashlet number of FRRF0.75ms and MTF750ms are shown. Error bars show standard deviation of the mean (n = 6 plants).
(Color figure online)
longer flashes. This resulted in the lower excitation power.
Excitation power was measured at 1% duty cycle using a 5-s calibration flash measured by a quantum sensor (LI-190R, LI-COR, Inc.) and then extrapolated to 100%. For applica- tion of constant actinic light, the intensity of the blue LIFT LED in DC mode was calibrated using a quantum sensor (LI-190R, LI-COR, Inc.) at 0.6-m distance.
Analysis of LIFT and FL3000 raw data
For the calculation of Fv/Fm, the variable ChlF (FV) is the difference between Fm and Fo. In the LIFT analysis, Fm is represented by Fm−FRR as the averaged ChlF yield of 301st–302nd flashlet. Fo is the ChlF yield of the first flashlet (Fig. 1). In the FL3000 analysis, Fm is represented by Fm−ST and measured 0.15 ms after the STF. Fo is measured before the STF. The QA− reoxidation efficiency is calculated from the ChlF relaxation kinetics as follows:
Here, Fi is the ChlF yield in the relaxation phase at flashlet i. Fi is multiplied by ji and summed up to represent the area of ChlF relaxation up to t1 = 0.65 ms (for Fr1) and t2 = 120 ms (for Fr2). In case of the FL3000 data, the time points for t1 and t2 were 0.52 ms and 100 ms after the STF, respectively, due to different relaxation protocols. The light- adapted states of Fo, Fm−FRR, Fv, and Fr1,2 are denoted as F′, Fm−FRR′, Fq′, and Fr1,2′, respectively.
Statistics
Analysis of variance (ANOVA) was used to calculate sig- nificant differences (p < 0.05) followed by Tukey’s test for pairwise comparison. Due to the small sample size (n < 7), normal distribution and homogeneity of variance were assumed. Analysis was done by R program using the mult- comp package.
Fr1,2/ FV =
(
FV×t1,2−∑ Fi×ji
)/(
FV ×t1,2)
Results
Photosynthetic characteristics were studied by measuring light-induced ChlF transients using both the modulated LIFT and the double-modulated FL3000 device with an emphasis on the properties of electron transport from PSII towards PSI.
Determination of Fm levels and electron transport kinetics
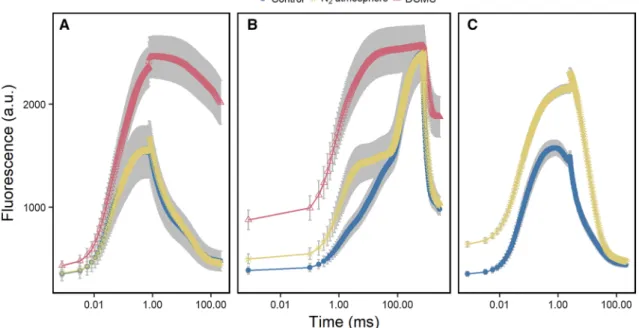
We used the FRRF0.75ms and MTF750ms protocol to study the Induction of Fm−FRR and Fm−MT, respectively (Table 1). The Fm−FRR in control leaves was significantly lower than Fm−MT (Figs. 1, 2a, b). Under control conditions, Fm−FRR saturated earliest at about 0.25 ms depending on the excitation power (Fig. S1). At the end of the induction phase, a small peak of ChlF occurs pointing towards a minor ChlF quenching during the high excitation power of the FRRF0.75ms. These spikes contributed to Fm−FRR resulting in Fv/Fm values inde- pendent of the excitation power. In contrast, Fm−MT in intact leaves was reached after 750 ms and showed the same Fm−MT as in the presence of DCMU (Fig. 2b).
We studied ChlF relaxation on attached leaves in the dark by using FRRF0.75ms under control and N2 atmosphere.
The absence of O2 in the latter condition prevents reoxida- tion of the PQ pool in the dark (Tóth et al. 2007b). After 5 min in the N2 atmosphere, ChlF relaxation phase was sig- nificantly altered compared to control conditions (Fig. 2a).
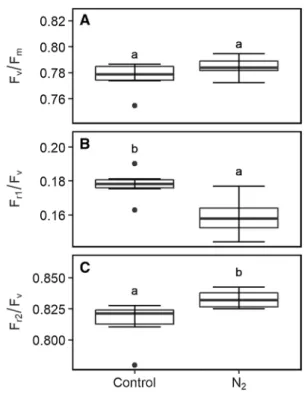
While Fv/Fm did not change under control and N2 atmos- phere, Fr1/Fv in the N2 atmosphere decreased significantly to 0.16 (± 0.01) compared to 0.18 (± 0.01) in the control (Fig. 3). In contrast, Fr2/Fv was significantly increased in the N2 atmosphere compared to the control. Notably, also the ChlF induction phase of MTF750ms differed in N2 atmos- phere compared to control (Fig. 2b). Following MTF750ms, we kept the plants for additional 5 min under the control or N2 atmosphere. This allowed S-states of the OEC to relax in the dark (Kolber et al. 1998), whereas the PQ pool remained reduced in the N2 atmosphere. Then a subsequent measure- ment using FRRF2.5ms was initiated. Fm−FRR in the control
Table 1 Different excitation protocols are shown: Fast repetition rate flash for 0.75 ms (FRRF0.75ms) and for 2.5 ms (FRRF2.5ms) as well as saturating multiple turnover flash for 750 ms (MTF750ms). In the induction phase, flashlet interval is constant for given amount of
flashlets and interval, while it increases exponentially in the relaxa- tion phase to allow reoxidation of the primary quinone acceptor (QA).
Flashlet length is always 1.6 µs and has in all flashes the same speci- fied excitation power
Excitation protocol Induction
phase (ms) Number of flashlets in
induction phase Flashlet interval in
induction phase (µs) Relaxation
phase (ms) Number of flashlets in
relaxation phase Flashlet length (µs)
FRRF0.75ms 0.75 300 2.5 209 127 1.6
FRRF2.5ms 2.5 1000 2.5 209 127 1.6
MTF750ms 750 7500 100 1975 127 1.6
treatment was reached at around 750 µs and then the ChlF signal started to decline (Fig. 2c). In the N2 atmosphere, the ChlF level continued to increase during the FRRF2.5ms without reaching saturation. This resulted in a signifi- cantly increased Fm−FRR relative to the control. In addition, Fo levels were higher in the N2 atmosphere compared to control in the subsequent flashes (Fig. 2b, c). This led to significantly lowered Fv/Fm under N2 atmosphere using FRRF2.5ms (p value < 0.001). In summary, Fm−MT induction in untreated leaves using MTF750ms was confirmed by the same Fm induced in DCMU-treated leaves. Full saturation of Fm−FRR level was confirmed using FRRF2.5ms under two conditions: (1) plants were in controlled, aerobic conditions (PQ pool was oxidized); and (2) the leaf was fully dark- adapted (OEC mainly in the S1-state) (Delosme and Joliot 2002). The influence of increased PQ pool reduction was reflected in decreased Fr1/Fv, and increased Fo and Fm−FRR. Comparison of electron transport kinetics measured by the LIFT and FL3000 device
We compared the ChlF relaxation kinetics acquired by the modulated LIFT to those of the double-modulated FL3000 device. For that purpose, we treated the thylakoids with different electron transport inhibitors. The two methods resulted in similar ChlF relaxation curves (Fig. 4). The
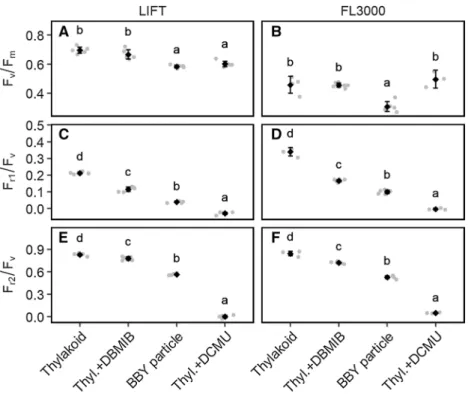
Fv/Fm values calculated from the LIFT measurements ranged between 0.58 (± 0.01) for BBY and 0.7 (± 0.02) for thylakoids (Fig. 5a). The FL3000 device showed generally lower Fv/Fm values: 0.31 (± 0.04) for BBY particles and 0.49 (± 0.02) for thylakoids (Fig. 5b). In BBY particles, electron transport is impaired after the QB site since the PQ pool is partly, and the PSI fully removed (Berthold et al. 1981). DBMIB binds to the cytb6f complex, which blocks the reoxidation of the PQ pool (Bohme et al. 1971).
Consequently, BBYs and DBMIB-treated thylakoids showed slower ChlF relaxation kinetics compared to thy- lakoids, resulting in significantly lower Fr1/Fv and Fr2/Fv values in both methods (Fig. 5c–f). Fr1/Fv for the LIFT device ranged from 0.21 (± 0.008) for thylakoids to 0.04 (± 0.008) for BBY (Fig. 5c). The Fr1/Fv values calculated from the FL3000 measurements were in general higher (e.g., 0.34 (± 0.025) for thylakoids and 0.1 (± 0.013) for BBY, Fig. 5d) but showed the same tendency as in the LIFT measurements. Fr2/Fv showed increasing differ- ence between the control and treated samples reflecting impaired electron transport (Fig. 5e, f). In summary, Fr1/Fv and Fr2/Fv measured with both devices responded specifi- cally to the treatments which block electron transport at different steps.
Fig. 2 Dark-adapted spinach leaves were subjected to a 3-(3,4-dichlorophenyl)-1,1-dimethylurea (DCMU) treatment and nitrogen (N2) atmosphere, which prevent reoxidation of the primary quinone acceptor (QA), and plastoquinone (PQ) pool in the dark, respectively. Under those treatments, fast repetition rate flash for 0.75 ms (FRRF0.75ms, a), multiple turnover flash (MTF750ms, b), and fast repetition rate flash for 2.5 ms (FRRF2.5ms, c) were used to study
chlorophyll fluorescence induction and relaxation. FRRF0.75ms was performed after 5 min in control or N2 atmosphere (for DCMU treat- ment see “Materials and methods” section). MTF750ms was performed after FRRF0.75ms. FRRF2.5ms was performed after additional 5 min in control or N2 atmosphere. Chlorophyll fluorescence transients are presented on a logarithmic time scale. Error bars showing standard deviation of the mean (n = 6 plants)
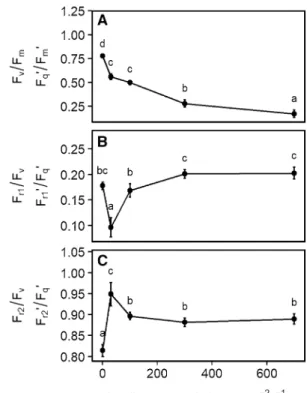
Electron transport kinetics measured under ambient light
We measured light-response curves on attached spinach leaves in order to follow the light saturation of electron transport rate. F′ initially increased with increasing light intensities, but this increase was then reversed, most likely due to NPQ formation (Fig. 6a). Simultaneously, Fm−FRR′ decreased in response to increasing light intensities due to NPQ formation. Fm−FRR′ showed smaller absolute dif- ferences than Fm−MT′ compared to the corresponding dark- adapted states (Fig. 6b).
The Fq′/Fm′ values we obtained with the FRRF0.75ms pro- tocol correlated highly with Fq′/Fm′ values we retrieved with the MTF750ms protocol (r2 = 0.99) during the measurements of blue-light response curves (Fig. 7). This demonstrates that FRRF0.75ms and MTF750ms measurements result in basically the same parameters with the exception of an offset, at least under these standard conditions. Increasing light intensities resulted in a significant decrease in the Fq′/Fm′ (Fig. 8a). In
contrast, Fr1′/Fq′ and Fr2′/Fq′ were less affected by the higher light intensities (Fig. 8b, c). Upon dark to light transition at 30 µmol photons m−2 s−1, Fr1′/Fq′ decreased from 0.18 (± 0.009) to 0.10 (± 0.023) and increased to 0.2 (± 0.01) at the last two light intensities. Fr2′/Fq′ increased from 0.81 (± 0.018) to 0.95 (± 0.035) and then was stabilized at 0.89 (± 0.02) at the higher light intensities. Fr1′/Fq′ measured in the light was not significantly different from dark-adapted values, with the exception of the initial light step at 30 µmol photons m−2 s−1. In summary, ChlF relaxation kinetics in the light were little affected by increasing light intensities and NPQ, whereas Fq′/Fm′ decreased.
Discussion
We induced ChlF transients by using different LIFT-FRR excitation protocols (FRRF0.75ms and MTF750ms) at 0.6 m distance (Fig. 1). Fv/Fm and Fq′/Fm′ were highly correlated between the two protocols (Fig. 7). Furthermore, we char- acterized a range of photo-physiological properties with an emphasis on the kinetics of electron transport from PSII towards PSI. These kinetics are determined by the well- established architecture of photosynthetic linear electron transport chain and can be observed via ChlF relaxation
Fig. 3 Boxplot of quantum efficiency of the photosystem II (Fv/Fm, a), efficiency of primary quinone acceptor (QA) reoxidation in 0.65 ms (Fr1/Fv, b), and 120 ms (Fr2/Fv, c) relaxation phases of dark- adapted attached spinach leaves are shown. Measurements took place 5 min after exposure to control or nitrogen (N2) atmosphere. Param- eters were obtained using fast repetition rate flash (FRRF0.75ms) of the light-induced fluorescence transient (LIFT) instrument. Box rep- resents inter-quartile range, bold horizontal bar the median, the dis- continuous lines the upper and lower quartile, and outlier data points (> 1.5 × inter-quartile range) are depicted by a point (n = 6 plants).
Boxes labeled with different letters differ significantly from each other according to Tukey’s multiple comparisons of means
Fig. 4 Chlorophyll fluorescence transients of isolated spinach thy- lakoids and photosystem II particles (BBY) are presented on a loga- rithmic time scale. The measurements were performed either by the light-induced fluorescence transient (LIFT) device (closed circles) or with the double-modulated FL3000 fluorometer (open triangles).
Thylakoid samples (10 µg chlorophyll/mL) were either untreated, or treated with 5 µΜ 3−(3,4-dichlorophenyl)-1,1-dimethylurea (DCMU) or 0.66 µM 2,5-dibromo-5-methyl-6-isopropyl-benzoquinone (DBMIB). Chlorophyll fluorescence signals are double normalized so that the signal starts from 0 for measured minimum fluorescence (Fo), and has a total amplitude of 1. Chemicals were added in the dark and samples were dark-adapted for 3 min before measurement. Error bars show standard deviation (n = 5, except DCMU FL3000 and DBMIB FL3000 n = 3)
reflecting the kinetics of QA− reoxidation (Vass et al. 1999).
Efficiency of QA− reoxidation was assessed in 0.65 ms and 120 ms relaxation phases after the FRR excitation, expressed
in the Fr1/Fv and Fr2/Fv parameter, respectively. These sim- ple parameters reflect the overall reoxidation of QA− dur- ing the indicated time periods. In the light, Fr2′/F reflected
Fig. 5 Comparison of photosystem II quantum efficiency (Fv/Fm, a, b) and efficiency of primary quinone acceptor (QA) reoxidation in 0.65 ms (Fr1/Fv, c, d), and 120 ms (Fr2/Fv, e, f) relaxation phases in dark-adapted state acquired by light-induced fluorescence transient (LIFT) and double-modulated FL3000 fluorometer. Measurements were carried out on isolated spinach thylakoids and BBY particles.
Thylakoid samples (10 µg chlorophyll/mL) were either untreated or treated with 5 µΜ 3−(3,4-dichlorophenyl)-1,1-dimethylurea (DCMU)
or 0.66 µM 2,5-dibromo-5-methyl-6-isopropyl-benzoquinone (DBMIB), resulting in different chlorophyll fluorescence relaxations as shown in Fig. 4. Black diamonds show mean values and error bars indicate the 95% confidence intervals. Individual data points are depicted by a grey point (n = 5, except DCMU FL3000 and DBMIB FL3000 n = 3). Means labeled with different letters differ significantly from each other according to Tukey’s multiple comparisons of means
Fig. 6 Chlorophyll fluorescence response of attached spinach leaves measured under different intensities of background irradi- ance by the light-induced fluo- rescence transient (LIFT) instru- ment. Leaves were exposed to 0 (dark-adapted), 30, 100, 300, and 700 µmol photons m−2 s−1 blue light (445 nm). Fast repeti- tion rate flash (FRRF0.75ms, a) and multiple turnover flash (MTF750ms; b) were performed on dark-adapted samples and after reaching the steady state at each light intensity (after 3 min). Chlorophyll fluores- cence transients are presented on a logarithmic time scale.
Error bars show the standard error of the mean (n = 6 plants)
electron transport capacity from QA towards PSI and was far less sensitive to increasing light intensities than F′/Fm′ (Fig. 8). The results provide additional information about electron transport, which are not reflected by the Fv/Fm parameter.
Maximum fluorescence
We demonstrated ChlF induction at 0.6 m distance by using the LIFT instrument on attached spinach leaves.
Fm−MT in the control leaves was reached at 750 ms after multiple turnover of PSII reaction centers (Fig. 2b). That Fm−MT was indeed saturated by using MTF750ms, was confirmed by using the DCMU treatment, which showed the same ChlF level. DCMU inhibits QA− reoxidation and induces Fm−MT in intact leaves (Tóth et al. 2005).
In contrast to Fm−MT, Fm−ST is reached within 40 to 60 µs within one full turnover of the PSII reaction centers (Kolber et al. 1998; Nedbal et al. 1999; Belyaeva et al.
2014). The level of Fm−ST is about 50% lower compared to Fm−MT and is based on fully reduced QA (e.g., Samson
and Bruce 1996; Schansker et al. 2014). The difference between F−MT and Fm−ST is suggested to be caused by additional ChlF quenchers that are removed during mul- tiple turnovers (Delosme 1967; Kalaji et al. 2017). In this study, the Fm−FRR induced by FRRF0.75ms saturated at about 0.25 ms at highest excitation power of 40,000 µmol photons m−2 s−1 (Fig. S1). Within this time range, the OEC is already in the second turnover and QA− is once reoxidized by QB (Ananyev and Dismukes 2005b; Pérez- Navarro et al. 2016). The reoxidation of QA− by QB and QB− has time constants of 0.2 ms and 0.7 ms, respectively (Bowes and Crofts 1980; de Wijn and van Gorkom 2001;
Tomek et al. 2001). The second time constants may vary with respect to the kinetics of H+ uptake by QB− (Petrou- leas and Crofts 2005). The saturating behavior of Fm−FRR strongly indicates that photochemical processes stabilized within the FRRF0.75ms (Fig. S1). In agreement, the derived Fv/Fm values were independent from the used excitation power. We conclude that Fm−FRR reflected fully reduced QA mainly associated with QB−.
Fig. 7 Correlation of quantum efficiency of the photosystem II in the dark-adapted state (Fv/Fm) and the light-adapted state (Fq′/Fm′) obtained by fast repetition rate flash (FRRF0.75ms) and multiple turn- over flash (MTF750ms) during a blue-light response curve of spinach leaves. Maximum fluorescence (Fm in the dark and Fm′ in the light) represents chlorophyll fluorescence yield of the averaged 300th and 301st flashlet of the FRRF0.75ms respective the yield of the 7500th flashlet in case of the MTF750ms. Variable fluorescence (Fv in the dark or Fq′ in the light) is the difference between Fm or Fm′ and the chloro- phyll fluorescence yield of the first flashlet (Fo in the dark or F′ in the light). The regression formula was y = − 0.13 + 1.31 × x. Measure- ments were performed using the light-induced fluorescence transient (LIFT) device (n = 6 plants)
Fig. 8 Quantum efficiency of the photosystem II (Fv/Fm in the dark, and Fq′/Fm′ in the light, a) and efficiency of primary quinone accep- tor (QA) reoxidation in 0.65 ms (Fr1/Fv in the dark, and Fr1′/Fq′ in the light, b,) and 120 ms (Fr2/Fv in the dark, and Fr2′/Fq′ in the light, c) relaxation phases of attached spinach leaves were measured under dif- ferent intensities of background irradiance. Parameters were acquired using fast repetition rate flash (FRRF0.75ms) of the light-induced fluo- rescence transient (LIFT) instrument. Black dots show mean val- ues and error bars indicate the 95% confident interval (n = 6 plants).
Means labeled with different letters differ significantly from each other according to Tukey’s multiple comparisons of means
Using the FRRF2.5ms protocol, Fm−FRR declined after reaching a plateau under control conditions (Fig. 2c).
This behavior was only observed when the PQ pool was oxidized and the sample was dark-adapted. Similarly, the polyphasic ChlF rise during a MTF of 15,000 µmol pho- tons m−2 s−1 records a local ChlF maximum at about 2 ms (J-step) (Schreiber 1986a; Tóth et al. 2007a; Schansker et al.
2011). This ChlF peak appears only when the sample is in the S1-state, i.e., dark-adapted (Strasser 1997). In the ChlF decline, QA reduction is overcome by QA− reoxidation via the oxidized PSII primary donor (P680+), which accumu- lates during the slow S3–S4 transition of the OEC (Schansker et al. 2011; Kalaji et al. 2017). The phase of ChlF decline matches time wise with the formation of QB2− (Bowes and Crofts 1980; de Wijn and van Gorkom 2001). After 2 ms, electron delivery of the OEC proceeds and re-reduction of QA, further accumulation of QB2− and exchange of QB2− by an oxidized PQ takes place (Petrouleas and Crofts 2005).
These processes lead to an increasing ChlF signal during a MTF, known as thermal phase (Delosme 1967; Lazár 2006).
It was shown before that PQ pool reduction leads to a higher ChlF signal by releasing non-photochemically quenched ChlF (Vernotte et al. 1979; Haldimann and Tsimilli-Michael 2005). In agreement, Fm−FRR increased without reaching saturation when the PQ pool was already reduced in the dark (Fig. 2c). Similarly, Fo under N2 atmosphere was also higher than in the control but was the same in the subsequent FRRF2.5ms (p value = 0.403, data not shown) due to reoxida- tion of PQ pool during the flash. Fo yield was shown to be dependent on PQ redox state and can be recovered by far- red light pulse (Diner 1977; Hohmann-Marriott et al. 2010;
Kalaji et al. 2017). However, this additional ChlF quench- ing is probably not directly controlled by the PQ pool (Tóth et al. 2005). It may be induced by the occupancy of the QB-pocket or by conformational changes in the PSII com- plex (Falkowski et al. 2004; Schansker et al. 2014; Magyar et al. 2018; Prášil et al. 2018). This might explain that Fm−ST (when only QA is reduced) cannot surpass the ChlF level at the J-step (Schreiber 1986a). Another reason for the lower Fm−ST compared to the J-step might be that STF induced a quenching mechanism during the reduction phase of QA. At the end of the FRRF0.75ms induction phase, when chang- ing from fast to low repetition rate flashlets, we noticed an instantaneous ChlF spike (Fig. S1). This indicates a fast- relaxing quenching mechanism. It was suggested earlier that carotenoid triplets quench ChlF within µs when operating with flashes at high excitation power (Schödel et al. 1999;
Steffen et al. 2001; Braslavsky and Holzwarth 2012; Bely- aeva et al. 2014). In summary, saturated Fm−FRR differs from Fm−ST in the reduction of QB to QB− while QA is fully re- reduced. Fm−FRR and Fm−ST are expected to be comparable since QB− is not known to quench any ChlF (Schansker et al.
2011). The saturation of Fm−FRR after 0.25 ms indicates that
QB2− was not formed. The Fm−FRR differs from the J-step in the redox state of the OEC and the accumulation of QB2− which influence ChlF (see also Osmond et al. 2017).
When reaching Fm−MT, at least one additional quencher is removed increasing ChlF signal by a still unclear mechanism (Magyar et al. 2018; Prášil et al. 2018).
Validation of electron transport kinetics
Anaerobiosis inhibits PQ pool reoxidation in the dark (Bohme et al. 1971; Cournac et al. 2000; Feilke et al. 2014).
As expected, reduced PQ pool under N2 atmosphere affected ChlF relaxation and decreased Fr1/Fv compared to control (Fig. 3b). ChlF relaxation was compared between the modu- lated LIFT-FRR and the double-modulated FL3000 device.
The two devices measured similar qualitative responses comparable to earlier studies (Deák et al. 2014). However, QA− reoxidation was faster in the first milliseconds when measuring with the double-modulated FL3000 than the LIFT device (Fig. 4). This might be due to the shorter dura- tion of the STF than FRRF0.75ms, where the latter reduced QB already. In addition, the FRR flashlets have an actinic effect, which partially reduce QA and slow down the QA− reoxida- tion kinetics. The STF of the FL3000 device with 1000 µmol photons m−2 s−1 was probably not saturating resulting in the lower Fv/Fm values compared to the values derived by the LIFT device. In summary, a wide range of impaired electron transport processes were detected using the ChlF relaxation parameters Fr1/Fv and Fr2/Fv derived either by the LIFT or the FL3000 device.
Measurements in the light and effect on electron transport kinetics
In the dark, the Fm−FRR yield was linked to PQ redox state and S-state of the OEC. The situation is different in the light because NPQ occurs and S-states are randomized. Fm−FRR′ was interpreted as equilibrium of QA reduction, NPQ and subsequent QA− reoxidation (Fig. 6a, Osmond et al. 2017).
Accordingly, Fm−MT′ in the light does not reach saturation because NPQ limits light harvesting and electron transport quenches ChlF very efficiently (Loriaux et al. 2013). The MTF750ms with rather low excitation power (1000 µmol pho- tons m−2 s−1) limited Fm−MT′ saturation additionally. How- ever, Fq′/Fm′ derived by FRRF0.75ms during the measurement of blue-light response curve correlated highly with Fq′/Fm′ derived by MTF750ms (R2 = 0.99) (Fig. 7). Correspondingly,
Fq′/Fm′ derived with a previous LIFT device using FRR
flashes was shown to be well-correlated to the values meas- ured by a PAM device (R2 = 0.89) (Pieruschka et al. 2010, 2014). Comparable results were also shown by Samson et al.
(1999) who carried out a similar experiment using STF and MTF. Dark-light transition at 30 µmol photons m−2 s−1
was clearly separated based on the transient shape and the derived Fr1′/Fq′ and Fr2′/Fq′ values (Fig. 8). The strong initial response upon illumination appears to represent transition from the dark-adapted state of inactive electron transport to a light-stimulated state of engaged electron transport, e.g., activation of RUBISCO in the first few minutes of light acclimation (Kono and Terashima 2014). In conclusion,
Fq′/Fm′ derived by FRRF0.75ms approximate Fq′/Fm′ values
derived by STF or MTF.
The Fm−ST and Fm−MT signal, along with Fv/Fm and NPQ, are the most common photosynthetic parameters used in ChlF-assisted plant phenomics (Furbank and Tester 2011).
These properties are relatively easy to measure by using existing ChlF techniques, and they are extremely sensitive to a range of photo-physiological properties of plants. At the same time, the Fm responses are rather non-specific, requiring additional information to identify the affected photosynthetic mechanisms (Kalaji et al. 2014). In addi- tion, their direct responses to irradiance levels require that these parameters are measured under well-defined light conditions (generally in the dark, with pre-defined periods of dark adaptation), limiting their applications as reporters of physiological conditions under highly variable, natural light conditions. However, the properties of the photosyn- thetic electron transport from QA towards PSI (expressed
as Fr2′/Fq′) remain well-constrained under different ambient
light intensities (Fig. 8c). The possibility for automation and measurements in the light using the LIFT method will make it possible to monitor the dynamics of photosynthetic traits under natural conditions.
Conclusion
Simultaneous measurements of Fv/Fm (respective Fq′/Fm′) and the kinetics of electron transport between PSII towards PSI expressed as Fr1,2/Fv (respective Fr1,2′/Fq′) parameter provided more detailed information about the photosynthetic apparatus detecting differences in a wide range of physi- ological conditions. Performing these measurements non- invasively with high time resolution under natural environ- mental conditions has the potential to improve the efficacy of the photosynthetic phenotyping, while contributing to the advancement of knowledge about photosynthesis and its regulation.
Acknowledgements We would like to thank Angelina Steier for LIFT instrument maintenance. Beate Uhlig, Katharina Wolter-Heinen and Christian Jungmann are acknowledged for greenhouse management and for ensuring optimal plant growth conditions.
Funding This study was performed within the German Plant Phe- notyping Network (DPPN) which is founded by the German Federal Ministry for Education and Research (BMBF). Project Identification
Number is BMBF 031A053. The work was partly supported (I.V. and A.u.R.) by the Hungarian Ministry for National Economy (Grant No.
GINOP-2.3.2-15-2016-00037).
Compliance with ethical standards
Conflict of interest The authors declare that they have no conflict of interest.
Open Access This article is distributed under the terms of the Crea- tive Commons Attribution 4.0 International License (http://creat iveco mmons .org/licen ses/by/4.0/), which permits unrestricted use, distribu- tion, and reproduction in any medium, provided you give appropriate credit to the original author(s) and the source, provide a link to the Creative Commons license, and indicate if changes were made.
References
Ananyev G, Dismukes GC (2005b) How fast can Photosystem II split water? Kinetic performance at high and low frequencies.
Photosynth Res 84:355–365. https ://doi.org/10.1007/s1112 0-004-7081-1
Ananyev G, Kolber ZS, Klimov D et al (2005a) Remote sensing of heterogeneity in photosynthetic efficiency, electron transport and dissipation of excess light in Populus deltoides stands under ambient and elevated CO2 concentrations, and in a tropical for- est canopy, using a new laser-induced fluorescence transient device. Glob Change Biol 11:1195–1206. https ://doi.org/10.111 1/j.1365-2486.2005.00988 .x
Baker NR (2008) Chlorophyll fluorescence: a probe of photosynthesis in vivo. Annu Rev Plant Biol 59:89–113. https ://doi.org/10.1146/
annur ev.arpla nt.59.03260 7.09275 9
Belyaeva NE, Schmitt FJ, Paschenko VZ et al (2014) Model based analysis of transient fluorescence yield induced by actinic laser flashes in spinach leaves and cells of green alga Chlorella pyr- enoidosa Chick. Plant Physiol Biochem 77:49–59. https ://doi.
org/10.1016/j.plaph y.2014.01.017
Berthold DA, Babcock GT, Yocum CF (1981) A highly resolved, oxy- gen-evolving photosystem II preparation from spinach thylakoid membranes: EPR and electron-transport properties. FEBS Lett 134:231–234. https ://doi.org/10.1016/0014-5793(81)80608 -4 Bohme H, Reimer S, Trebst A (1971) The effect of dibromothy-
moquinone, an antagonist of plastoquinone, on non cyclic and cyclic electron flow systems in isolated chloroplasts. Z Natur- forschung Part B-Chem Biochem Biophys Biol Verwandten Geb B 26:341–341+
Bowes JM, Crofts AR (1980) Binary oscillations in the rate of reoxida- tion of the primary acceptor of photosystem II. Biochim Biophys Acta BBA—Bioenerg 590:373–384. https ://doi.org/10.1016/0005- 2728(80)90208 -X
Braslavsky SE, Holzwarth AR (2012) Role of carotenoids in photosys- tem II (PSII) reaction centers. Int J Thermophys 33:2021–2025.
https ://doi.org/10.1007/s1076 5-012-1274-1
Butler WL (1978) Energy distribution in the photochemical apparatus of photosynthesis. Annu Rev Plant Physiol 29:345–378
Cournac L, Redding K, Ravenel J et al (2000) Electron flow between photosystem II and oxygen in chloroplasts of photosystem. J Biol Chem 275:17256–17262. https ://doi.org/10.1074/jbc.M9087 32199
de Wijn R, van Gorkom HJ (2001) Kinetics of electron transfer from QA to QB in photosystem II. Biochemistry 40:11912–11922. https ://doi.org/10.1021/bi010 852r