Contents lists available atScienceDirect
Journal of Chromatography B
journal homepage:www.elsevier.com/locate/jchromb
Comparative analysis of the human serum N-glycome in lung cancer, COPD and their comorbidity using capillary electrophoresis
Brigitta Mészáros
a, Gábor Járvás
a,b, Anna Farkas
a, Márton Szigeti
a,b, Zsuzsanna Kovács
a, Renáta Kun
a,c, Miklós Szabó
c, Eszter Csánky
c, András Guttman
a,b,⁎aHorváth Csaba Memorial Laboratory of Bioseparation Sciences, Research Center for Molecular Medicine, Doctoral School of Molecular Medicine, Faculty of Medicine, University of Debrecen, Debrecen, Hungary
bResearch Institute of Biomolecular and Chemical Engineering, University of Pannonia, Veszprem, Hungary
cDepartment of Pulmonology, Semmelweis Hospital, Miskolc, Hungary
A R T I C L E I N F O Keywords:
human serum N-linked glycan capillary electrophoresis pulmonary diseases
A B S T R A C T
Lung cancer (LC) and chronic obstructive pulmonary disease (COPD) are prevalent ailments with a great challenge to distinguish them based on symptoms only. Since they require different treatments, it is important to find non-invasive methods capable to readily diagnose them. Moreover, COPD increases the risk of lung cancer development, leading to their comorbidity. In this pilot study theN-glycosylation profile of pooled human serum samples (90 patients each) from lung cancer, COPD and comorbidity (LC with COPD) patients were investigated in comparison to healthy individuals (control) by capillary gel electrophoresis with high sensitivity laser-induced fluorescence detection. Sample preparation was optimized for human serum samples introducing a new tem- perature adjusted denaturation protocol to prevent precipitation and increased endoglycosidase digestion time to assure complete removal of theN-linked carbohydrates. The reproducibility of the optimized method was < 3.5%. Sixty-oneN-glycan structures were identified in the pooled control human serum sample and the profile was compared to pooled lung cancer, COPD and comorbidity of COPD with lung cancer patient samples.
One important finding was that no other sugar structures were detected in any of the patient groups, only quantitative differences were observed. Based on this comparative exercise, a panel of 13N-glycan structures were identified as potential glycobiomarkers to reveal significant changes (> 33% in relative peak areas) be- tween the pathological and control samples. In addition toN-glycan profile changes, alterations in the individual N-glycan subclasses, such as total fucosylation, degree of sialylation and branching may also hold important glycobiomarker values.
1. Introduction
Lung cancer (LC) is one of the predominantly diagnosed cancers (11.6% of the total cases) and was the main cause of cancer deaths (18.4% of the total cancer deaths) in 2018 in both genders combined [1]. Another prevalent lung disease is Chronic Obstructive Pulmonary Disease (COPD), mostly caused by cigarette smoking, representing a great but certainly preventable risk factor[2]. COPD has recently be- come in the spotlight due to its elevating incidence rate, morbidity, mortality and increasing the risk of developing lung cancer, in many cases creating formidable challenges for the global healthcare systems [3]. Simultaneous diagnoses of LC and COPD (i.e., comorbidity)
represent poor prognosis[2], thus treatments should be planned ac- cordingly[4]. The high mortality rate of COPD and lung cancer could be due to the asymptomatic property at their early stages, and the lack of appropriate distinguishing diagnostic tools. While biopsy can dif- ferentiate malignant (LC) and benign (inflammation) lesions that ima- ging techniques are not capable in a reliable diagnostic manner, it is an invasive process with a number of risk factors including infections, pneumonia, pneumothorax, bleeding and haemoptysis, just to list the most frequent ones[5]. Furthermore, another potential drawback of biopsy is the risk of tumor spreading, i.e., during the biopsy process, possible metastasis initiating circulating tumor cells may get away from the primary tumor[6,7]. Therefore, there is an urgent need to develop
https://doi.org/10.1016/j.jchromb.2019.121913
Received 30 August 2019; Received in revised form 13 November 2019; Accepted 29 November 2019
Abbreviations:COPD, chronic obstructive pulmonary disease; LC, lung cancer; DP, degree of polymerization; APTS, 8-aminopyrene-1,3,6-trisulfonic acid; GU, glucose unit; IgG, immunoglobulin G; IgA, immunoglobulin A; AAT, α-1-antitrypsin; HP, haptoglobin; TR, transferrin; DTT, dithiothreitol; RNase B, ribonuclease B;
RFU, relative fluorescence unit
⁎Corresponding author. Tel.: +36 88 624063.
E-mail addresses:a.guttman@northeastern.edu,guttman.andras@hlbs.org(A. Guttman).
Available online 12 December 2019
1570-0232/ © 2019 Elsevier B.V. All rights reserved.
T
non-invasive molecular diagnostic tools capable of predicting the pre- sence and prognosis of the actual disease (LC, COPD or comorbidity) with adequate specificity and sensitivity.
Ever-growing evidence shows the importance of theN-glycosylation of proteins in biological systems, demonstrating that this post-transla- tional modification is as essential as the polypeptide backbone itself, playing significant roles in forming their higher order structure, bio- chemical properties and function[8]. Suzuki et al.[9]studied the im- portance and roles ofN-glycosylation in COPD and found that the re- duction of FUT8 activity has close relation with the progression of the disease. Phillips and coworkers[10]reviewed the glycosylation aspects of lung cancer and the mechanisms of post-synthetic glycan modifica- tion during malignant transformation suggesting promising biomarkers and therapeutic possibilities based on theirN-glycosylation alterations.
The significance of these changes revealed that identifying N-glycan biomarkers as potential early detection markers and monitoring the treatment of lung diseases[2]can be of high importance. The human serum contains a plethora of proteins with the majority of them gly- cosylated[11]. Protein glycosylation is the consequence of very com- plex biochemical processes, regulated by a number of glycosidases and glycosyltransferases[9]resulting in diverse but protein specific glycan profiles, which affect several cellular properties such as signaling, ad- hesion, motility and half-life, just to mention a few important ones[12].
Genetic and environmental factors can both affect the activity of this glycosylation machinery that may lead to altered glycan structures, possibly specific for pathological changes. Comprehensive analysis of complex carbohydrates requires high sensitivity methods with en- hanced resolution because of their great structural diversity. The most frequently applied techniques for N-glycan analysis are high-perfor- mance liquid chromatography (HPLC), capillary electrophoresis (CE), mass spectrometry (MS) and NMR, or the combination of those such as LC-MS or CE-MS[13].
In several cases,N-glycosylation alterations affect the high abun- dant and acute phase proteins, including immunoglobulin G (IgG) [14,15], immunoglobulin A (IgA) [11,16,17], alpha-1-antitrypsin (AAT) [18], haptoglobin (HP) [19,20] and transferrin (TR)[21,22].
Pavić et al[15]analyzed the human plasma and its IgG subset of COPD patients and healthy controls by UPLC and provided new insights into plasma protein and IgG N-glycome changes. The plasma protein N- glycome significantly decreased in low branched type and increased in more complex glycan structures in COPD patients. Ito et al. investigated the N-glycans of a lung-specific protein, surfactant protein D, using matrix-assisted laser desorption/ionization quadrupole ion trap time-of- flight mass spectrometry and found that the fucosylation level was greatly elevated in COPD patients compared to controls[23]. Rudd and coworkers analyzed the serum of lung cancer patients and healthy controls by high performance hydrophilic interaction liquid chroma- tography (HILIC) and anion exchange chromatography [24]. They found that the level of bi- (A2), tri- (A3) and tetra-antennary (A4) glycans were significantly increased in lung cancer compared to healthy controls and a reduction was observed in the amounts of core-fucosy- lated bi-antennary structures. In addition to total human serum, one of the abundant proteins, haptoglobin was analyzed and similar altera- tions were found in both sample types. Váradi et al. also studied the human serum haptoglobin in lung diseases and emphasized the im- portance of measuring the core- to arm-fucosylation ratios[20]. The slight decrease in the total fucosylation level of haptoglobin in the serum of COPD and pneumonia patients compared to the control group was the result of a significant decrease in arm-fucosylation and a slight increase in core-fucosylation. Elevated amounts of core- (FA4G4) and antennary-fucosylated tetra-antennary glycans (A4FG4) in haptoglobin were also observed comparing lung cancer and COPD patient groups.
Ruhaak et al. investigated the N-glycans of several high abundance glycoproteins enriched by affinity capture from plasma samples of lung adenocarcinoma patients as well as healthy controls and analyzed with nano-HPLC-chip-TOF-MS to search for lung cancer biomarkers [25].
They found that, while theN-glycan profiles of blood-derived glyco- proteins could be adequate biomarkers for lung cancer, protein en- richment did not improve specificity, but made the method more complicated. Liang et al.[18]examined different types of pulmonary diseases including lung adenocarcinoma, squamous cell lung cancer, small-cell lung cancer as well as several benign ones, such as pneu- monia, pulmonary nodule and tuberculous pleuritis and suggested that theN-glycosylation patterns of α-1-antitrypsin could be a potential lung cancer biomarker.
In this paper we report on a pilot study of the N-glycosylation profiles of pooled human serum samples from patients with COPD, lung cancer and their comorbidities (COPD with LC) compared to control healthy subjects (pool of 90 patients each) using capillary electro- phoresis with laser-induced fluorescent detection (CE-LIF). A new temperature adjusted denaturation protocol was used to prevent pre- cipitation and the endoglycosidase digestion time was increased to as- sure full removal of theN-linked oligosaccharides. Sixty-oneN-glycans were identified in the pooled, control human serum samples based on data in publicly available GU databases and exoglycosidase digestion based carbohydrate sequencing. The relative peak areas of the identi- fiedN-glycans were used in a comparative quantitative evaluation to find a potential preliminary glycobiomarker panel to differentiate lung cancer, COPD and their comorbidity from each other and from the control.
2. Materials and methods 2.1. Chemicals and reagents
Water (HPLC grade), acetonitrile, sodium cyanoborohydride (1 M in THF), glycerol, ribonuclease B, immunoglobulin G, α-1-antitrypsin and DTT (dithiothreitol) were obtained from Sigma Aldrich (St. Louis, MO, USA). SDS (sodium dodecyl sulfate) and Nonidet P-40 were from VWR (Radnor, PA, USA). The Fast Glycan Labeling and Analysis Kit was from SCIEX (Brea, CA, USA) including the bracketing standards of maltose (DP2) and maltopentadecaose (DP15). The exoglycosidase enzymes of Sialidase A (Arthrobacter ureafaciens), β-Galactosidase (Jack bean) and β-N-Acetyl Hexosaminidase (Jack bean) were from ProZyme (Hayward, CA, USA). The endoglycosidase PNGase F was from Asparia Glycomics, (San Sebastian, Spain).
2.2. Sample preparation
All serum samples were collected with the appropriate Ethical Permissions (approval number: 23580-1/2015/EKU (0180/15)) and Informed Patient Consents at the Department of Pulmonology in the Semmelweis Hospital (Miskolc, Hungary). For this pilot study, the samples were pooled in order to efficiently determine all possible glycan structures in the pooled samples[26]. Serum samples from 90 healthy individuals (control), 90 lung cancer patients, 90 COPD pa- tients and 90 patients with comorbidity of COPD with lung cancer were separately pooled.
Preparation of human serum samples included denaturation, glycan release, fluorophore labeling and magnetic bead mediated cleanup.
First, 2 µL of serum samples were diluted with HPLC grade water to 10 µL. Since the Fast Glycan Sample Preparation and Analysis protocol was optimized for purified IgG samples, to avoid possible precipitation issues with the more complex serum samples, a modified denaturation protocol was used by adding 5 µL denaturation solution and applying 40 °C for 10 min followed by 70 °C for 10 min. The glycan release process was also modified and performed with the addition of 1.0 µL of PNGase F enzyme (200 mU) to the reaction mixture and incubated at 60 °C for 1 h instead of 20 min, to ensure complete removal of the serumN-glycome. The endoglycosidase digestion reaction was stopped by the addition of 120 µL of ice-cold acetonitrile to precipitate all remaining protein/polypeptide content. This was followed by
centrifugation for 5 min at 13,500 RPM (BioSan, Biocenter Ltd, Hungary). The supernatant that contained all released sugars was dried under reduced pressure at 60 °C for 1 h in a SpeedVac (Jouan RC 10.10 Vacuum Concentrator Centrifugal System, Jouan, San Fransisco, CA, USA). The dry samples were reconstituted in the labeling solution containing 4.0 µL of 40 mM 8-aminopyrene-1,3,6-trisulfonic acid (APTS) in 20% acetic acid, 2.0 µL of NaBH3CN (1 M in THF) and 4 µL 20% acetic acid. The reaction mixture was incubated in a heating block using a modified evaporative labeling protocol with closed vial cap at 50 °C for 60 min, followed with open cap at 55 °C for 80 min[27]. The labeling reagent was added in great excess to avoid competition with any possible remaining amine containing molecules. After the labeling step, the samples were purified by magnetic beads following the Fast Glycan Sample Preparation and Analysis protocol and analyzed by CE- LIF. Exoglycosidase digestions were performed by consecutive addi- tions of sialidase A to remove all α 2-3,6,8-linked sialic acids, Jack bean galactosidase to remove β1-4,6-linked galactose residues and Jack bean hexosaminidase to remove the β1-2,4,6-linked N-acetyl-glucosamines by respective overnight incubations at 37 °C as described earlier in [28].
2.3. Capillary electrophoresis
Capillary electrophoresis analyses with laser induced fluorescent detection (CE-LIF) were performed using a PA800 Plus Pharmaceutical Analysis System (SCIEX). All CE measurements were accomplished in 40 cm effective length (50 cm total length), 50 µm ID bare fused silica capillaries filled with the HR-NCHO separation gel buffer (SCIEX).
30 kV electric potential was applied during the separation steps in re- versed polarity mode (cathode at the injection side, anode at the de- tection side) at 30 °C. To increase detection sensitivity and reproduci- bility, a three-stage sample injection procedure was used: Step 1) 1.0 psi for 5.0 sec water pre-injection, Step 2) 3.0 kV for 3.0 sec sample in- jection and Step 3) 2.0 kV for 2.0 sec bracketing standard injection. This latter was used for high precision GU value determination by the GUcal software (www.GUcal.hu)[29]. Data collection and analysis were im- plemented by the 32Karat (version 10.1) software package (SCIEX).
Relative percentage area values of the separated peaks were calculated by the PeakFit v4.12 Software (SeaSolve Software Inc., San Jose, CA).
3. Results and discussion
In this pilot study, a new and improved sample preparation method was applied to accommodate the high complexity of the human serum samples including temperature adjusted denaturation, extended glycan release and evaporative labeling protocol. Capillary electrophoresis - laser induced fluorescence detection was used to analyze and compare theN-glycosylation patterns of pooled human serum samples from 90 patients each with chronic obstructive pulmonary disease (COPD), lung cancer (LC), and their comorbidity (COPD with LC) to healthy in- dividuals (as control). The inter- and intraday variability of the opti- mized method were under 3.5% for the pooled human serum samples.
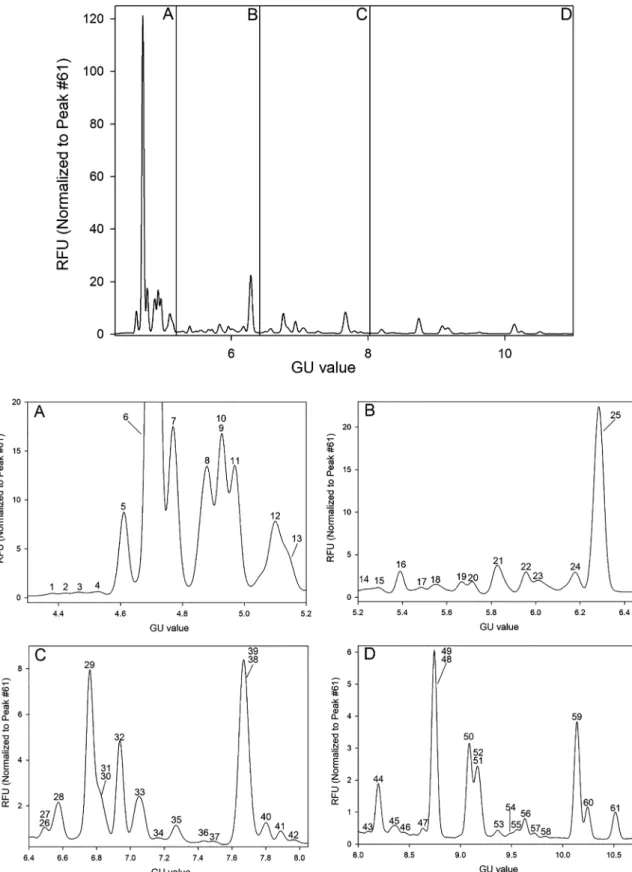
For better comparability and consequently easier structural identifica- tion, the timescale of the acquired electropherograms were converted from migration time to GU values using the GUcal software (freely available from GUcal.hu)[29]. A representative electropherogram of the pooled healthy human serum sampleN-glycome is shown inFig. 1, featuring the separation of 61 peaks. Structural elucidation of all se- paratedN-glycans utilized direct mining of GU database entries (Gly- coStore.org), exoglycosidase digestion based carbohydrate sequencing [28], comparison to oligosaccharides released from carefully chosen glycoprotein standards (ribonuclease B, immunoglobulin G, α-1-anti- trypsin), and some earlier published literature data on the same subject matter[30–32]. The exoglycosidase based glycan sequencing process is shown in Fig. 2, utilizing sialidase A, galactosidase and hex- osaminidase, depicted by the corresponding traces. Sequence
information was derived from the GU value shifts of the individual peaks as the result of the consecutive exoglycosidase treatments[33].
Table 1lists all identifiedN-glycan structures in the pooled human serum sample as numbered inFig. 1. The first level of structural elu- cidation of the separated glycans accomplished by using their GU va- lues to search the GlycoStore database (glycostore.org). Glycans de- noted by # were identified considering the results of the sequential exoglycosidase digestion process shown inFig. 2. Structure identifica- tion of entries marked with asterisks were accomplished based on a comparative exercise utilizing theN-glycan profiles of IgG (*), RNase B (**) and AAT (***)[32,34,35]. It is important to note that besides these 61 carbohydrates, no other glycan structures were detected in the pa- thological samples compared to the control.
After the identification of the separatedN-glycan structures in the pooled healthy human control serum sample, the relative peak areas of all peaks were computed and quantitatively compared to lung cancer, COPD and their comorbidity (COPD with LC) pooled sample data with their respective SD values based on the triplicate runs. Before the in- tegration step for peak area determination, all electropherograms were normalized to peak 61 (FA2BG2), i.e., the RFU values were divided by the RFU value of peak 61, because it was apparently stable in size in all runs and well-separated from the other peaks. This normalization step was necessary to adequately calculate the peak areas of some of the not completely separated peaks. After the normalization step, the relative peak area % values were calculated by dividing the integrated peak areas by the sum of all integrated areas and multiplied by 100.Table 1 lists the suggested glycan structures corresponding to the separated peaks inFig. 1, the calculated CE-LIF GU values and relative peak areas with their SDs. Only peaks with > 1% relative peak areas were taken into consideration in this comparative pilot study (highlighted bold in Table 1). All runs were done in triplicates and the average RSD of the relative peak areas was 3.46%. Please note that rows 62–78 inTable 1 represent the peaks appeared during exoglycosidase digestion after each sequential analysis step.
Changes in relative peak areas of the pooled lung cancer, COPD and comorbidity (COPD with LC) samples were compared to the pooled healthy control, based on their capillary electrophoresis analysis re- sults. As shown in Table 2, only glycans with significant alterations were taken into consideration during the evaluation process, i.e.,N- glycan structures satisfying the following two criteria: 1) the relative peak areas of theN-linked glycan structures were > 1%, at least in one sample group of healthy control, COPD, lung cancer, or their co- morbidity (bold structures inTable 1); and 2) at least one of the ob- served relative peak area differences between any of the disease groups and the control was > 33%.
As one can observe, several relative peak area values in the pooled LC sample were considerably altered compared to the control (Table 2, Column 3), such as FA4BG4[3,3,3,3]S4 (peak 5: +167% ± 7.4), FA3G3[6]S3 (peak 7: +176% ± 9.7), A2BG2S2 + M3 (peaks 9–10:
+133% ± 6.3), FA2G2S2 (peak 11: 105% ± 5.1), FA2BG2S2 (peak 12: 50% ± 2.9), A2BG2S1 (peak 28: −33% ± 1.6), FA2G2S1 (peak 29: −41% ± 2.1), FA2BG2S1 (peak 32: −41% ± 2.1), A2B (peak 35:
+36% ± 2.1) and FA2G2 (peak 59: −36% ± 1.7). These changes may have diagnostic glycobiomarker potential for lung cancer. On the other hand, one should take into consideration that the following re- lative peak areas also increased in COPD: FA4BG4[3,3,3,3]S4 (peak 5, LC:+167% ± 7.4, COPD: +106% ± 5.2), A2BG2S2 + M3 (peaks 9–10, LC:+133% ± 6.3, COPD: +58% ± 2.8) and FA2BG2S2 (peak 12, LC:+50% ± 2.9, COPD: +33% ± 1.8), therefore, they may in- dicate the presence of both lung cancer or COPD, but not the co- morbidity. In addition the increment of the relative peak area of FA3G3[6]S3 (peak 7, LC:+176% ± 9.7, COPD: +79% ± 3.8, LC with COPD: +56% ± 3.0) could represent either lung cancer or COPD or their comorbidity. Interestingly, peak 28, corresponding to the A2BG2S1 structure slightly increased (+12% ± 0.6) in comparison of COPD to control, while significantly decreased (−33% ± 1.6) in lung
Fig. 1.Capillary electrophoresis analysis of the released and APTS labeledN-glycans from pooled healthy human serum (upper panel). The lower panels show the enlarged sections of the electropherogram: A) GU 4.3–5.2; B) GU 5.2–6.4; C) GU 6.4–8.1; and D) GU 8.0–10.7. The corresponding structures, GU values and relative peak areas with their SD are listed inTable 1. Separation conditions: 40 cm effective capillary length (50 cm total length), 50 μm ID bare fused silica; 30 kV (0.17 min ramp time) separation voltage in reversed polarity mode. LIF detection (excitation: 488 nm/emission: 520 nm); separation temperature 30 °C. Injection: water pre- injection 5.0 s at 1.0 psi, followed by 3.0 kV/3.0 s sample and 2.0 kV/2.0 s bracketing standard (DP2 + DP15).
cancer compared to control, therefore could also be a glycobiomarker for lung cancer. Moreover, using Column 4 inTable 2, one can distin- guish COPD from lung cancer considering the increasing changes in FA3G3[6]S3, A2BG2S2 + M3, FA2G2S2, A2B and FA2 + M6 (54% ± 2.5, 47% ± 2.2, 79% ± 4.2, 35% ± 2.0 and 41% ± 2.1), and the decreasing values of A2BG2S1 and FA2G2S1 (41% ± 1.9 and 39% ± 2.0).
In addition, the relative peak area change of peak 29 (FA2G2S1) may discern comorbidity of COPD with lung cancer (−37% ± 1.7) from COPD (−4% ± 0.2), but not from lung cancer (−41% ± 2.1).
In all pathological samples peak 59 (FA2G2, LC: −36% ± 1.7, COPD:
−34% ± 1.6, LC with COPD: −39% ± 2.1) decreased, thus, possibly distinguish them only from the control. Please note that FA2 + M6 (peaks 38–39) and A2BG2S2 + M3 (peaks 9–10) structures were co- migrating, thus their individual alterations could not be precisesly evaluated.
Fig. 3shows the quantitative alterations among the relative peak areas within theN-glycan subclasses specified by branching, degrees of sialylation and total fucosylation, determined in the control, COPD, lung cancer and comorbidity of COPD with lung cancer patient serum samples. Variations in the size of the carbohydrate structures were evaluated based on their degree of branching, i.e., the amounts of various mono-, bi-, tri-, and tetra-antennary types. The number of Fig. 2.Exoglycosidase digestion based carbohydrate sequencing of the pooled
healthy human control serumN-glycome using sialidase ( ), galactosidase ( ), and hexosaminidase ( ) to verify the identity of the glycan structures of interest. Separations conditions were the same as inFig. 1. The corresponding structures and GU values are listed inTable 1.
Table 1
The identifiedN-glycan structures in the pooled healthy control human serum sample, their CE-LIF GU values and relative peak areas with SD. Bold entries represent peaks with > 1% relative peak areas (at least in one sample groups from the control, COPD, LC and LC with COPD). Entries from 62 to 78 depict the glycan structures of the sequencing analysis results (shown inFig. 2). Abbreviated structure names followed the nomenclature suggested in[36]. Entries were identified as follows: 1) based on their GU values using the GlycoStore database (glycostore.org); 2) considering the results of the sequential exoglycosidase digestion experiments shown in Fig. 2(denoted with #) and 3) all other glycan structures were identified based onN-glycosylation information of high abundant glycoproteins in serum: IgG (*), RNase B (**) and AAT (***).
N-glycan structure GU Relative peak area (%) N-glycan structure GU Relative peak area (%)
1 A4G4[3,3,3,6]S4# 4.4 0.0955 ± 0.003 40 M6** 7.8 0.8338 ± 0.039
2 A4G4[3,3,3,3]S4# 4.46 0.0935 ± 0.002 41 A3G3[3]S1# 7.89 0.5296 ± 0.013
3 A1G1S1# 4.51 0.1307 ± 0.006 42 FA3# 7.98 0.4379 ± 0.011
4 FA4G4[3,3,3,6]S4*** 4.57 0.1285 ± 0.004 43 A2B[6]G1 8.08 0.2962 ± 0.009
5 FA4BG4[3,3,3,3]S4# 4.62 0.6814±0.015 44 FA2B* 8.2 1.9016±0.064
6 A2G2[6]S2* 4.71 21.8425±0.953 45 A2B[3]G1* 8.35 0.6615 ± 0.026
7 FA3G3[6]S3# 4.77 0.9032±0.026 46 M7** 8.48 0.3190 ± 0.014
8 A2G2[3]S2*** 4.88 2.4776±0.098 47 M7** 8.62 0.3836 ± 0.013
9 A2BG2S2* 4.93 1.5508±0.038 48 FA2[6]G1* 8.75 6.1207±0.293
10 M3 49 M7**
11 FA2G2S2* 4.97 2.3546±0.052 50 FA2[3]G1* 9.09 2.9771±0.134
12 FA2BG2S2* 5.1 1.2156±0.026 51 FA2B[6]G1* 9.17 2.5049±0.067
13 FA3G3[3]S3*** 5.14 1.2645±0.031 52 M8**
14 A2[6]G1S1* 5.24 0.1604 ± 0.007 53 A4G4[6]S1 9.34 0.1668 ± 0.008
15 A2[3]G1[6]S1 5.3 0.1631 ± 0.005 54 A4G4[3]S1 9.48 0.1636 ± 0.004
16 FA3BG3S3# 5.39 0.5907 ± 0.026 55 FA2B[3]G1* 9.55 0.4411 ± 0.012
17 A4G4[6]S3 5.47 0.8155±0.040 56 M8** 9.64 0.5983 ± 0.023
18 A2[3]G1[3]S1* 5.56 0.2984 ± 0.012 57 M8** 9.73 0.3001 ± 0.009
19 FA2G2[6]S2*** 5.66 0.3043 ± 0.018 58 FA4*** 9.86 0.0874±0.004
20 A3G3[6]S2 5.72 1.1683±0.031 59 FA2G2* 10.14 3.5100±0.089
21 FA2[6] G1S1* 5.83 0.7706 ± 0.029 60 M9** 10.25 0.9882 ± 0.042
22 A4G4[3,3,3]S3 5.95 0.9457±0.024 61 FA2BG2* 10.52 0.8847 ± 0.035
23 FA2[3]G1S1* 6.03 0.5180 ± 0.017 62 A1G1 6.62 Sequencing
24 A3G3[3]S2 6.17 0.8196±0.030 63 A2[3]G1 8.12 Sequencing
25 A2G2[6]S1* 6.28 13.1137±0.465 64 A2G2 9.17 Sequencing
26 FA2B[6]G1S1* 6.48 0.4828 ± 0.016 65 A2BG2 10 Sequencing
27 FA2B[3]G1S1* 66 A3[6]G3 11.36 Sequencing
28 A2BG2S1* 6.58 1.3189±0.034 67 A3[3]G3 11.63 Sequencing
29 FA2G2S1* 6.76 4.1359±0.095 68 FA3G3 12.33 Sequencing
30 A2* 6.82 2.7863±0.119 69 FA3BG3 12.54 Sequencing
31 M5** 70 A4G4 13.72 Sequencing
32 FA2BG2S1* 6.94 2.2966±0.063 71 FA4G4 14.38 Sequencing
33 A4G4[6]S2 7.05 1.3916±0.049 72 FA4BG4 14.45 Sequencing
34 A4G4[3]S2 7.17 0.5179 ± 0.023 73 A1 5.86 Sequencing
35 A2B* 7.27 0.7528±0.023 74 A3 7.81 Sequencing
36 A2[6]G1 7.4 0.1440 ± 0.004 75 A4 8.94 Sequencing
37 A3G3[6]S1 7.51 0.1470 ± 0.005 76 FA3B 9.93 Sequencing
38 FA2* 7.67 9.5132±0.270 77 FA4B 11.02 Sequencing
39 M6** 78 FM3 5.09 Sequencing
terminal sialic acids was also taken into consideration in the evaluation process, focusing on the tendency of the relative peak area changes in mono-, bi-, tri- and tetra-sialylation. The relative peak areas of mono- sialylated glycans slightly increased in COPD (+5% ± 0.2), slightly decreased in comorbidity of COPD with lung cancer (−6% ± 0.2) and more substantially decreased in lung cancer (−27% ± 0.9). Moreover, the relative peak areas of bi-, tri- and tetrasialylated subclasses variably increased in COPD, lung cancer and their comorbidity (COPD with LC) in comparison to the pooled control healthy human serum and the in- crement was the highest in lung cancer (bi-sialylated: +12% ± 0.4, tri-sialylated: +42% ± 1.4, tetra-sialylated: +168% ± 5.8), medium in COPD (bi-sialylated: +7% ± 0.2, tri-sialylated: +16% ± 0.6, tetra-sialylated: +117% ± 4.1) and the smallest in their comorbidity (bi-sialylated: +6% ± 0.2, tri-sialylated: +8% ± 0.3, tetra-sialy- lated: +23% ± 0.8). The relative peak areas of fucosylatedN-glycans slightly decreased in COPD (−8% ± 0.3) and also in comorbidity of COPD with lung cancer (−4% ± 0.1) in contrast to lung cancer, where a small increase (+7% ± 0.2) was observed.
The relative peak areas of mono-, tri- and tetra-antennary glycans similarly to the bi-, tri- and tetra-sialylated subclasses increased in all three disease groups compared to the healthy control with the highest increment in lung cancer (mono-antennary: +116% ± 4.0, tri-an- tennary: +45% ± 1.6, tetra-antennary: 44.5% ± 1.5), medium in COPD (mono-antennary: +59% ± 2.0, tri-antennary: +15% ± 0.5, tetra-antennary: 31% ± 1.1) and the smallest in their comorbidity
(mono-antennary: +30% ± 1.0, tri-antennary: +7.5% ± 0.3, tetra- antennary: 3% ± 0.1). In contrary, the relative peak areas of bi-an- tennaryN-glycans hardly decreased or not changed at all in all sample types of COPD (−3% ± 0.1), lung cancer (−5% ± 0.2) and co- morbidity of COPD with lung cancer (−0.3% ± 0.0) compared to the control. However, taking a closer look at the data, these observed changes were apparently caused by the interplay between various in- creasing and decreasing amounts of bi-antennary structures, i.e., the relative peak areas of some bi-antennary glycans significantly decreased (e.g., A2BG2S1 (peak 28): LC: −33% ± 1.6, LC with COPD:
−17% ± 1.0; FA2G2S1 (peak 29): LC: −41% ± 2.1, COPD:
−4% ± 0.2, LC with COPD: −37% ± 1.7; FA2G2 (peak 59): LC:
−36% ± 1.7, COPD: −34% ± 1.6, LC with COPD: −39% ± 2.1);
while others increased (e.g., A2BG2S2 + M3) (peaks 9–10): LC:
+133% ± 6.3, COPD: +58% ± 2.8, LC with COPD: +29% ± 1.4;
FA2G2S2 (peak 11): LC: +105% ± 5.1, COPD: +15% ± 0.7, LC with COPD: +4% ± 0.2; FA2BG2S2 (peak 12): LC: +50% ± 2.9, COPD:
+33% ± 1.8, LC with COPD: +16% ± 0.7 and A2B (peak 35): LC:
+36% ± 2.1, LC with COPD: +12% ± 0.6), thus their changes were almost counterbalanced. Based on these observations, as a first ap- proximation we considered thatN-glycan subclasses of mono- tri- and tetrasialylated, fucosylated as well as mono-, tri- and tetra-antennary forms could serve as potential biomarkers for lung cancer, COPD and their comorbidity.
4. Conclusion
In this pilot study, theN-glycosylation profiles of patient samples of chronic inflammatory (COPD) and malignant (LC) pulmonary diseases as well as their comorbidity (COPD with LC) were quantitatively stu- died and compared to healthy controls to get a better insight about the glycan structures/ratios, which can be expected in each pool. A novel temperature adjusted denaturation protocol as well as extended enzy- matic release and evaporative derivatization time was used for the as- paragine linked oligosaccharides from the complex serum samples, which were then analyzed by capillary electrophoresis with high sen- sitivity laser induced fluorescence detection. Sixty-oneN-glycan struc- tures were identified in the control human serum samples and since no other glycans appeared in any of the three disease categories, these 61 structures were quantitatively monitored in this study. Our results suggested that certain serum N-glycans could be used as potential markers for the different types of pulmonary diseases. Therefore, the panel of the 13 glycans listed inTable 2could be considered to dif- ferentiate lung cancer, COPD and their comorbidity from the control as well as LC from COPD. In addition, alterations in theN-glycan sub- classes, such as fucosylated, mono-, bi-, tri- and tetra-sialylo, as well as mono-, bi-, tri- and tetra-antennary glycans could also carry interesting diagnostic information. The glycan panel in Table 2 and the corre- sponding subclasses may provide even more reliable information as they represent the sum of multiple structural changes caused by a given Table 2
Comparison of the relative peak areas of lung cancer (LC), COPD, their comorbidity (COPD with LC) to the control sample and between LC and COPD along with their SD, where at least one observed difference was > 33% (bold numbers) for any peak with > 1% relative area between the disease and control samples.
Peak Number N-Glycan structure LC to Control % COPD to Control % LC + COPD to Control % LC to COPD %
5 FA4BG4[3,3,3,3]S4 167 ± 7.4 106 ± 5.2 18 ± 0.9 29 ± 1.4
7 FA3G3[6]S3 176 ± 9.7 79 ± 3.8 56 ± 3.0 54 ± 2.5
9–10 A2BG2S2, M3 133 ± 6.3 58 ± 2.8 29 ± 1.4 47 ± 2.2
11 FA2G2S2 105 ± 5.1 15 ± 0.7 4 ± 0.2 79 ± 4.2
12 FA2BG2S2 50 ± 2.9 33 ± 1.8 16 ± 0.7 13 ± 0.9
28 A2BG2S1 −33 ± 1.6 12 ± 0.6 −17 ± 1.0 −41 ± 1.9
29 FA2G2S1 −41 ± 2.1 −4 ± 0.2 −37 ± 1.7 −39 ± 2.0
32 FA2BG2S1 −41 ± 2.1 −30 ± 1.5 −26 ± 1.3 −17 ± 0.8
35 A2B 36 ± 2.1 0 ± 0 12 ± 0.6 35 ± 2.0
38–39 FA2, M6 15 ± 0.9 −18 ± 0.9 28 ± 1.6 41 ± 2.1
59 FA2G2 −36 ± 1.7 −34 ± 1.6 −39 ± 2.1 −3 ± 0.1
Fig. 3.Alterations among the relative peak areas of specificN-glycan subclasses (Sialoforms: mono-, bi-, tri- and tetra-sialo; Fucosylated and Branching: mono-, bi- tri- and tetra-antennary) of lung cancer (black), COPD (gray) and their co- morbidity (dark gray) with their corresponding RSDs. The results were calcu- lated based on the data in supplementaryTable 1.
disease. This is especially applicable for the highly branched sialylated structures as our recent genotyping data suggested significant increase of MGAT5 activity, i.e., increased branching in lung cancer[37]. Cur- rently we are in the process of collecting 300 samples from each disease groups that will be individually analyzed in view of our preliminary pooled sample based results.
CRediT authorship contribution statement
Brigitta Meszaros:Investigation, Writing - original draft, Writing - review & editing.Gabor Jarvas:Software, Visualization, Supervision, Writing - review & editing.Anna Farkas:Validation, Writing - review &
editing. Marton Szigeti: Methodology, Writing - review & editing.
Zsuzsanna Kovacs: Formal analysis, Writing - review & editing.
Renata Kun: Data curation. Miklos Szabo: Data curation. Eszter Csanky:Data curation, Supervision, Writing - review & editing.Andras Guttman:Supervision, Conceptualization, Writing - review & editing.
Acknowledgement
The authors gratefully acknowledge the support of the National Research, Development and Innovation Office (NKFIH) (K 116263) grants of the Hungarian Government. This work was also supported by the BIONANO_GINOP-2.3.2-15-2016-00017 project, the V4-Korea Joint Research Program, project National Research, Development and Innovation Office (NKFIH) (NN 127062) grants of the Hungarian Government and the Human Capacities Grant Management Office, the ÚNKP-18-3-I-DE-393 New National Excellence Program Hungarian Ministry of Human Capacities and the János Bolyai Research Scholarship of the Hungarian Academy of Sciences. The generous support of SCIEX and Dr Elliott Jones are also greatly appreciated. This is contribution #152 from the Horvath Csaba Memorial Laboratory of Bioseparation Sciences.
Appendix A. Supplementary material
Supplementary data to this article can be found online athttps://
doi.org/10.1016/j.jchromb.2019.121913.
References
[1] F. Bray, J. Ferlay, I. Soerjomataram, R.L. Siegel, L.A. Torre, A. Jemal, Global cancer statistics 2018: GLOBOCAN estimates of incidence and mortality worldwide for 36 cancers in 185 countries, CA Cancer J. Clin. 68 (2018) 394–424.
[2] A.L. Durham, I.M. Adcock, The relationship between COPD and lung cancer, Lung Cancer 90 (2015) 121–127.
[3] J.L. López-Campos, W. Tan, J.B. Soriano, Global burden of COPD, Respirology 21 (2016) 14–23.
[4] D. Spyratos, E. Papadaki, S. Lampaki, T. Kontakiotis, Chronic obstructive pul- monary disease in patients with lung cancer: prevalence, impact and management challenges, Lung Cancer (Auckl) 8 (2017) 101–107.
[5] Y. Wang, F. Jiang, X. Tan, P. Tian, CT-guided percutaneous transthoracic needle biopsy for paramediastinal and nonparamediastinal lung lesions: diagnostic yield and complications in 1484 patients, Medicine 95 (2016) e4460.
[6] K. Shyamala, H.C. Girish, S. Murgod, Risk of tumor cell seeding through biopsy and aspiration cytology, J. Int. Soc. Prev. Community Dent. 4 (2014) 5–11.
[7] Y. Xi, J. Fan, D. Che, K. Zhai, T. Ren, X. Feng, L. Shang, J. Hu, Y. Yu, Q. Meng, Distant metastasis and survival outcomes after computed tomography-guided needle biopsy in resected stage I-III non-small cell lung cancer, J. Cancer 8 (2017) 3356–3361.
[8] O. Gornik, T. Pavic, G. Lauc, Alternative glycosylation modulates function of IgG and other proteins - implications on evolution and disease, Biochim. Biophys. Acta 2012 (1820) 1318–1326.
[9] T. Suzuki, K. Ohtsubo, N. Taniguchi, Sugar chains: decoding the functions of gly- cans, 2015.
[10] H. Lemjabbar-Alaoui, A. McKinney, Y.-W. Yang, V.M. Tran, J.J. Phillips, Chapter Nine - Glycosylation alterations in lung and brain cancer, in: R.R. Drake, L.E. Ball (Eds.), Advances in Cancer Research, Academic Press, 2015, pp. 305–344.
[11] F. Clerc, K.R. Reiding, B.C. Jansen, G.S. Kammeijer, A. Bondt, M. Wuhrer, Human plasma protein N-glycosylation, Glycoconj. J. 33 (2016) 309–343.
[12] A. Varki, R.D. Cummings, J.D. Esko, P. Stanley, G.W. Hart, M. Aebi, A.G. Darvill, T.
Kinoshita, H.P. Packer, J.H. Prestegard, R.L. Schnaar, P.H. Seeberger, Essentials of Glycobiology, Cold Spring Harbor Laboratory Press, DOI (2015–2017).
[13] R.R. Townsend, A.T. Hotchkiss, Techniques in Glycobiology, Marcel Dekker Inc., New York, NY, 1997.
[14] R. Saldova, L. Royle, C.M. Radcliffe, U.M. Abd Hamid, R. Evans, J.N. Arnold, R.E. Banks, R. Hutson, D.J. Harvey, R. Antrobus, S.M. Petrescu, R.A. Dwek, P.M. Rudd, Ovarian cancer is associated with changes in glycosylation in both acute-phase proteins and IgG, Glycobiology 17 (2007) 1344–1356.
[15] T. Pavic, D. Dilber, D. Kifer, N. Selak, T. Keser, D. Ljubicic, A. Vukic Dugac, G. Lauc, L. Rumora, O. Gornik, N-glycosylation patterns of plasma proteins and im- munoglobulin G in chronic obstructive pulmonary disease, J. Transl. Med. 16 (2018) 323.
[16] A. Bondt, S. Nicolardi, B.C. Jansen, K. Stavenhagen, D. Blank, G.S. Kammeijer, R.P. Kozak, D.L. Fernandes, P.J. Hensbergen, J.M. Hazes, Y.E. van der Burgt, R.J. Dolhain, M. Wuhrer, Longitudinal monitoring of immunoglobulin A glycosy- lation during pregnancy by simultaneous MALDI-FTICR-MS analysis of N- and O- glycopeptides, Sci. Rep. 6 (2016) 27955.
[17] A. Bondt, S. Nicolardi, B.C. Jansen, T.M. Kuijper, J.M.W. Hazes, Y.E.M. van der Burgt, M. Wuhrer, R.J.E.M. Dolhain, IgA N- and O-glycosylation profiling reveals no association with the pregnancy-related improvement in rheumatoid arthritis, Arthritis Res. Therapy 19 (2017) 160.
[18] Y. Liang, T. Ma, A. Thakur, H. Yu, L. Gao, P. Shi, X. Li, H. Ren, L. Jia, S. Zhang, Z. Li, M. Chen, Differentially expressed glycosylated patterns of alpha-1-antitrypsin as serum biomarkers for the diagnosis of lung cancer, Glycobiology 25 (2015) 331–340.
[19] T. Fujimura, Y. Shinohara, B. Tissot, P.C. Pang, M. Kurogochi, S. Saito, Y. Arai, M. Sadilek, K. Murayama, A. Dell, S. Nishimura, S.I. Hakomori, Glycosylation status of haptoglobin in sera of patients with prostate cancer vs. benign prostate disease or normal subjects, Int. J. Cancer 122 (2008) 39–49.
[20] C. Varadi, S. Mittermayr, A. Szekrenyes, J. Kadas, L. Takacs, I. Kurucz, A. Guttman, Analysis of haptoglobin N-glycome alterations in inflammatory and malignant lung diseases by capillary electrophoresis, Electrophoresis 34 (2013) 2287–2294.
[21] O. Choi, N. Tomiya, J.H. Kim, J.M. Slavicek, M.J. Betenbaugh, Y.C. Lee, N-glycan structures of human transferrin produced by Lymantria dispar (gypsy moth) cells using the LdMNPV expression system, Glycobiology 13 (2003) 539–548.
[22] A. Quaranta, A. Sroka-Bartnicka, E. Tengstrand, G. Thorsén, N-Glycan profile analysis of transferrin using a microfluidic compact disc and MALDI-MS, Anal.
Bioanal. Chem. 408 (2016) 4765–4776.
[23] E. Ito, R. Oka, T. Ishii, H. Korekane, A. Kurimoto, Y. Kizuka, S. Kitazume, S. Ariki, M. Takahashi, Y. Kuroki, K. Kida, N. Taniguchi, Fucosylated surfactant protein-D is a biomarker candidate for the development of chronic obstructive pulmonary dis- ease, J. Proteomics 127 (2015) 386–394.
[24] J.N. Arnold, R. Saldova, M.C. Galligan, T.B. Murphy, Y. Mimura-Kimura, J.E. Telford, A.K. Godwin, P.M. Rudd, Novel glycan biomarkers for the detection of lung cancer, J. Proteome Res. 10 (2011) 1755–1764.
[25] L.R. Ruhaak, U.T. Nguyen, C. Stroble, S.L. Taylor, A. Taguchi, S.M. Hanash, C.B. Lebrilla, K. Kim, S. Miyamoto, Enrichment strategies in glycomics-based lung cancer biomarker development, Proteomics Clin. Appl. 7 (2013) 664–676.
[26] E.F. Schisterman, A. Vexler, To pool or not to pool, from whether to when: appli- cations of pooling to biospecimens subject to a limit of detection, Paediatr. Perinat.
Epidemiol. 22 (2008) 486–496.
[27] B. Reider, M. Szigeti, A. Guttman, Evaporative fluorophore labeling of carbohy- drates via reductive animation, Talanta 185 (2018) 365–369.
[28] A. Guttman, K.W. Ulfelder, Exoglycosidase matrix-mediated sequencing of a com- plex glycan pool by capillary electrophoresis, J. Chromatogr. A 781 (1997) 547–554.
[29] G. Jarvas, M. Szigeti, A. Guttman, GUcal: an integrated application for capillary electrophoresis based glycan analysis, Electrophoresis 36 (2015) 3094–3096.
[30] R. Saldova, A. Asadi Shehni, V.D. Haakensen, I. Steinfeld, M. Hilliard, I. Kifer, A. Helland, Z. Yakhini, A.L. Borresen-Dale, P.M. Rudd, Association of N-glycosy- lation with breast carcinoma and systemic features using high-resolution quanti- tative UPLC, J. Proteome Res. 13 (2014) 2314–2327.
[31] L. Royle, M.P. Campbell, C.M. Radcliffe, D.M. White, D.J. Harvey, J.L. Abrahams, Y.-G. Kim, G.W. Henry, N.A. Shadick, M.E. Weinblatt, D.M. Lee, P.M. Rudd, R.A. Dwek, HPLC-based analysis of serum N-glycans on a 96-well plate platform with dedicated database software, Anal. Biochem. 376 (2008) 1–12.
[32] K.J. Lee, S.M. Lee, J.Y. Gil, O. Kwon, J.Y. Kim, S.J. Park, H.S. Chung, D.B. Oh, N- glycan analysis of human alpha1-antitrypsin produced in Chinese hamster ovary cells, Glycoconj. J. 30 (2013) 537–547.
[33] M. Szigeti, A. Guttman, Automated N-glycosylation sequencing of biopharmaceu- ticals by capillary electrophoresis, Sci. Rep. 7 (2017) 11663.
[34] A. Guttman, S. Herrick, Effect of the quantity and linkage position of mannose (alpha 1,2) residues in capillary gel electrophoresis of high-mannose-type oligo- saccharides, Anal. Biochem. 235 (1996) 236–239.
[35] S. Mittermayr, J. Bones, A. Guttman, Unraveling the glyco-puzzle: glycan structure identification by capillary electrophoresis, Anal. Chem. 85 (2013) 4228–4238.
[36] D.J. Harvey, A.H. Merry, L. Royle, M.P. Campbell, P.M. Rudd, Symbol nomen- clature for representing glycan structures: extension to cover different carbohydrate types, Proteomics 11 (2011) 4291–4295.
[37] Z. Elek, Z. Kovács, G. Keszler, M. Szabo, E. Csanky, J. Luo, A. Guttman, Z. Rónai, High throughput multiplex SNP-analysis in chronic obstructive pulmonary disease and lung cancer, Curr. Mol. Med. 19 (2019) In Press.