cancers
Article
Circulating miRNA Increases the Diagnostic Accuracy of Chromogranin A in Metastatic Pancreatic
Neuroendocrine Tumors
Annamária Kövesdi1, Petra Anna Kurucz2, Gábor Nyír ˝o3, OttóDarvasi4, Attila Patócs2,4,5,* and Henriett Butz2,4,5
1 2nd Department of Internal Medicine, Semmelweis University, 1088 Budapest, Hungary;
ancsa.kovesdi@gmail.com
2 Department of Laboratory Medicine, Semmelweis University, 1089 Budapest, Hungary;
kurucz.petra1997@gmail.com (P.A.K.); butz.henriett@med.semmelweis-univ.hu (H.B.)
3 Molecular Medicine Research Group, Hungarian Academy of Sciences and Semmelweis University, 1088 Budapest, Hungary; nyirogabor1@gmail.com
4 Hereditary Tumours Research Group, Hungarian Academy of Sciences and Semmelweis University, 1089 Budapest, Hungary; otto.darvasi@gmail.com
5 Department of Molecular Genetics, National Institute of Oncology, 1122 Budapest, Hungary
* Correspondence: patocs.attila@med.semmelweis-univ.hu
Received: 8 July 2020; Accepted: 27 August 2020; Published: 2 September 2020
Simple Summary: Despite its varying sensitivity and decreased specificity, chromogranin A (CgA) is the most widely used biomarker for neuroendocrine tumors. The most common factor affecting its diagnostic accuracy is the use of proton pump inhibitors (PPIs). Our aim was to investigate circulating miRNA expression profiles in pancreatic neuroendocrine tumors (pNET) and pheochromocytomas/paragangliomas (PPGL) to find miRNAs which could be used as biomarkers along with CgA in these patients. MiRNA expression profiles were determined with next generation sequencing and validated by quantitative real time PCR in 74 samples obtained from patients and healthy volunteers treated with PPI. We observed a global downregulation of miRNAs in NET compared to controls. A set of miRNAs in combination with CgA resulted in the best discrimination of pNET irrespective of PPI treatment and a combination of miRNAs increased the diagnostic utility of CgA even in pNET patients with low CgA.
Abstract:Chromogranin A (CgA) is the most widely accepted biomarker for neuroendocrine tumors (NET) but its diagnostic accuracy is dependent on tumor type and the use of proton-pump inhibitors (PPI). We investigated the diagnostic value of circulating miRNAs along with CgA in pancreatic neuroendocrine tumors (pNET). 74 serum samples from patients with pNET (n=25, nonfunctioning), pheochromocytoma/paraganglioma (PPGL,n=20), healthy individuals with normal CgA (n=29) including 10 samples from 5 healthy individuals with and without current PPI treatment were collected. MiRNA expression profiles were determined using next-generation sequencing, followed by validation with individual TaqMan assays. A global downregulation of miRNAs was observed in patients with NET compared to controls. MiRNA expression of 33 miRNAs was able to discriminate tumor samples from controls. No miRNA alone could be considered as an applicable biomarker for pNET or PPGL. However, using a logistic model, the combination of a set of miRNAs increased the discriminatory role of CgA irrespective of PPI treatment. In pNET patients with normal CgA level our regression model yielded high (89.4%) diagnostic accuracy (AUC: 0.904, sensitivity: 66.6%, specificity: 96.5%). A set of miRNAs increased the diagnostic utility of CgA in pNET even in patients with low CgA.
Cancers2020,12, 2488; doi:10.3390/cancers12092488 www.mdpi.com/journal/cancers
Cancers2020,12, 2488 2 of 20
Keywords:circulating miRNA; biomarker; neuroendocrine tumor; pheochromocytoma; pancreas; pNET
1. Introduction
Chromogranins are polypeptide prohormones being the major constituents of dense-core secretory granules in neuroendocrine cells and they are co-secreted with peptide hormones and amines [1].
Neuroendocrine tumors (NETs) originate from neuroendocrine cells distributed widely throughout the body [2]. They are rare neoplasms but their incidence and prevalence are steadily rising [3].
Pancreatic NET (pNET) is the most common neuroendocrine tumor that can either be functioning or nonfunctioning according to hormone production [2]. Nonfunctioning (NF) pNETs comprising the largest group of pNETs being asymptomatic result in delayed diagnosis and often present as metastatic at diagnosis that significantly affect prognosis and survival [2,4].
An elevated level of circulating CgA has been associated with almost all tumor types of the neuroendocrine system [1,5], but its sensitivity varies between 47–100% depending on tumor type (100%, in gastrinomas, ~89% in pheochromocytomas, and ~69% in nonfunctioning pNETs) [1,6–8].
In addition, many oncological and non-oncological conditions, including renal failure, non-endocrine tumors (e.g., prostate, breast, thymus, uterus, colon), chronic gastritis, and current proton pump inhibitor therapy (PPIs) decrease the specificity CgA [6,9], but CgA is the only routinely measured circulating marker in pNET. Previous studies, including one from our research group, showed that both short- and long-term applications of PPIs and other acid-suppressive medications result in a significant increase of CgA in blood, thus decreasing its clinical utility in the management of NETs [10,11].
Neuron-specific enolase (NSE) is a cytosolic enzyme of neurons and neuroendocrine cells, that is predominantly expressed in small-cell lung cancer and poorly differentiated NETs [12,13].
Its diagnostic value, particularly its specificity for neuroendocrine tumors is rather poor [8,14,15].
5-Hydroxyindoleacitic acid (5-HIAA), as the main metabolite of serotonin, is a useful biomarker of NETs in patients with carcinoid syndrome [12]. Other biomarkers, such as insulin, glucagon, or gastrin are specific for subtypes of neuroendocrine cells [12].
Pheochromocytomas/paragangliomas (PPGLs) are rare neuroendocrine tumors of chromaffin cell origin. These are found in the adrenal medulla (pheochromocytomas, PCC) and the paravertebral ganglia of the nervous system (paragangliomas, PGL) [16]. They can produce catecholamines, but PGLs located above the diaphragm are often non-secretory [16]. In PPGL, as CgA is co-secreted with catecholamines, besides the determination of catecholamines and their metabolites, elevated CgA may indicate tumor mass and malignancy; therefore, it may be used to monitor clinical response and tumor relapse especially when the measurement of plasma metanephrines is not accessible [16].
Similarly to gene expression, miRNA expression is also cell type-specific and due to their presence in circulation and their stability, they are considered as promising biomarker candidates in several tumor types [17,18]. Their previously described expression alterations in pNET and PPGL raise their potential usefulness as circulating biomarkers [19,20]. A multianalyte biomarker (NETest) encompassing 51 different NET-related transcripts showed a significantly more sensitive and efficient method in NET diagnosis compared to single biomarkers [21], however, its availability and costs may limit its usefulness [12].
We aimed to investigate the serum miRNA expression profile in patients with pNET to identify potentially useful miRNA biomarkers. PPGL and healthy individuals with and without PPI treatment were also studied to challenge the diagnostic utility of identified miRNAs along with CgA.
Cancers2020,12, 2488 3 of 20
2. Results
2.1. Evaluation of Cell Contamination Based on miRNA Signature
As intracellular miRNA concentration is much higher compared to those measured in a cell-free environment, cellular contamination is an important factor to avoid. Therefore, first, we assessed whether cellular contamination in our serum samples was present. In the collected samples visually, no sign of hemolysis could be seen. The ratio of red blood cell-enriched miR-451a to the reference miR-23a-3p was revealed as the most sensitive method for the detection of hemolysis compared to hemoglobin measurement techniques (Coulter® AcT diff Analyzer and spectrophotometric method) [22]. Assessing miR-451a to miR-23a-3p ratio no red blood cell (RBC) contamination was detected in any of our samples.MiRNAs which are considered indicating red-blood-cell or platelet cellular contamination [23–25] also showed low variance (0.4 for miR-142-3p and 0.3 for miR451a/miR-23a-3p, respectively). Only samples without cellular contamination were included.
2.2. Analysis of Circulating miRNAs by Next-Generation Sequencing
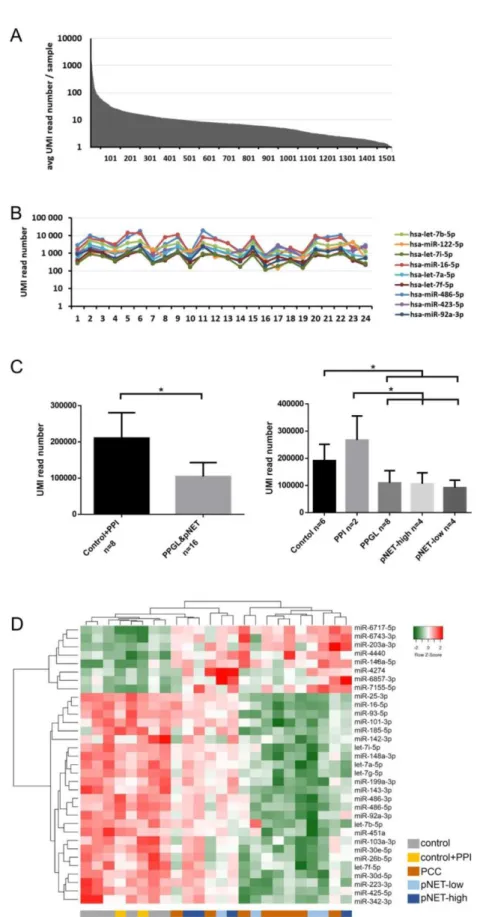
Our exploratory study included 24 samples: 8 pNET (4 patients with low- and 4 with high-CgA), 8 PPGL patients and 8 control samples from 6 healthy individuals (2 of them were also treated with PPI, samples before and after PPI treatment were both included). Altogether, 1525 miRNA were detected in NGS profiling of whole serum samples. While nine miRNAs were the most abundant with an
>500 UMI reads/sample representing 0.05% of all detected miRNAs, the great majority of miRNAs (1461 of 1525, 95%) were in the low-expression range (below 50 UMI reads/sample) (Figure1A,B). Total (global) miRNA expression in patients with pNET or PPGL was significantly decreased compared to normal controls (Figure1C).
Low abundance (<50 UMI read number) miRNAs were excluded from further analysis because these miRNAs could not be validated in our experimental set up [26]. 33 miRNAs differentiated pNET/PPGL patients from normal controls irrespective of PPI treatment (Table1, Figure1D). In pNET 19 and 7 under- and over-expressed miRNA, while in PPGL 25 and 6 under- and over-expressed miRNAs compared to healthy controls were found (Table1). However, PNET and PPGL patients could not be differentiated by serum miRNA expression (Figure1D). Additionally, we did not find significant differences in healthy controls before and after PPI treatment.
Expression of 19 miRNAs showed a significant correlation with serum CgA levels among which hsa-let-7g-5p showed the strongest association (R=−0.73;p=0.03077).
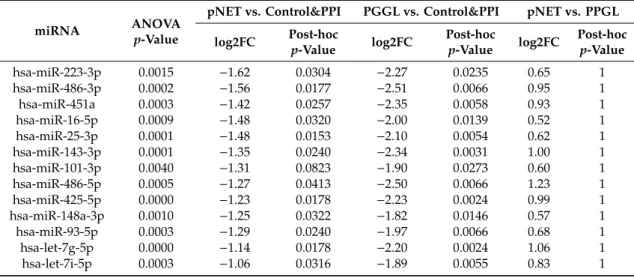
Table 1.33 miRNAs differentially expressed among controls with or without PPI treatment vs. PPGL vs. pNET groups. (“control&PPI” group includes all healthy controls with and without PPI treatment:
“tumor-free” healthy individuals irrespective of the usage of PPI).
miRNA ANOVA
p-Value
pNET vs. Control&PPI PGGL vs. Control&PPI pNET vs. PPGL log2FC Post-hoc
p-Value log2FC Post-hoc
p-Value log2FC Post-hoc p-Value
hsa-miR-223-3p 0.0015 −1.62 0.0304 −2.27 0.0235 0.65 1
hsa-miR-486-3p 0.0002 −1.56 0.0177 −2.51 0.0066 0.95 1
hsa-miR-451a 0.0003 −1.42 0.0257 −2.35 0.0058 0.93 1
hsa-miR-16-5p 0.0009 −1.48 0.0320 −2.00 0.0139 0.52 1
hsa-miR-25-3p 0.0001 −1.48 0.0153 −2.10 0.0054 0.62 1
hsa-miR-143-3p 0.0001 −1.35 0.0240 −2.34 0.0031 1.00 1
hsa-miR-101-3p 0.0040 −1.31 0.0823 −1.90 0.0273 0.60 1
hsa-miR-486-5p 0.0005 −1.27 0.0413 −2.50 0.0066 1.23 1
hsa-miR-425-5p 0.0000 −1.23 0.0178 −2.23 0.0024 0.99 1
hsa-miR-148a-3p 0.0010 −1.25 0.0322 −1.82 0.0146 0.57 1
hsa-miR-93-5p 0.0003 −1.29 0.0240 −1.97 0.0066 0.68 1
hsa-let-7g-5p 0.0000 −1.14 0.0178 −2.20 0.0024 1.06 1
hsa-let-7i-5p 0.0003 −1.06 0.0316 −1.89 0.0055 0.83 1
Cancers2020,12, 2488 4 of 20
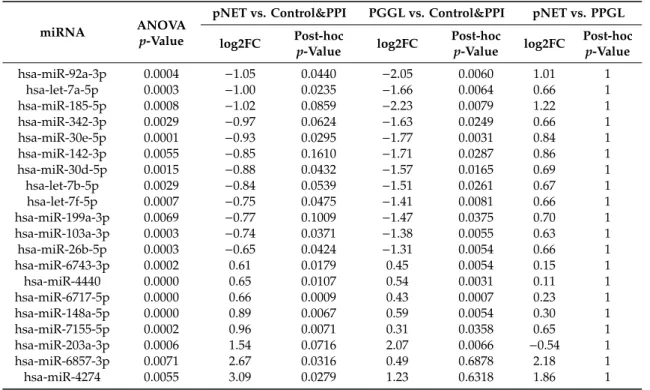
Table 1.Cont.
miRNA ANOVA
p-Value
pNET vs. Control&PPI PGGL vs. Control&PPI pNET vs. PPGL log2FC Post-hoc
p-Value log2FC Post-hoc
p-Value log2FC Post-hoc p-Value
hsa-miR-92a-3p 0.0004 −1.05 0.0440 −2.05 0.0060 1.01 1
hsa-let-7a-5p 0.0003 −1.00 0.0235 −1.66 0.0064 0.66 1
hsa-miR-185-5p 0.0008 −1.02 0.0859 −2.23 0.0079 1.22 1
hsa-miR-342-3p 0.0029 −0.97 0.0624 −1.63 0.0249 0.66 1
hsa-miR-30e-5p 0.0001 −0.93 0.0295 −1.77 0.0031 0.84 1
hsa-miR-142-3p 0.0055 −0.85 0.1610 −1.71 0.0287 0.86 1
hsa-miR-30d-5p 0.0015 −0.88 0.0432 −1.57 0.0165 0.69 1
hsa-let-7b-5p 0.0029 −0.84 0.0539 −1.51 0.0261 0.67 1
hsa-let-7f-5p 0.0007 −0.75 0.0475 −1.41 0.0081 0.66 1
hsa-miR-199a-3p 0.0069 −0.77 0.1009 −1.47 0.0375 0.70 1
hsa-miR-103a-3p 0.0003 −0.74 0.0371 −1.38 0.0055 0.63 1
hsa-miR-26b-5p 0.0003 −0.65 0.0424 −1.31 0.0054 0.66 1
hsa-miR-6743-3p 0.0002 0.61 0.0179 0.45 0.0054 0.15 1
hsa-miR-4440 0.0000 0.65 0.0107 0.54 0.0031 0.11 1
hsa-miR-6717-5p 0.0000 0.66 0.0009 0.43 0.0007 0.23 1
hsa-miR-148a-5p 0.0000 0.89 0.0067 0.59 0.0054 0.30 1
hsa-miR-7155-5p 0.0002 0.96 0.0071 0.31 0.0358 0.65 1
hsa-miR-203a-3p 0.0006 1.54 0.0716 2.07 0.0066 −0.54 1
hsa-miR-6857-3p 0.0071 2.67 0.0316 0.49 0.6878 2.18 1
hsa-miR-4274 0.0055 3.09 0.0279 1.23 0.6318 1.86 1
PPGL: pheochromocytoma-paraganglioma; PPI: proton pump inhibitor treatment; pNET: pancreatic neuroendocrine tumor, log2FC: log2fold change (counts); post-hocp-value: p-value following Tukey post-hoc test adjusted by Benjamini–Hochberg method for multiple testing correction.
2.3. miRNA Validation
Of the 33 significantly differently expressed miRNAs between controls and tumor sera samples we selected 6 underexpressed miRNAs (let-7b-5p, let-7i-5p; miR-143-3p; miR-30d-5p; miR-451a;
miR-486-5p) in pNET/PPGL samples compared to controls) based on miRNA abundance for further investigation. Additionally, we also validated the most overexpressed miR-203a-3p despite its relatively lower abundance (avg. UMI read number in pNET/PPGL samples: 68 vs. avg. UMI read number in controls: 19). The selected miRNAs were measured on an extended sample cohort consisting of 25 pNET and 20 PPGL patients (together with those included in the exploratory cohort), and 29 control samples (5 with PPI treatment, 24 without PPI treatment; including samples from our exploratory cohort).
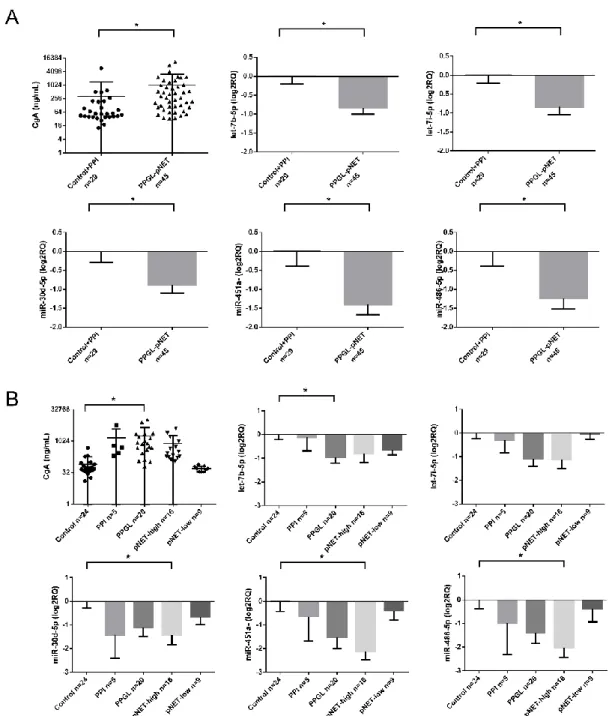
All the 6 underexpressed miRNAs were confirmed by RT-qPCR as well (Figure2A). After dissecting tumor groups, the underexpression of miR-30d-5p, miR-451a, and miR-486-5p was significant in pNET patients with high CgA levels and let-7b-5p in PPGL cases compared to healthy controls without PPI treatment (Figure2B).
The overexpression of miR-203a-3p was not confirmed by RT-qPCR in any of the samples but one pNET patient with extremely high CgA (2490.8 ng/mL).
2.4. Association of miRNA Expression with Clinicopathological Parameters
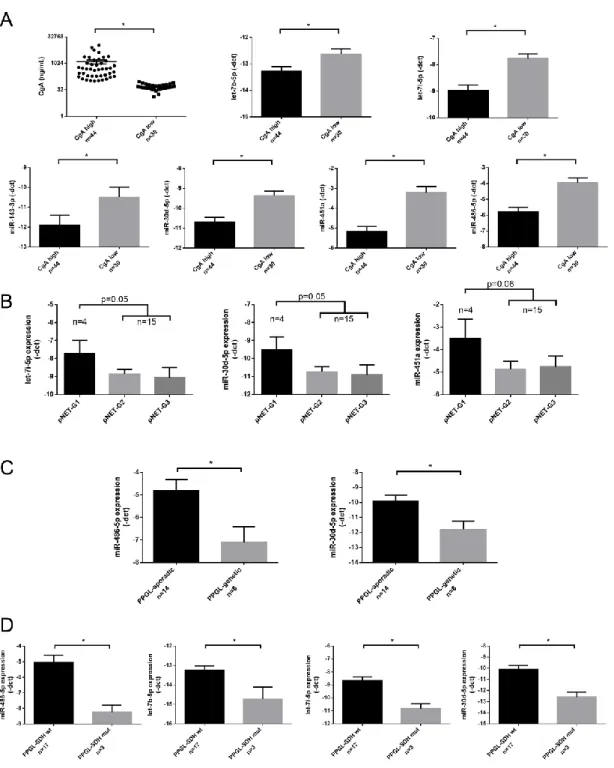
We could not find a difference in miRNA expression profiles of pNET/PPGL samples compared to healthy controls treated with PPI. However, let-7b-5p, let-7i-5p; miR-143-3p; miR-30d-5p; miR-451a and miR-486-5p showed lower expression in samples with high (>100 ng/mL) CgA levels compared to samples with normal CgA level (≤100 ng/mL) (Figure 3A). The expression of all 6 miRNAs showed a negative correlation with serum CgA level when all samples were included in the analysis.
While investigating correlation in different patient groups the negative correlation between miRNAs and CgA remained significant only in the healthy control group but not in pNET or PPGL group (Table2).
Cancers2020,12, 2488 5 of 20
Cancers 2020, 12, x 5 of 21
Figure 1. MiRNA expression in the exploratory study. (A) MiRNA abundance in serum. (B) Expression of the 9 most abundant miRNAs. (C) Global miRNA expression level among normal controls and pNET/PCC samples. Error bars indicate mean ± SE. * represents p-value < 0.05. (D) 33 differentially expressed miRNAs among different groups can discriminate against control and pNET/PCC samples. Green indicates lower, red indicates higher expression.
Figure 1.MiRNA expression in the exploratory study. (A) MiRNA abundance in serum. (B) Expression of the 9 most abundant miRNAs. (C) Global miRNA expression level among normal controls and pNET/PCC samples. Error bars indicate mean±SE. * representsp-value<0.05. (D) 33 differentially expressed miRNAs among different groups can discriminate against control and pNET/PCC samples.
Green indicates lower, red indicates higher expression.
Cancers2020,12, 2488 6 of 20
Cancers 2020, 12, x 6 of 21
Figure 2. (A,B) CgA levels and miRNA expression among controls and pNET/PPGL samples. Error bars indicate mean ± SE. * represents p-value < 0.05.
2.4. Association of miRNA Expression with Clinicopathological Parameters
We could not find a difference in miRNA expression profiles of pNET/PPGL samples compared to healthy controls treated with PPI. However, let-7b-5p, let-7i-5p; miR-143-3p; miR-30d-5p; miR-451a and miR-486-5p showed lower expression in samples with high (>100 ng/mL) CgA levels compared to samples with normal CgA level (≤100 ng/mL) (Figure 3A). The expression of all 6 miRNAs showed a negative correlation with serum CgA level when all samples were included in the analysis. While investigating correlation in different patient groups the negative correlation between miRNAs and CgA remained significant only in the healthy control group but not in pNET or PPGL group (Table 2).
Figure 2.(A,B) CgA levels and miRNA expression among controls and pNET/PPGL samples. Error bars indicate mean±SE. * representsp-value<0.05.
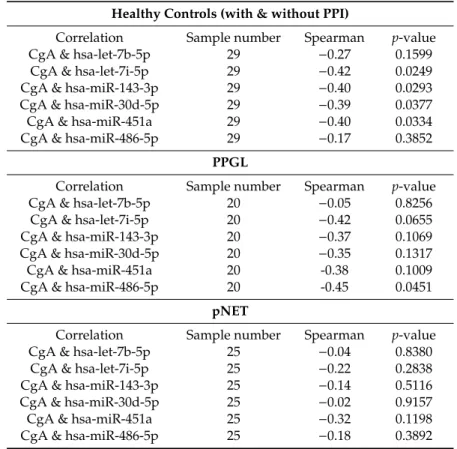
Table 2.CgA correlation with miRNA expression in the validation set (CgA vs. –dct).
All Samples
Correlation Sample Number Spearman p-value
CgA & hsa-let-7b-5p 74 −0.29 0.0125
CgA & hsa-let-7i-5p 74 −0.46 0.0000
CgA & hsa-miR-143-3p 74 −0.34 0.0029
CgA & hsa-miR-30d-5p 74 −0.39 0.0007
CgA & hsa-miR-451a 74 −0.50 0.0000
CgA & hsa-miR-486-5p 74 −0.39 0.0006
Cancers2020,12, 2488 7 of 20
Table 2.Cont.
Healthy Controls (with & without PPI)
Correlation Sample number Spearman p-value
CgA & hsa-let-7b-5p 29 −0.27 0.1599
CgA & hsa-let-7i-5p 29 −0.42 0.0249
CgA & hsa-miR-143-3p 29 −0.40 0.0293
CgA & hsa-miR-30d-5p 29 −0.39 0.0377
CgA & hsa-miR-451a 29 −0.40 0.0334
CgA & hsa-miR-486-5p 29 −0.17 0.3852
PPGL
Correlation Sample number Spearman p-value
CgA & hsa-let-7b-5p 20 −0.05 0.8256
CgA & hsa-let-7i-5p 20 −0.42 0.0655
CgA & hsa-miR-143-3p 20 −0.37 0.1069
CgA & hsa-miR-30d-5p 20 −0.35 0.1317
CgA & hsa-miR-451a 20 -0.38 0.1009
CgA & hsa-miR-486-5p 20 -0.45 0.0451
pNET
Correlation Sample number Spearman p-value
CgA & hsa-let-7b-5p 25 −0.04 0.8380
CgA & hsa-let-7i-5p 25 −0.22 0.2838
CgA & hsa-miR-143-3p 25 −0.14 0.5116
CgA & hsa-miR-30d-5p 25 −0.02 0.9157
CgA & hsa-miR-451a 25 −0.32 0.1198
CgA & hsa-miR-486-5p 25 −0.18 0.3892
Investigating miRNAs in relation to the tumor grade, in pNET patients a tendency of inverse correlation between miRNAs: let-7i-5p, miR-30d-5p, and miR-451a and grade was observed (Figure3B).
In samples obtained from PPGL patients only miR-486-5p showed an inverse correlation with CgA (Table2). As different miRNA signatures have been described in malignant vs. benign [27] and sporadic vs. hereditary PPGL [28] we aimed to investigate serum miRNAs in correlation to these clinicopathological parameters. We found that in serum samples obtained from PPGL patients with germline mutations (SDHB,RET,VHL,orNF1) miR-486-5p and miR-30d-5p were downregulated compared to sporadic patients (Figure3C). In patients withSDHBgermline mutation beside the underexpression of miR-30d-5p and miR-486-5p, let-7b-5p and let-7i-5p also showed downregulation compared to serum samples of patients withSDHBwild type (Figure3D).
2.5. Diagnostic Value of the Circulating miRNAs in PPGL/pNET
In the discrimination of healthy controls from pNET and PPGL patients, we performed receiver-operating characteristic (ROC) analysis for CgA and individual miRNAs. Binary logistic regression models were generated for combinations of miRNAs and combinations of CgA with miRNAs.
Altogether 6 miRNAs (let-7b-5p, let-7i-5p, miR-143-3p, miR-30d-5p, miR-451a, and miR-486-5p) were assessed individually and in combinations (Table3). In the pNET group compared to CgA the use of individual let-7b-5p, miR-30d-5p, miR-451a, and miR-486-5p in ROC analysis resulted in better discrimination (Table3). Additionally, the regression model of the combination of CgA with a panel of 4 (let-7b-5p, let-7i-5p, hsa-miR-143-3p, miR-30d-5p) miRNAs resulted in the best discrimination with 72.2% accuracy (AUC: 0.751; 75.8% sensitivity; 68% specificity) (Table3).
Cancers2020,12, 2488 8 of 20
Cancers 2020, 12, x 8 of 21
Figure 3. Individual qPCR validation of miRNAs in CgA high vs. CgA low samples (A), among pNET samples with different grade (B), in sporadic vs. genetically predisposed PPGL (C), and in SDHB mutation associated vs. non-associated PPGL (D). Error bars indicate mean ± SE. * represents p-value
< 0.05.
2.5. Diagnostic Value of the Circulating miRNAs in PPGL/pNET
In the discrimination of healthy controls from pNET and PPGL patients, we performed receiver- operating characteristic (ROC) analysis for CgA and individual miRNAs. Binary logistic regression models were generated for combinations of miRNAs and combinations of CgA with miRNAs.
Altogether 6 miRNAs (let-7b-5p, let-7i-5p, miR-143-3p, miR-30d-5p, miR-451a, and miR-486-5p) were assessed individually and in combinations (Table 3). In the pNET group compared to CgA the use of individual let-7b-5p, miR-30d-5p, miR-451a, and miR-486-5p in ROC analysis resulted in better
Figure 3.Individual qPCR validation of miRNAs in CgA high vs. CgA low samples (A), among pNET samples with different grade (B), in sporadic vs. genetically predisposed PPGL (C), and inSDHB mutation associated vs. non-associated PPGL (D). Error bars indicate mean± SE. * represents p-value<0.05.
Cancers2020,12, 2488 9 of 20
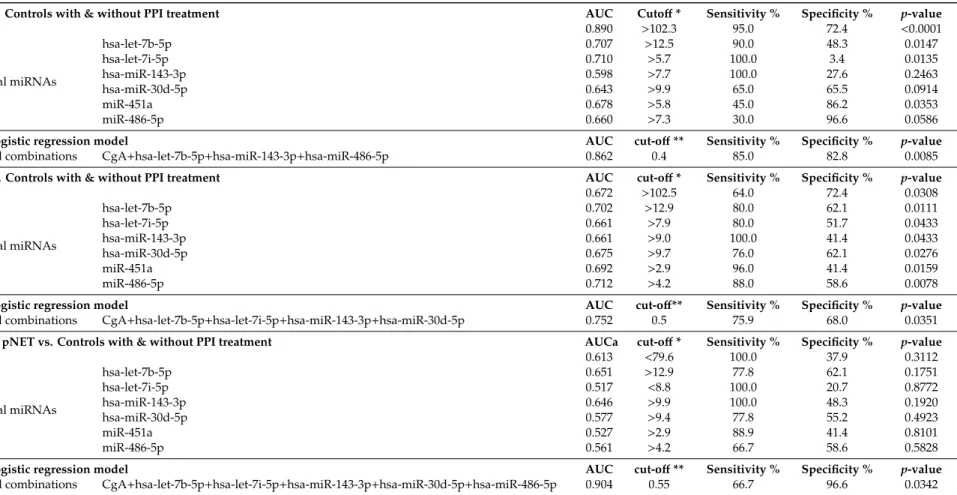
Table 3.Diagnostic performance of CgA, individual miRNAs, and the best combination of CgA with miRNAs between different groups. *: Cut offvalues of CgA in ng/mL and of miRNAs in dCt; **: Cut-offin binary logistic regression model. AUC: area under curve.
PPGL vs. Controls with & without PPI treatment AUC Cutoff* Sensitivity % Specificity % p-value
CgA 0.890 >102.3 95.0 72.4 <0.0001
Individual miRNAs
hsa-let-7b-5p 0.707 >12.5 90.0 48.3 0.0147
hsa-let-7i-5p 0.710 >5.7 100.0 3.4 0.0135
hsa-miR-143-3p 0.598 >7.7 100.0 27.6 0.2463
hsa-miR-30d-5p 0.643 >9.9 65.0 65.5 0.0914
miR-451a 0.678 >5.8 45.0 86.2 0.0353
miR-486-5p 0.660 >7.3 30.0 96.6 0.0586
Binary logistic regression model AUC cut-off** Sensitivity % Specificity % p-value
Best of all combinations CgA+hsa-let-7b-5p+hsa-miR-143-3p+hsa-miR-486-5p 0.862 0.4 85.0 82.8 0.0085
pNET vs. Controls with & without PPI treatment AUC cut-off* Sensitivity % Specificity % p-value
CgA 0.672 >102.5 64.0 72.4 0.0308
Individual miRNAs
hsa-let-7b-5p 0.702 >12.9 80.0 62.1 0.0111
hsa-let-7i-5p 0.661 >7.9 80.0 51.7 0.0433
hsa-miR-143-3p 0.661 >9.0 100.0 41.4 0.0433
hsa-miR-30d-5p 0.675 >9.7 76.0 62.1 0.0276
miR-451a 0.692 >2.9 96.0 41.4 0.0159
miR-486-5p 0.712 >4.2 88.0 58.6 0.0078
Binary logistic regression model AUC cut-off** Sensitivity % Specificity % p-value
Best of all combinations CgA+hsa-let-7b-5p+hsa-let-7i-5p+hsa-miR-143-3p+hsa-miR-30d-5p 0.752 0.5 75.9 68.0 0.0351 CgA low pNET vs. Controls with & without PPI treatment AUCa cut-off* Sensitivity % Specificity % p-value
CgA 0.613 <79.6 100.0 37.9 0.3112
Individual miRNAs
hsa-let-7b-5p 0.651 >12.9 77.8 62.1 0.1751
hsa-let-7i-5p 0.517 <8.8 100.0 20.7 0.8772
hsa-miR-143-3p 0.646 >9.9 100.0 48.3 0.1920
hsa-miR-30d-5p 0.577 >9.4 77.8 55.2 0.4923
miR-451a 0.527 >2.9 88.9 41.4 0.8101
miR-486-5p 0.561 >4.2 66.7 58.6 0.5828
Binary logistic regression model AUC cut-off** Sensitivity % Specificity % p-value
Best of all combinations CgA+hsa-let-7b-5p+hsa-let-7i-5p+hsa-miR-143-3p+hsa-miR-30d-5p+hsa-miR-486-5p 0.904 0.55 66.7 96.6 0.0342
Cancers2020,12, 2488 10 of 20
Clinically, the most challenging pNET patients are those with normal serum CgA levels (<100 ng/mL). Therefore, miRNA expression profiles are of particular interest in these patients.
The use of the individual expression of let-7b-5p or miR-143-3p yielded better discrimination from healthy controls compared to CgA alone (Table3). However, the combination of CgA value with an expression of 4 miRNAs in a logistic regression model showed the best discrimination between pNET-low CgA group compared to healthy controls including normal or elevated CgA with the accuracy of 89.4% (AUC: 0.904, sensitivity: 66.6%, specificity: 96.5%) (Table3).
In our sample set all PPGL patients had elevated CgA level, and in line with this CgA, had the highest discriminatory value with 81.6% accuracy (AUC: 0.889; 75% sensitivity, 86% specificity;
p=0.0007). Using binary logistic regression model the combination of CgA with 3 miRNAs (let-7b-5p, miR-143-3p and miR-486-5p) yielded higher specificity compared to CgA alone with 83.6% accuracy in discrimination of normal samples from PPGL samples, however, with lower sensitivity (AUC: 0.862;
85% sensitivity; 82.7% specificity) (Table3).
2.6. Analysis of Deregulated pNET/PPGL Tissue miRNAs in Serum Samples
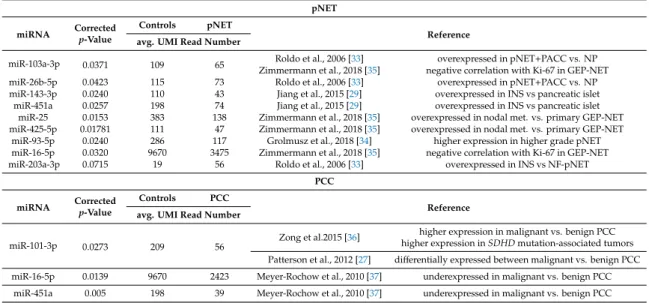
To investigate the potential origin of miRNAs in serum, we collected the data of 12 studies reporting tissue miRNA expression profiles in pNET [29–35] and PPGL [27,28,36–38]. By cross-referencing differentially expressed miRNAs from those studies with our current findings 9 miRNAs in pNET and 3 miRNAs in PPGL were found commonly dysregulated in both tissue and serum. (Table4).
Among these, only miR-203a-3p was overexpressed both in pNET tissue and serum. All other miRNAs were upregulated in tumor tissues and downregulated in serum samples. In PPGL, while miR-101-3p showed higher expression in malignant vs. benign PPGLs, in serum, it was downregulated compared to controls. However, miR-16-5p and miR-451a as putative tumor suppressor miRNAs were downregulated in both tissue and serum (Table4).
Table 4. Comparison of differentially expressed miRNAs in pNET/PCC tumor tissues vs. serum.
miRNAs common in both tissues and sera samples are indicated in the table.
pNET miRNA Corrected
p-Value
Controls pNET
Reference avg. UMI Read Number
miR-103a-3p 0.0371 109 65 Roldo et al., 2006 [33] overexpressed in pNET+PACC vs. NP
Zimmermann et al., 2018 [35] negative correlation with Ki-67 in GEP-NET
miR-26b-5p 0.0423 115 73 Roldo et al., 2006 [33] overexpressed in pNET+PACC vs. NP
miR-143-3p 0.0240 110 43 Jiang et al., 2015 [29] overexpressed in INS vs pancreatic islet
miR-451a 0.0257 198 74 Jiang et al., 2015 [29] overexpressed in INS vs pancreatic islet
miR-25 0.0153 383 138 Zimmermann et al., 2018 [35] overexpressed in nodal met. vs. primary GEP-NET miR-425-5p 0.01781 111 47 Zimmermann et al., 2018 [35] overexpressed in nodal met. vs. primary GEP-NET
miR-93-5p 0.0240 286 117 Grolmusz et al., 2018 [34] higher expression in higher grade pNET miR-16-5p 0.0320 9670 3475 Zimmermann et al., 2018 [35] negative correlation with Ki-67 in GEP-NET
miR-203a-3p 0.0715 19 56 Roldo et al., 2006 [33] overexpressed in INS vs NF-pNET
PCC miRNA Corrected
p-Value
Controls PCC
Reference avg. UMI Read Number
miR-101-3p 0.0273 209 56 Zong et al.2015 [36] higher expression in malignant vs. benign PCC higher expression inSDHDmutation-associated tumors Patterson et al., 2012 [27] differentially expressed between malignant vs. benign PCC miR-16-5p 0.0139 9670 2423 Meyer-Rochow et al., 2010 [37] underexpressed in malignant vs. benign PCC
miR-451a 0.005 198 39 Meyer-Rochow et al., 2010 [37] underexpressed in malignant vs. benign PCC
3. Discussion
Tumors of the neuroendocrine system are rare entities but represent serious diagnostic and therapeutical challenges. Especially, when they are hormonally inactive, the diagnosis is usually delayed due to a lack of specific circulating biomarkers. The delayed diagnosis influences prognosis and survival [2]. Therefore, novel circulating biomarkers are needed. To our best knowledge, no study on the diagnostic accuracy of circulating miRNAs in neuroendocrine tumors in relation to serum CgA has been published.
Cancers2020,12, 2488 11 of 20
Our data revealed a low global miRNA expression (abundance) in sera of patients with pNET/PPGL compared to normal controls. The same phenomenon was also observed in blood samples obtained from patients with pituitary adenoma [26]. Interestingly, in tumor tissues, a general downregulation of miRNAs compared to normal tissues was also detected suggesting their general tumor-suppressive role instead of being oncogenes [39]. Based on the individual miRNA measurements, Mitchell et al., 2008 [17] reported that the presence of tumors does not lead to a generalized increase in circulating miRNAs. However, specific individual tumor-derived miRNAs can show increased expression in circulation. With the technical advancement of NGS, total miRNA abundance can be determined easier and more accurately than earlier used platforms (i.e., microarray) allowed.
Still, both the causes and the role of the decreased global miRNA expression in circulation related to endocrine tumors are waiting to be further explored.
The origin of circulating miRNAs is still not clearly defined [40]. The high-abundance cell-free circulating miRNAs derive primarily from blood and endothelial cells, and tumor-derived miRNAs are possibly among the moderate or low abundance range which highlights the importance of the accurate detection of moderate-low abundance miRNAs [17,24,40]. The overexpressed miRNAs can originate directly from tumor tissues [17]. By cross-referencing these with the tissue miRNA expression we identified 3 miRNAs commonly dysregulated in both tissue and circulation. MiR-203a-3p was overexpressed both in pNET tissue and serum. Similarly, to our findings, in breast cancer, the same miR-203a-3p was overexpressed both on a tissue level and in exosomes secreted by tumor cells [41,42].
Functionally, it exhibits oncogenic effects in colon and breast cancer, and through MYC and it influences taxane sensitivity [41,43,44]. These data raise the possibility that miR-203a-3p may potentially be originated from tumor cells and can be considered as an oncomiR. However, its low abundance in the sera of patients with NET limits its wide clinical applicability as a tumor marker. Among downregulated miRNAs, miR-16-5p and miR-451a were both downregulated in PPGL tissues and sera indicating their roles as potential tumor suppressors that are well-established in other cancers [45,46].
Based on the expression pattern of 33 miRNAs we were able to separate pNET/PPGL patients from normal controls even on PPI treatment. Based on serum miRNA expression we could not distinguish samples of pNET from those of PPGL patients. This may reflect the common enterochromaffin cell type origin of these tumors [47].
Based on NGS data, several miRNAs showed (mostly inverse) correlation with serum CgA level. However, after validation on an extended sample set, this correlation remained significant only in healthy individuals but not in pNET or PGGL patients (except for miR-486-5p in PPGL patients). This may be due to the loss of the great majority of miRNAs showing correlation with CgA during tumorigenesis (as the global expression of miRNAs decreased in patients compared to healthy individuals) or due to technical issues. NGS allows us to detect any miRNA with low or very low copies but RT-qPCR has a detection limit, in our experimental settings miRNAs with reads<50 UMI could not be validated with RT-qPCR.
Increased CgA level upon PPI treatment decreases the clinical utility of CgA in neuroendocrine tumors. Performing ROC analysis, we found that in pNET samples CgA alone was less effective in discrimination of pNET sera from healthy controls. The addition of miRNAs to CgA increased the diagnostic value of CgA. Importantly, in patients with pNET with normal CgA level where CgA alone was not informative, the combination of CgA with a miRNA panel could reach high diagnostic value (AUC: 0.904).
In pNET patients, the grade, determined by the Ki-67 proliferation index, has an important impact on prognosis [48]. Although the low sample number represents a limitation of our study, the expression of miR-451a, let-7i-5p, and miR-30d-5p showed a tendency of an inverse correlation with a grade in pNET patients. Circulating miR-451a was reported underexpressed in several tumor types and it was described as an immune-regulatory miRNA [45,49–51] that may explain its dysregulation according to tumor grade in pNET. Let-7i-5p is a well-known tumor suppressor miRNA which expression is negatively correlated with prognosis [52]. In several studies, it was underexpressed in
Cancers2020,12, 2488 12 of 20
sera of cancer patients vs. healthy controls [52] but the explanation behind its decreasing expression and its role in pNET patients with higher-grade remains to be clarified. MiR-30d-5p was also reported downregulated in tumor (hepatocellular carcinoma) cells and secreted exosomes and its high expression in hepatocellular carcinoma exhibited improved overall survival [53]. These data suggest that miR-30d-5p, measured both in tissue and in liquid biopsy samples, may indeed have a role in relation to tumor grade, progression, and survival.
Previously, in pNET, only one study investigated circulating miRNA levels compared to healthy controls [30]. The authors found a very similar miRNA expression profile compared to healthy volunteers [30]. Only miR-193b was described to be more abundant in the serum of patients and it was also more abundant in pNET tissue compared to islet cells. However, by analyzing both tissue and serum samples of 6 patients, there was a much lower correlation between expression levels in serum and tissue compared to the mean correlation coefficient within the same tissue [30].
In another study, 5 miRNAs were identified differentially expressed in the sera of pancreatic ductal adenocarcinoma patients compared to pNET but no comparison between pNET and healthy controls was performed [54]. None of these 5 miRNAs showed overlap with our results comparing pNET vs. controls. In a very recent publication, 6 upregulated and 11 downregulated miRNAs were identified in plasma exosome fraction of pNET patients (no functionality reported) compared to chronic pancreatitis [55]. Again, none of the identified miRNAs was identical to those in our study although they had different starting material, different measurement methods, and most importantly, they compared their data to chronic pancreatitis.
The decrease of miR-486-5p and miR-30d-5p was detected in patients with genetically determined PGGLs (mutation in eitherSDHB,RET,VHL, orNF1genes) compared to sporadic cases. Let-7b-5p, let-7i-5p, miR-30d-5p, and miR-486-5p were downregulated inSDHBmutant cases compared to SDHBwild type cases indicating that the etiology of PPGL may influence the circulating miRNA pool.
This observation needs further studies because no data about serum and tissue miRNA differences between sporadic and genetic PPGL cases were found. Four studies investigated circulating miRNAs in PPGLs [27,36,56,57]. No significant difference was demonstrated between benign and malignant cases but elevated levels of miR-96-5p; miR-182-5p and miR-21-3p in PPGL patients compared to healthy controls were reported [27,36,56]. We could not confirm these results probably due to differences in experimental design (mirVana™PARIS™Kit vs. miRNeasy Serum Kit for isolation; TaqMan assays vs.
QIAseq™miRNA Library Kit and droplet digital PCR vs. next-generation sequencing).
As a summary, we assessed for the first time the diagnostic accuracy of circulating miRNAs in relation to CgA in patients with pNET. Using the miRNA profile, we were able to discriminate pNET/PPGL samples from healthy controls, and a global downregulation of circulating miRNA pool was observed in patients with neuroendocrine tumors compared to healthy individuals. Similarly, to CgA, miRNA signature alone was not applicable as a biomarker for PPGL/pNET if PPI treatment is administered. However, the combination of a set of miRNAs together with CgA, even in the most challenging group (pNET patients with low CgA level or receiving PPI treatment) represents a promising diagnostic tool.
4. Materials and Methods
4.1. Patients and Controls
Altogether, 74 consecutive serum samples sent for CgA measurement to the Department of Laboratory Medicine, Semmelweis University were collected (Table5) between 1 November 2017 and 24 July 2019. Samples were obtained from patients with pancreas nonfunctioning neuroendocrine tumor (pNET,n =25), with pheochromocytoma-paraganglioma (PPGL,n=20) and from healthy individuals (n=29 samples from 24 unrelated cases). PPGL and healthy individuals treated with PPI were included as controls because in clinical practice elevated CgA levels most often can be found in these cases.
Cancers2020,12, 2488 13 of 20
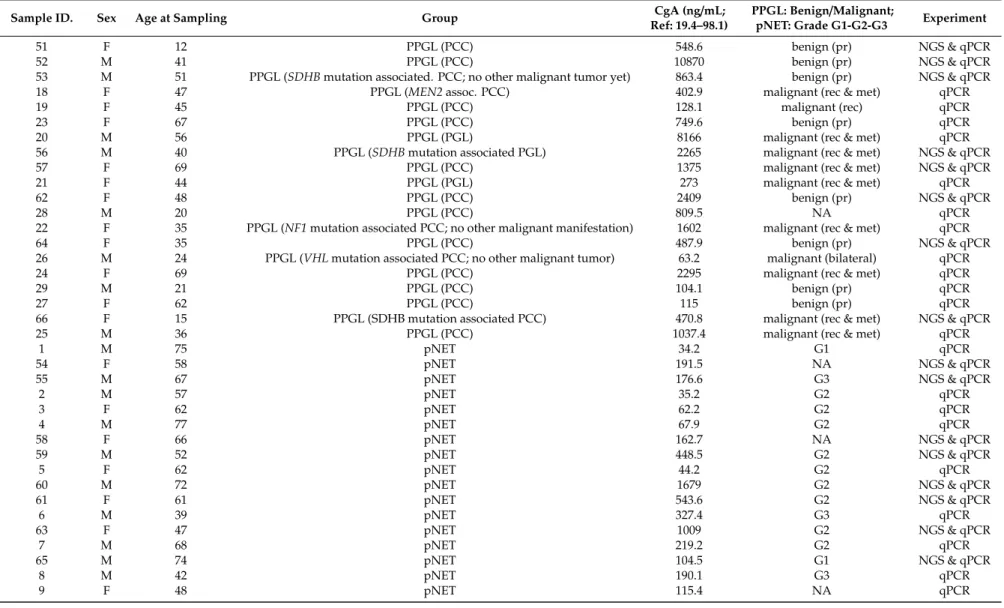
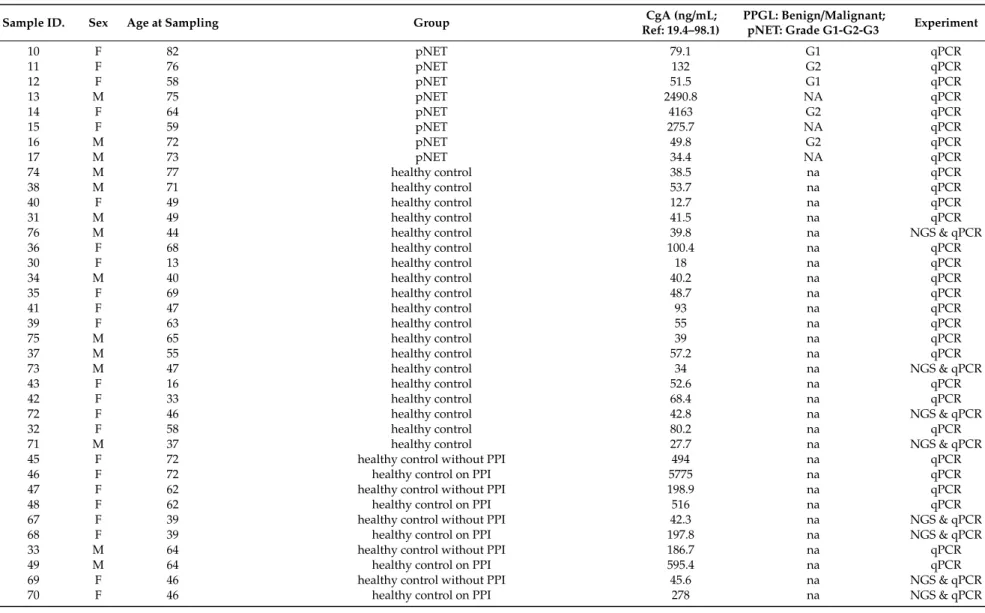
Table 5.Patient characteristics. The following paired samples are from the same healthy control with and without PPI treatment: 45+46; 47+48; 67+68; 33+49;
69+70.
Sample ID. Sex Age at Sampling Group CgA (ng/mL;
Ref: 19.4–98.1)
PPGL: Benign/Malignant;
pNET: Grade G1-G2-G3 Experiment
51 F 12 PPGL (PCC) 548.6 benign (pr) NGS & qPCR
52 M 41 PPGL (PCC) 10870 benign (pr) NGS & qPCR
53 M 51 PPGL (SDHBmutation associated. PCC; no other malignant tumor yet) 863.4 benign (pr) NGS & qPCR
18 F 47 PPGL (MEN2assoc. PCC) 402.9 malignant (rec & met) qPCR
19 F 45 PPGL (PCC) 128.1 malignant (rec) qPCR
23 F 67 PPGL (PCC) 749.6 benign (pr) qPCR
20 M 56 PPGL (PGL) 8166 malignant (rec & met) qPCR
56 M 40 PPGL (SDHBmutation associated PGL) 2265 malignant (rec & met) NGS & qPCR
57 F 69 PPGL (PCC) 1375 malignant (rec & met) NGS & qPCR
21 F 44 PPGL (PGL) 273 malignant (rec & met) qPCR
62 F 48 PPGL (PCC) 2409 benign (pr) NGS & qPCR
28 M 20 PPGL (PCC) 809.5 NA qPCR
22 F 35 PPGL (NF1mutation associated PCC; no other malignant manifestation) 1602 malignant (rec & met) qPCR
64 F 35 PPGL (PCC) 487.9 benign (pr) NGS & qPCR
26 M 24 PPGL (VHLmutation associated PCC; no other malignant tumor) 63.2 malignant (bilateral) qPCR
24 F 69 PPGL (PCC) 2295 malignant (rec & met) qPCR
29 M 21 PPGL (PCC) 104.1 benign (pr) qPCR
27 F 62 PPGL (PCC) 115 benign (pr) qPCR
66 F 15 PPGL (SDHB mutation associated PCC) 470.8 malignant (rec & met) NGS & qPCR
25 M 36 PPGL (PCC) 1037.4 malignant (rec & met) qPCR
1 M 75 pNET 34.2 G1 qPCR
54 F 58 pNET 191.5 NA NGS & qPCR
55 M 67 pNET 176.6 G3 NGS & qPCR
2 M 57 pNET 35.2 G2 qPCR
3 F 62 pNET 62.2 G2 qPCR
4 M 77 pNET 67.9 G2 qPCR
58 F 66 pNET 162.7 NA NGS & qPCR
59 M 52 pNET 448.5 G2 NGS & qPCR
5 F 62 pNET 44.2 G2 qPCR
60 M 72 pNET 1679 G2 NGS & qPCR
61 F 61 pNET 543.6 G2 NGS & qPCR
6 M 39 pNET 327.4 G3 qPCR
63 F 47 pNET 1009 G2 NGS & qPCR
7 M 68 pNET 219.2 G2 qPCR
65 M 74 pNET 104.5 G1 NGS & qPCR
8 M 42 pNET 190.1 G3 qPCR
9 F 48 pNET 115.4 NA qPCR
Cancers2020,12, 2488 14 of 20
Table 5.Cont.
Sample ID. Sex Age at Sampling Group CgA (ng/mL;
Ref: 19.4–98.1)
PPGL: Benign/Malignant;
pNET: Grade G1-G2-G3 Experiment
10 F 82 pNET 79.1 G1 qPCR
11 F 76 pNET 132 G2 qPCR
12 F 58 pNET 51.5 G1 qPCR
13 M 75 pNET 2490.8 NA qPCR
14 F 64 pNET 4163 G2 qPCR
15 F 59 pNET 275.7 NA qPCR
16 M 72 pNET 49.8 G2 qPCR
17 M 73 pNET 34.4 NA qPCR
74 M 77 healthy control 38.5 na qPCR
38 M 71 healthy control 53.7 na qPCR
40 F 49 healthy control 12.7 na qPCR
31 M 49 healthy control 41.5 na qPCR
76 M 44 healthy control 39.8 na NGS & qPCR
36 F 68 healthy control 100.4 na qPCR
30 F 13 healthy control 18 na qPCR
34 M 40 healthy control 40.2 na qPCR
35 F 69 healthy control 48.7 na qPCR
41 F 47 healthy control 93 na qPCR
39 F 63 healthy control 55 na qPCR
75 M 65 healthy control 39 na qPCR
37 M 55 healthy control 57.2 na qPCR
73 M 47 healthy control 34 na NGS & qPCR
43 F 16 healthy control 52.6 na qPCR
42 F 33 healthy control 68.4 na qPCR
72 F 46 healthy control 42.8 na NGS & qPCR
32 F 58 healthy control 80.2 na qPCR
71 M 37 healthy control 27.7 na NGS & qPCR
45 F 72 healthy control without PPI 494 na qPCR
46 F 72 healthy control on PPI 5775 na qPCR
47 F 62 healthy control without PPI 198.9 na qPCR
48 F 62 healthy control on PPI 516 na qPCR
67 F 39 healthy control without PPI 42.3 na NGS & qPCR
68 F 39 healthy control on PPI 197.8 na NGS & qPCR
33 M 64 healthy control without PPI 186.7 na qPCR
49 M 64 healthy control on PPI 595.4 na qPCR
69 F 46 healthy control without PPI 45.6 na NGS & qPCR
70 F 46 healthy control on PPI 278 na NGS & qPCR
Cancers2020,12, 2488 15 of 20
All patients with pNET (12 females, 13 males; avg age: 63.4 years) had metastatic disease.
Low-CgA (<100 ng/mL) pNET group consisted of 9, high-CgA (>100 ng/mL) pNET group consisted of 16 patients. Grade of pNET was determined according to WHO 2017 classification of tumors of endocrine organs based on the Ki-67 index (Table5) [58].
PPGL group consisted of 12 females and 8 males with an average age of 41.8 years. Of them, 8 were benign, 11 were malignant (1 bilateral, 1 locally receive, and 9 metastatic) and there was no information available in one case. 14 of the 20 PPGL cases were sporadic, while 6 cases were associated with germline gene mutations in one of the PPGL susceptibility genes (Table5). All PPGL patients had elevated CgA levels (avg. CgA: 1751 ng/mL).
Altogether 24 healthy controls were included in the study. Among 29 control samples, 10 sera from 5 healthy volunteers were collected with and without proton pump inhibitor (PPI) treatment. Samples from these individuals were included if high-dose PPI at least for 2 weeks were administered [11].
In our discovery analysis, we used 8 control samples from 6 healthy individuals, 2 samples were taken from two cases after PPI treatment. None of the controls had the endocrine disease, tumor, or renal insufficiency. Eight samples obtained from patients with pNET and 8 samples obtained from PPGL patients were evaluated. In our validation set, we used all samples used in the discovery analysis along with 17 additional samples obtained from pNET, 12 samples obtained from PPGL patients, and 21 samples obtained from healthy controls (Table5). Clinical information was retrieved from the Semmelweis University medical information system. The study was approved by the Hungarian National Public Health Center (NPHC: 41189-7/2018/EÜIG, 13 December 2018) and the Scientific and Research Committee of the Medical Research Council of Ministry of Health, Hungary (ETT-TUKEB 4457/2012/EKU, 2 February 2012).
4.2. Sample Handling and RNA Extraction
Upon arriving samples were immediately processed for sera separation by centrifugation with 3000×gfor 10 min at 4◦C. Then, samples were aliquoted and refrigerated at−20◦C until further processing. Samples for RNA isolation were further processed by centrifugation with 16,000×gfor 15 min at 4◦C to deplete platelets.
CgA measurements were done as part of the routine diagnostics using an IVD qualified competitive radioimmunassay method (Chromogranin A kit; REF: CGA-RIACT; Cisbio Bioassays, Codolet, France) following the manufacturer instructions on RIA-mat-280 gamma counter (Byk-Sangtec Diagnostica, Dietzenbach, Germany).
For total RNA extraction containing small RNA fraction miRNeasy Serum/Plasma Kit (Qiagen, Cat #217184, Hilden, Germany) was applied. Custom cel-miR-39 spike-in control was added to samples during RNA extraction following the manufacturer’s instruction (Qiagen, Cat # 219610) [26]. Cellular contamination of serum samples was studied by evaluation of expression of miRNAs related to red blood cells and platelets.
4.3. miRNA Expression Profiling by Next-Generation Sequencing
MiRNA expression profiling and NGS data analysis were done as we earlier reported [26,59].
For miRNA sequencing, libraries were prepared using 5 ul RNA and the QIAseq™miRNA Library Kit (Qiagen, Cat #331505) following the manufacturer’s instructions. Next-generation sequencing was run on Illumina MiSeq instrument using MiSeq Reagent Kit v3 150-cycle (MS-102-3001, Illumina, San Diego, CA, USA. For count normalization TMM was applied as it is one of the best performing algorithm for comprehensive miRNA profiling studies [60].
4.4. RT-qPCR Validation of NGS Results
For validation TaqMan Advanced miRNA cDNA Synthesis Kit (Cat#: A28007, Thermo Fisher Scientific, Waltham, MA, USA) was applied. The expression of miRNAs was determined using individual Advanced TaqMan MicroRNA Assays (Assay IDs: cel-miR-39-3p: 478293_mir, hsa-let-7b-5p:
Cancers2020,12, 2488 16 of 20
478575_mir; hsa-let-7i-5p: 478375_mir; hsa-miR-143-3p: 477912_mir; hsa-miR-203a-3p: 478316_mir;
hsa-miR-30d-5p: 478606_mir; hsa-miR-451a: 478107_mir; hsa-miR-486-5p: 478128_mir). Expression levels were calculated by the ddCt method, and fold changes were obtained using the formula 2-ddCt. All measurements were done in triplicates.
4.5. Literature Mining for Tissue-Serum miRNA Expression Cross-Referencing
To investigate the potential origin of serum miRNAs and to compare serum and tissue miRNA expression profiles, we collected data of miRNA expression profiling studies performed on pNET (7 studies) [29–35] and PPGL (5 studies) [27,28,36–38] by PubMed search. We cross-referenced our findings with data retrieved from these studies.
4.6. Statistical Analysis
Shapiro-Wilks test was applied to reveal data distribution. A comparison of differential expression was done by unpaired T-test or Mann–Whitney U test and one-way ANOVA followed by Tukey post-hoc test depending on data distribution and grouping. P-value adjustments were applied by Benjamini–Hochberg. For hierarchical cluster analysis, complete linkage clustering with Kendall’s Tau distance measuring method was used. The receiver–operator characteristic (ROC) analysis of CgA and miRNAs’ were used for their discriminatory role between different groups. Binary logistic regression analyses were applied to evaluate the relationships between miRNAs and the incidence of PPGL/pNET and to find the best logistic model. Diagnostic accuracy was calculated as: Accuracy=(TN+TP)/
(TN+TP+FN+FP)=(Number of correct assessments)/(Number of all assessments). (TN: true negative; TP: true positive; FN: false negative; FP: false positive).
p-Value<0.05 was considered significant. Statistical analyses were done using the R statistical programming language.
5. Conclusions
As a summary, we assessed for the first time the diagnostic accuracy of circulating miRNAs in relation to CgA in patients with pNET. Using the miRNA profile, we were able to discriminate pNET/PPGL samples from healthy controls, and a global downregulation of circulating miRNA pool was observed in patients with neuroendocrine tumors compared to healthy individuals.
In a comparison of pNET or PPGL groups with controls, levels of CgA, and miRNAs showed significant differences. If samples from controls treated with PPI were included either CgA or miRNA signature alone was not applicable as biomarker for PPGL/pNET. In addition, neither CgA nor any miRNA alone was able to discriminate low CgA pNET patients from controls treated with PPI. However, the combination of CgA concentration and expression level of miRNAs in a regression model yielded higher AUC compared to those obtained using individual markers, demonstrating that our model was effective in distinguishing different groups in every comparison. Our results are in line with previous findings showing that in other cancer types, independently of individually being significantly different or not, combining more factors in a regression model increases the discriminatory value of biomarkers [61,62]. Therefore, the combination of a set of miRNAs together with CgA, even in the most challenging group (pNET patients with low CgA level or receiving PPI treatment) represents a promising diagnostic tool.
Author Contributions: Conceptualization, A.P. and H.B.; formal analysis, O.D. and H.B; funding acquisition, A.P. and H.B.; investigation, A.K., P.A.K., and H.B.; methodology, A.K., G.N., and H.B.; project administration, F.B.; resources, A.P. and H.B.; supervision, A.P. and H.B.; writing—original draft, A.K. and H.B.; writing—review and editing, A.P. and H.B. All authors have read and agreed to the published version of the manuscript.
Funding:The research was financed by the Higher Education Institutional Excellence Programme of the Ministry of Human Capacities in Hungary, within the framework of the Molecular Biology thematic programme of the Semmelweis University to Attila Patócs and by Hungarian Scientific Research Grant of National Research, Development and Innovation Office (OTKA PD116093 to Henriett Butz and K125231 to Attila Patócs). The authors would like to acknowledge the National Program of Bioinics (subtheme medical bionics lead by Attila Patócs).
Cancers2020,12, 2488 17 of 20
Henriett Butz is a recipient of Bolyai Research Fellowship of Hungarian Academy of Sciences and her work is supported by theÚNKP-19-4 New National Excellence Program of The Ministry for Innovation and Technology.
Acknowledgments:We are grateful to Barna Vásárhelyi, the director of the Department of Laboratory Medicine of Semmelweis University for his support of this work and the critical review of the manuscript.
Conflicts of Interest:The authors declare no conflict of interest.
Abbreviations
AUC area under curve
CgA chromogranin A
miRNA micro-RNA
MYC MYC proto-oncogene, bHLH transcription factor NET Neuroendocrine tumors
NF1 neurofibromin 1
NF-NET nonfunctioning neuroendocrine tumor NGS next-generation sequencing
PCC pheochromocytoma
PGL paragangliomas
pNET pancreatic neuroendocrine tumor PPGL pheochromocytoma-paraganglioma PPI proton-pump inhibitor
RET ret proto-oncogene
RIA radioimmunoassay
ROC receiver-operating characteristic
SDHB succinate dehydrogenase complex iron-sulfur subunit B UMI unique molecular index
VHL von Hippel–Lindau tumor suppressor
VIPoma vasoactive intestinal peptide producing neuroendocrine tumor
References
1. Modlin, I.; Gustafsson, B.I.; Moss, S.F.; Pavel, M.; Tsolakis, A.V.; Kidd, M. Chromogranin A—Biological Function and Clinical Utility in Neuro Endocrine Tumor Disease. Ann. Surg. Oncol.2010,17, 2427–2443.
[CrossRef] [PubMed]
2. Yao, J.C.; Hassan, M.; Phan, A.; Dagohoy, C.; Leary, C.; Mares, J.E.; Abdalla, E.K.; Fleming, J.B.; Vauthey, J.-N.;
Rashid, A.; et al. One Hundred Years After “Carcinoid”: Epidemiology of and Prognostic Factors for Neuroendocrine Tumors in 35,825 Cases in the United States.J. Clin. Oncol.2008,26, 3063–3072. [CrossRef]
[PubMed]
3. Dasari, A.; Shen, C.; Halperin, D.M.; Zhao, B.; Zhou, S.; Xu, Y.; Shih, T.; Yao, J.C. Trends in the Incidence, Prevalence, and Survival Outcomes in Patients With Neuroendocrine Tumors in the United States.
JAMA Oncol.2017,3, 1335–1342. [CrossRef] [PubMed]
4. Ro, C.; Chai, W.; Yu, V.E.; Yu, R. Pancreatic neuroendocrine tumors: Biology, diagnosis, and treatment.
Chin. J. Cancer2013,32, 312–324. [CrossRef]
5. Bílek, R.; Vlcek, P.; Šafaˇrík, L.; Michalský, D.; Novák, K.; Dušková, J.; Vaclavikova, E.; Widimský, J.J.;
Zelinka, T.; Widimský, J. Chromogranin A in the Laboratory Diagnosis of Pheochromocytoma and Paraganglioma.Cancers2019,11, 586. [CrossRef]
6. Gkolfinopoulos, S.; Tsapakidis, K.; Papadimitriou, K.; Papamichael, D.; Kountourakis, P. Chromogranin A as a valid marker in oncology: Clinical application or false hopes?World J. Methodol.2017,7, 9–15. [CrossRef]
7. Ozaslan, E.; Karacan, H.; Simsek, Y.; Bayram, F. An Overview of Neuroendocrine Tumour Markers.Turk. J.
Endocrinol. Metab.2014,18, 132–136. [CrossRef]
8. Nobels, F.R.E.; Kwekkeboom, D.J.; Coopmans, W.; Schoenmakers, C.H.H.; Lindemans, J.; De Herder, W.W.;
Krenning, E.P.; Bouillon, R.; Lamberts, S.W.J. Chromogranin A as Serum Marker for Neuroendocrine Neoplasia: Comparison with Neuron-Specific Enolase and the ?-Subunit of Glycoprotein Hormones.J. Clin.
Endocrinol. Metab.1997,82, 2622–2628. [CrossRef]