ORIGINAL ARTICLE
Fibroblasts from patients with major depressive disorder show distinct transcriptional response to metabolic stressors
KA Garbett
1, A Vereczkei
1,2, S Kálmán
1,3, L Wang
4, Ž Korade
1,5, RC Shelton
6and K Mirnics
1,3,5Major depressive disorder (MDD) is increasingly viewed as interplay of environmental stressors and genetic predisposition, and recent data suggest that the disease affects not only the brain, but the entire body. As a result, we aimed at determining whether patients with major depression have aberrant molecular responses to stress in peripheral tissues. We examined the effects of two metabolic stressors, galactose (GAL) or reduced lipids (RL), on the transcriptome and miRNome of human fi broblasts from 16 pairs of patients with MDD and matched healthy controls (CNTR). Our results demonstrate that both MDD and CNTR fibroblasts had a robust molecular response to GAL and RL challenges. Most importantly, a signi fi cant part (messenger RNAs (mRNAs): 26 – 33%;
microRNAs (miRNAs): 81 – 90%) of the molecular response was only observed in MDD, but not in CNTR fi broblasts. The applied metabolic challenges uncovered mRNA and miRNA signatures, identifying responses to each stressor characteristic for the MDD fi broblasts. The distinct responses of MDD fi broblasts to GAL and RL revealed an aberrant engagement of molecular pathways, such as apoptosis, regulation of cell cycle, cell migration, metabolic control and energy production. In conclusion, the metabolic challenges evoked by GAL or RL in dermal fi broblasts exposed adaptive dysfunctions on mRNA and miRNA levels that are characteristic for MDD. This finding underscores the need to challenge biological systems to bring out disease-specific deficits, which otherwise might remain hidden under resting conditions.
Translational Psychiatry (2015) 5, e523; doi:10.1038/tp.2015.14; published online 10 March 2015
INTRODUCTION
Major depressive disorder (MDD) is a mental disorder character- ized by persistent depressed mood, anhedonia, sleep and appetite disturbances, and feelings of worthlessness, guilt and hope- lessness. It is increasingly viewed as an illness of the body as well as of the mind.
1Both genetic and environmental factors have been associated with the etiology of the disease,
2but their interplay remains unexplained to date. Stressful life events are associated with the onset and severity of major depression;
3therefore, we speculated that aberrant adaptive responses to stressors would be also detectable at the cellular level.
Coordination of cellular responses to stress is largely accom- plished by mitochondria.
4Regardless of the type of stress a cell is experiencing (for example, exposure to harmful chemicals, changes of nutrient or oxygen supplies, dangerous levels of reactive oxygen species or even pathogen invasion), mitochondria utilize a wide array of mechanisms aimed at restoring cellular homeostasis.
5Therefore, the health of these cellular organelles is critical not only for the fate of the individual cells, but for the well- being of the entire organism. Not surprisingly, abnormalities in mitochondrial functions have been implicated in neurological
6and psychiatric disorders,
7–9and speci fi cally in MDD.
10In addition, mitochondria are involved in multiple metabolic pathways and are the most prominent generators of energy in the cell. Energy is produced in the cytoplasm through glycolysis, or in the mitochondria through oxidative phosphorylation, also known as mitochondrial respiration. The reliance on energy produced by mitochondrial respiration, rather than glycolysis, can be
experimentally shifted by changing the sugar source in the cell culture medium from glucose to galactose (GAL).
11The shift to oxidative phosphorylation can reveal mitochondrial de fi cits intersecting control of carbohydrate metabolism and energy homeostasis. Energy production is also tightly interconnected with lipid metabolism through the key metabolite acetyl-CoA. Acetyl- CoA may remain in the mitochondria for energy production or may be exported for de novo fatty acid synthesis into the cytoplasm, depending mainly on the availability of fatty acids. This adaptive shift can be experimentally directed by limiting the fatty acid supply in the cell culture medium. Therefore, cellular adaptation to stress can be tested by simple manipulations of the carbohydrate and fatty acids source in the culture medium.
Molecular adaptation to stress in the context of mental disorders is dif fi cult to address in the human brain. Alternatively, we used in vitro propagated peripheral cells to test the effects of metabolic stress. Dermal fibroblasts are an appealing cell-based model for studying peripheral events associated with brain disorders, based on the ease of establishing them from skin biopsies, and the ability to maintain in culture without additional reprograming.
12In addition, the confounding variability in human samples on the basis of patients’ hormones, life style or medication use, are virtually eliminated after several cell divisions.
To date, skin fi broblast cultures have been used successfully to elucidate molecular mechanisms associated with schizophrenia
13,14and developmental disorders,
15,16and for discerning abnormalities in signal transduction pathways in MDD.
12,17–19In addition, previous reports for dysregulations in
1Department of Psychiatry, Vanderbilt University, Nashville, TN, USA;2Department of Medical Chemistry, Molecular Biology and Pathobiochemistry, Semmelweis University, Budapest, Hungary;3Department of Psychiatry, University of Szeged, Szeged, Hungary; 4Department of Biostatistics, Vanderbilt University, Nashville, TN, USA;5Vanderbilt Kennedy Center for Research on Human Development, Vanderbilt University, Nashville, TN, USA and6Department of Psychiatry, University of Alabama, Birmingham, AL, USA.
Correspondence: Dr KA Garbett, Department of Psychiatry, Vanderbilt University, 8128 MRB III, 465 21st Avenue South, Nashville, TN 37232, USA.
E-mail: krassimira.garbett@vanderbilt.edu
Received 2 October 2014; revised 12 December 2014; accepted 19 December 2014
www.nature.com/tp
lipid metabolism
20and mitochondrial respiration,
21suggest abnormalities in mitochondrial function in the periphery of MDD patients. Therefore, we aimed at elucidating whether MDD fi broblasts would in addition exhibit molecular de fi cits in response to metabolic stressors such as GAL and reduced lipids (RL) in the culture medium. In this manuscript, we present the experimental data gathered from metabolically challenged human dermal fi broblasts and discuss their relevance to MDD.
MATERIALS AND METHODS Human fibroblasts
This study was approved by the Vanderbilt University Institutional Review Board. Participants were diagnosed with a current major depressive episode according to the Structured Clinical Interview for DSM-IV-TR22with an exclusion criteria of other primary axis I DSM-IV diagnosis. Procedures for recruitment and diagnosis have been described previously.12,18 A written informed consent was obtained from all the participants before any procedures were conducted. Sixteen healthy controls (CNTR) were matched by age, race and gender to MDD patients (Supplementary Material 1). The MDD and CNTR subject groups had similar average age (MDD = 34.9, CNTR = 35.2), representation of gender (12 female and four male) and race (12 white and four African American). Fibroblast cultures were established from skin biopsies according to a protocol previously described.12,18
Briefly, fibroblast cultures underwent 5–10 passages with DMEM (Dulbecco’s Modified Eagle’s medium; Mediatech, Manassas, VA, USA) containing 250 mMglucose and 1 mM sodium pyruvate, supplemented with 2 mM L-glutamine (Mediatech), 10% fetal bovine serum (Thermo Scientific HyClone, Logan, UT, USA) and antibiotic/antimycotic solution (Invitrogen, Carlsbad, CA, USA). Cultures were maintained at 37 °C and 5%
CO2. A cell line from each patient was divided into three plates (plating density 1.2 × 10⁶cells per plate) and after overnight adherence, each plate received one of the following formulations: (1) standard (STD) medium:
DMEM containing 25 mMglucose; (2) galactose-containing (GAL) medium:
DMEM with no glucose, supplemented with 10 mMGAL (Sigma-Aldrich, St.
Louis, MO, USA); (3) RL medium: DMEM containing 25 mM glucose, supplemented with lipid-reduced fetal bovine serum (Thermo Scientific HyClone). All the cultures were grown for 7 days, refreshing the media every 2 days. The cells were collected after washing with ice-cold phosphate-buffered saline twice, and then trypsinized, pelleted (700 g for 8 min at 18 ºC) and stored at−80 °C until RNA isolation. In all the tested cell lines, neither GAL nor RL exhibited a detectable effect on cell growth and mortality.
RNA isolation and analyses
Total RNA and small RNA fractions were isolated from frozenfibroblasts using mirVana microRNA (miRNA) isolation Kit (Ambion, Austin, TX, USA) according to manufacturer’s instruction. Both total RNA and small RNA were eluted with 100μl Elution Solution. Agilent 2100 Bioanalyzer was used to determine the quality and size of the RNA preps. Total RNA integrity number for all messenger RNA (mRNA) samples ranged from 9.4 to 10, and was similar between the MDD and CNTR groups and various conditions. The samples were stored at−80 °C until further use.
The mRNA levels in each fibroblast culture were examined with the GeneChip HT HG-U133+ PM Array Plate (Affymetrix, Santa Clara, CA, USA).
The complementary DNA synthesis from total RNA, labeling and hybridization were performed according to manufacturer’s protocol. The segmented images from each GeneChip were normalized and log2 transformed using GC-robust multi-array analysis.23The average logarith- mic ratio (ALR = MeanMDD−MeanCNTR) was calculated for each gene probe, as an indicator for magnitude of change and Student’s paired and group two-tailedP-values as indicators for significance of change. Significance was established according to the dual criteria of |ALR|40.3785 (30%
change) and both pairwise and groupwise P⩽0.01. Quantitaive PCR validation of the microarray data was performed with RT2custom Profiler PCR Arrays (Qiagen, Valencia, CA, USA), designed to test the mRNA expression level of 10 genes involved in the regulation of lipid metabolism:
stearoyl-CoA desaturase (delta-9-desaturase), fatty acid binding protein 3, 7-dehydrocholesterol reductase, insulin induced gene 1, quinolinate phosphoribosyltransferase, 3-hydroxy-3-methylglutaryl-CoA reductase, 3- hydroxy-3-methylglutaryl-CoA synthase 1, low-density lipoprotein recep- tor, fatty acid desaturase 1, fatty acid desaturase 2. The differentially
expressed genes were subjected to a two-way hierarchical clustering analysis using GenePattern software.24In addition, for each gene probe, we applied a linear statistical model with gene expression values as the outcome variable and group, stressor and group × stressor asfixed effects (groups: CNTR, MDD; stressors: GAL, RL). Data were analyzed with procedure MIXED in SAS software (version 9.3, SAS Institute, Cary, NC, USA). Gene set enrichment analysis (GSEA) based on pre-defined gene classes were carried out with the GenePattern software.25BioCarta defined set of genes were considered significantly overrepresented atP⩽0.05.
The miRNA levels were interrogated with miRNome miScript miRNA PCR Arrays (Qiagen). The complementary DNA was prepared from small RNA preps with miScript HiSpec Buffer according to miScript II RT Kit (Qiagen) instructions. The complementary DNA from each sample was quantified and proportionately combined into four pools of samples according to age and gender (Supplementary Material 1). Creating multiple sample pools from closely matched individuals allowed us a reduced work load and cost, while still retaining the ability to establish statistical significance in the downstream analyses. However, to avoid any pooling biases and outlier effects, the outcome of these data had to be validated in the individual samples. As a result, significantly changed miRNA levels in each individual fibroblast sample were examined with custom miScript miRNA PCR Arrays.
(Qiagen), containing assays for the following miRNAs: miR-146b-5p, miR-550a, miR-214, miR-132*, miR-376c, miR-19a, miR-181a*, miR-486-5p, miR-424*, miR-542-3p, miR-22, miR-376b, miR-29b, miR-564. The selection of the 14 miRNA assays was based on a statistically significant difference in response to GAL or RL in the MDD or the CNTR group. The Ct values for each miRNA from both miRNome and custom qPCR arrays were normalized to the average Ct from a set of housekeeping genes and thus ΔCt values were generated. At Ct435, a miRNA level was considered non- detectable. In cases where the levels of a miRNA were non-detectable in two or more samples within a group, the miRNA was not used for further comparisons. The miRNA difference of expression between groups was measured by ΔΔCtRL= MeanΔCtRL−MeanΔCtSTDand ΔΔCtGAL= MeanΔCt
GAL−MeanΔCtSTD. A miRNA was considered differentially expressed when | ΔΔCt|40.3785 and pairwise P⩽0.05. Group × stressor interaction was determined by the dual criteria of |ΔΔΔCt|40.3785 (30% difference) and groupwise P⩽0.05. ΔΔΔCtGAL=ΔΔCtMDDGAL−ΔΔCtCNTRGAL; ΔΔΔCtRL
=ΔΔCtMDDRL−ΔΔCtCNTRRL.
RESULTS
MDD fi broblast response to metabolic stress: mRNA changes Metabolic stress response in MDD and CNTR fi broblasts from 32 subjects (16 MDD and 16 CNTR) was achieved by exposure to culture media containing GAL or RL (Supplementary Material 2).
Analysis of mRNA species by oligonucleotide microarrays revealed that GAL substitution of glucose in the growth medium resulted in robust changes in the transcriptome of both MDD and CNTR fi broblasts. Using dual criteria for establishing signi fi cant expression differences (|ALR
GAL−STD| 4 0.3785 (30% change) and both group- and pairwise P ⩽ 0.01), we identified 1196 transcripts changed in GAL-treated MDD fibroblasts (Supplementary Material 3A). Of those, 975 were upregulated as a result of GAL treatment. According to the same criteria, 1111 probes were changed in CNTR fi broblasts, 733 of which were upregulated. In comparison with the CNTR fi broblasts, MDD fi broblasts revealed a distinct GAL-induced mRNA pattern; of the total number of mRNAs, 310 (26%) were only exhibited in MDD (Supplementary Material 4A).
RL treatment also resulted in pronounced mRNA changes in both MDD and CNTR cells. Differential expression in RL conditions (compared with STD media) was noted for 312 transcripts in the MDD: 262 upregulated and 50 downregulated mRNAs. Similarly, in CNTR fi broblast, 360 mRNA species (261 upregulated, 99 down- regulated) were differentially expressed in RL compared with STD conditions (Supplementary Material 3B). Importantly, the MDD fi broblasts responded to RL condition differently than CNTR; 103 (33.4%) of all mRNA changes induced by RL were only exhibited in MDD (Supplementary Material 4B).
It was remarkable that both GAL and RL treatments resulted in
distinct mRNA changes in MDD fibroblasts that were not present
2
in CNTR, therefore, we further sought to identify the interaction effect between disease state and metabolic challenge (group × stressor) by applying a linear statistical model. We used a dual signi fi cance cutoff criterion of | Δ ALR| 4 0.3785 (30% change) and P ⩽ 0.01. We found that the characteristic MDD signature in response to GAL (MDD × GAL) was de fi ned by 28 (Figure 1a), and in response to RL (MDD × RL) was de fi ned by 20 mRNA species (Figure 1b). Two of the genes (integrator complex subunit 4; INTS4 and NEDD4 binding protein 2-like 1; N4BP2L1) overlapped in the MDD × GAL and MDD × RL response-de fi ning pattern.
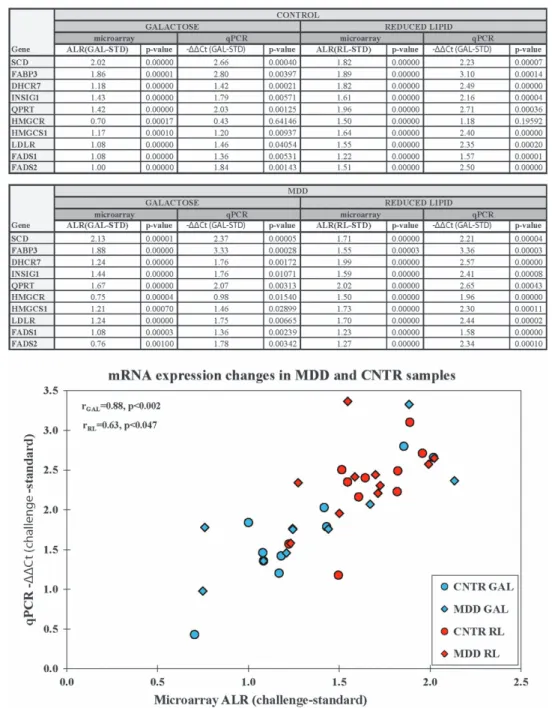
Custom qPCR arrays were used to validate the microarray- detected mRNA changes in response to GAL and RL. The arrays were designed to test the mRNA expression level of 10 genes involved in lipid metabolism with significantly changed expression
in MDD and in CNTR samples in GAL vs STD and in RL vs STD conditions. The statistical signi fi cance of the microarray-detected expression changes for all 10 genes was con fi rmed by qPCR (Figure 2). In addition, the microarray ’ s ALRs had a high correlation with the qPCR ’ s − ΔΔ Ct in both GAL vs STD and RL vs STD comparisons.
To better understand what molecular pathways are differently engaged in MDD compared with CNTR in response to metabolic stress, we performed GSEA with predetermined gene sets by BioCarta. Signi fi cantly enriched gene sets, representing molecular pathways, were identi fi ed for both MDD and CNTR in GAL and RL environment (Table 1, GSEA). GAL treatment induced enrichment of 21 pathways in MDD and 17 in CNTR. Nine of the 21 gene sets (43%) were only enriched in MDD and are involved in cell cycle
Figure 1.Disease × stressor interaction mRNA signatures. (
a) MDD × GAL and (
b) MDD × RL. The ALR (Mean
RL−Mean
STD) of the probes with signi
ficant disease × challenge interaction were subjected to unsupervised hierarchical clustering. The colored squares represent the increase (red) or decrease (blue) of each ALR from the mean. Color intensity is proportional to magnitude of change. Clear separation of MDD and CNTR groups was observed. Furthermore, two genes (INTS4 and N4BP2L1
—denoted by arrows) are commonly present in both signatures.
CNTR, control; GAL, galactose; MDD, major depressive disorder; mRNA, messenger RNA; RL, reduced lipid; STD, standard.
3
regulation (PTC1, MPR, ACAP95, ARF), apoptosis (HSP27, SET, BAD), anti-in fl ammation (IL10) and cell survival (IL7). RL resulted in enrichment of 19 pathways in MDD and 15 in CNTR. Ten of the 19 gene sets (53%) were only enriched in MDD and are involved in cell repair (TFF), survival (TRKA), migration (ECM) and proliferation (CDMAC, SPRY), and also in regulation of metabolism (GH) and energy production (FEEDER, GLYCOLYSIS). Overall, GSEA revealed that the speci fi c changes in MDD evoked by both metabolic stressors are represented by approximately half of all detected molecular pathways, indicating that MDD fi broblasts utilize different strategies for adaptation to the metabolic stressors. Moreover, challenging the MDD fi broblasts with GAL and RL exposed characteristic molecular signatures undetectable at STD conditions.
MDD fibroblast response to metabolic stress: miRNA changes The miRNAs are important regulators of mRNA function and they are heavily involved in control of metabolism and energy homeostasis.
26Therefore, we sought to identify the miRNA response to metabolic challenges in the same MDD fi broblasts in which differential mRNA expression patterns had been established.
The miRNA samples, isolated individually from the 16 MDD and 16 CNTR fi broblast cultures, were pooled into four sets according to the patients ’ age and gender (Supplementary Material 1).
Human miRNome miScript miRNA PCR Arrays (Qiagen) were used to pro fi le the expression of the 1008 most abundantly expressed miRNA species in the human miRNA genome (miRNome).
Figure 2.
qPCR validation of the differential mRNA expression detected with microarrays. The differential expression of 10 mRNAs, detected with microarrays, was validated with custom qPCR arrays (groups: MDD, CNTR; culture conditions: STD, GAL, RL). ALR (ALR
GAL=Mean
GAL−Mean
STD, blue, ALR
RL=Mean
RL−Mean
STD, pink) was used as an estimate for the microarray expression changes and was plotted on the x axis.
ΔΔ
Ct (
ΔΔCt
GAL=ΔCt
GAL−ΔCt
STD, blue;
ΔΔCt
RL=ΔCt
RL−ΔCt
STD,pink) was used for a qPCR expression changes estimate and was plotted as
−ΔΔ
Ct on the y axis. Note that the estimates from both analyses in each comparison were highly correlated. CNTR, control; GAL, galactose;
MDD, major depressive disorder; mRNA, messenger RNA; qPCR, quantitative PCR; RL, reduced lipid; STD, standard.
4
Approximately 50% of the assayed miRNAs were detected in human cultured dermal fi broblasts, regardless of disease status or culture condition. Signi fi cant expression differences in metabolic stress vs STD conditions were defined when change was larger than 30% (| ΔΔ Ct| 4 0.3785) and paired t-test P ⩽ 0.05. In response to GAL challenge, MDD fi broblasts revealed expression changes in 63 miRNAs (Supplementary Material 5A). The number of miRNAs changed by GAL challenge in CNTR samples was substantially lower, 38 miRNAs. In addition, 81% of the miRNAs changed in GAL were speci fi c for MDD fi broblasts.
RL elicited much stronger miRNA response in MDD (147 miRNAs), compared with CNTR (38 miRNA) (Supplementary Material 5B), leading us to believe that MDD fibroblasts are experiencing the RL environment as much more stressful than CNTRs. Furthermore, 90% of the miRNA RL-response pattern was observed only in MDD, but not in CNTR.
Validation of miRNome analyses on pooled samples was performed with custom qPCR array of 14 miRNAs (SABiosciences, Qiagen) on individual samples. The ΔΔ Ct ( ΔΔ Ct
GAL= Δ Ct
GAL− Δ Ct
STD
, ΔΔ Ct
RL= Δ Ct
RL− Δ Ct
STD) from the pooled samples for each miRNA was correlated with the corresponding ΔΔ Ct from the individual samples (Figure 3). Both GAL- and RL-induced miRNA response demonstrated high correlation between pooled and individual samples with coef fi cients of r
GAL= 0.920 and r
RL= 0.785.
In addition, 85% of the miRNA changes in the individual samples were significantly different in the predicted direction (P ⩽ 0.05), providing a strong validation for the miRNome data.
In addition, in an attempt to identify the miRNA changes that characterize the speci fi c response of MDD to each metabolic challenge, we used a group × challenge linear statistical model and the dual significance criterion of |ΔΔΔCt|40.3785 and P ⩽ 0.05. Thus, we derived two miRNA signatures: (1) representing MDD × GAL interaction (16 miRNAs) and (2) representing MDD × RL interaction (36 miRNAs, Figure 4). It is noteworthy that miR-7, miR-382, miR-296-5p and miR-3176 were common for both signatures.
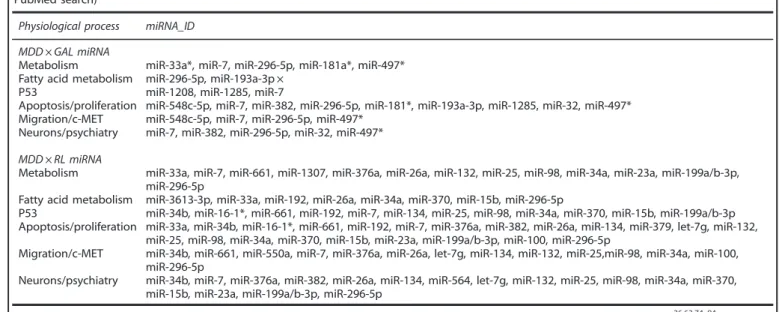
Literature search in PubMed for the roles of the MDD × GAL and MDD × RL signature miRNAs revealed an interesting trend toward extensive miRNA involvement in the regulation of metabolism, cell proliferation, survival and migration (Table 2). In relation to control of metabolism, we found miRNAs regulating insulin levels and secretion, obesity and starvation in both MDD × GAL (38%) and MDD × RL (37%) panels. In addition, eight miRNAs from the MDD × RL panel: miR-3613-3p, miR-33a, miR-192, miR-26a, miR- -34a, miR-370, miR-15b and miR-296-5p, have been described in the literature as regulators of lipid metabolism. With regard to cell proliferation and apoptosis, 56% of the MDD × GAL and 61% of the MDD × RL miRNAs are known controllers of various signaling
Table 1. BioCarta GSEA enrichment of mRNA expression in responseto GAL and RL challenges
Pathway Size NES P-value
Enriched in CNTR GAL
RACCYCD 26 1.89 0.0076
CELLCYCLE 23 1.81 0.0000
TEL 18 1.74 0.0040
SRCRPTP 11 1.72 0.0000
P53 16 1.66 0.0078
CERAMIDE 22 1.65 0.0115
CFTR 12 1.62 0.0000
CHREBP2 42 1.61 0.0275
G2 24 1.61 0.0199
ATRBRCA 21 1.58 0.0159
CARM_ER 34 1.58 0.0373
STATHMIN 19 1.56 0.0233
ATM 20 1.55 0.0492
CHEMICAL 22 1.53 0.0497
RB 13 1.53 0.0346
AKAPCENTROSOME 15 1.52 0.0471
PLCE 12 1.51 0.0299
Enriched in CNTR RL
PPARA 56 1.83 0.0000
RACCYCD 26 1.71 0.0229
CHREBP2 42 1.65 0.0136
CD40 15 1.59 0.0301
ARF 17 1.57 0.0359
VIP 26 1.57 0.0169
P38MAPK 39 1.53 0.0076
HSP27 15 1.50 0.0389
BAD 26 1.50 0.0217
GCR 19 1.47 0.0360
LYM 11 1.43 0.0368
PLCE 12 1.43 0.0443
IL22BP 16 −1.53 0.0300
DNAFRAGMENT 10 −1.54 0.0237
AHSP 11 −1.56 0.0412
Enriched in MDD GAL
TEL 18 1.98 0.0000
SRCRPTP 11 1.73 0.0020
PTC1 11 1.73 0.0000
G2 24 1.66 0.0021
CARM_ER 34 1.66 0.0056
HSP27 15 1.65 0.0116
RB 13 1.62 0.0062
CERAMIDE 22 1.60 0.0212
P53 16 1.58 0.0220
SET 11 1.58 0.0328
CHEMICAL 22 1.58 0.0243
ATRBRCA 21 1.57 0.0080
MPR 34 1.56 0.0413
CELLCYCLE 23 1.56 0.0305
AKAP95 12 1.56 0.0469
CHREBP2 42 1.56 0.0222
IL10 17 1.53 0.0320
ARF 17 1.50 0.0382
PLCE 12 1.47 0.0301
IL7 17 1.46 0.0258
BAD 26 1.43 0.0138
Enriched in MDD RL
RACCYCD 26 1.90 0.0040
TFF 21 1.88 0.0064
CD40 15 1.78 0.0102
TRKA 12 1.74 0.0084
ECM 24 1.67 0.0234
PPARA 56 1.63 0.0066
HSP27 15 1.62 0.0176
GH 28 1.60 0.0204
GLEEVEC 23 1.58 0.0361
Table. 1. (Continued )
Pathway Size NES P-value
ARF 17 1.54 0.0463
EXTRINSIC 13 1.53 0.0140
CHREBP2 42 1.53 0.0246
CDMAC 16 1.52 0.0355
BAD 26 1.48 0.0118
SPRY 18 1.45 0.0417
FEEDER 9 −1.53 0.0236
DNAFRAGMENT 10 −1.54 0.0488
AHSP 11 −1.56 0.0354
GLYCOLYSIS 10 −1.63 0.0040
Abbreviations: CNTR, control; GAL, galactose; GSEA, gene set enrichment analysis; MDD, major depressive disorder; mRNA, messenger RNA; RL, reduced lipid. Molecular pathway enrichment of mRNA in MDD and CNTR.
Pathways enriched only in one group (MDD or CNTR) are in bold.
5
cascades, out of which 13% (GAL) and 33% (RL) affect or are affected by the tumor suppressor protein p53. As p53 is not only a modulator of apoptosis, but is also involved in regulation of metabolism,
27some overlap between these categories is expected. Furthermore, 25% (MDD × GAL) and 39% (MDD × RL) of the signature miRNAs are known to regulate cell motility.
Interestingly, three of them: miR-34a, miR-34b and miR-199a-3p, are recognized as regulators of the hepatocyte growth factor receptor, c-Met,
28,29a key controller of cell migration.
DISCUSSION
Our results demonstrate that the metabolic challenges evoked by substitution of glucose with GAL or reducing the abundance of lipids in the growth media of fi broblast cultures result in robust changes of mRNA and miRNA expression. MDD fibroblasts responded to the metabolic stress with alternate expression of 1196 (GAL) and 312 (RL) transcripts. A substantial fraction of these mRNA changes, 26% (GAL) and 33% (RL) were only observed in MDD, but not in CNTR. The specific response of MDD fibroblasts to each challenge was represented by 20 (MDD × GAL) and 28 (MDD × RL) mRNAs with signi fi cant group by challenge interaction.
The characteristic response of MDD fi broblasts to the metabolic stressors was even more pronounced on the miRNA level; 81%
(GAL) and 90% (RL) of the total miRNA changes were only observed in MDD, but not in CNTR. The miRNA signature response of MDD fi broblasts was de fi ned by 16 (MDD × GAL) and 36 (MDD × RL) miRNAs. The stress-induced changes, observed on both mRNA and miRNA level, revealed MDD-associated impair- ments in molecular pathways involved in the control of metabolism and energy production, cell survival, proliferation and migration. These impairments are likely to be present in all the somatic cells, and therefore are informative of the disease process. In fact, the results are consistent with our previous fi ndings in human postmortem brain tissue, as both studies implicated disturbances in apoptotic molecular pathways.
30Impairments in any of the detected molecular pathways could
be critical for the development and plasticity of the brain and can result in the disease state of MDD.
31In a previous study, MDD fi broblasts cultured in STD condition revealed de fi cits in cell proliferation and cell motility.
32In this study, we demonstrated that molecular pathways involved in the same processes were also impaired in response to metabolic challenges with GAL and RL, and revealed previously unknown disruption of pathways regulating metabolism and energy production. Presenting meta- bolic challenges was instrumental for de fi ning distinct MDD mRNA and miRNA response signatures that might also contribute to patients ’ aberrant responses to life stressors.
GAL and RL treatments elicited common responses in MDD fibroblasts. The commonality was demonstrated on both mRNA and miRNA level. On mRNA level, the overlap between MDD × GAL and MDD × RL signatures was defined by the integrator complex subunit 4 (INTS4), and the NEDD4 binding protein 2-like 1 (N4BP2L1). The INTS4 associates with RNA polymerase II, and therefore potentially has a general effect on regulation of gene transcription and RNA processing.
33The N4BP2L1 is a paralog of N4BP2 and is likely involved in cell survival.
34Evidence for MDD impairment in the regulation of cell survival and proliferation streamed from the molecular pathway analyses as well. The HSP27, BAD and ARF molecular pathways were the commonly enriched pathways in MDD during GAL and RL challenges; all of which affect cell survival and proliferation. Furthermore, 38%
(GAL) and 17% (RL) of the MDD-enriched gene sets (PTC1, MPR, ACAP95, ARF, HSP27, SET, BAD, IL7, TRKA, CDMAC, SPRY), contribute to the regulation of cell survival and proliferation. On the miRNA level, three of the commonly changed miRNAs are regulators of cell proliferation and apoptosis.
35–37In addition, a striking 56–61% of the miRNAs from the MDD × GAL and MDD × RL signatures have roles in cell cycle and survival regulation. Overall, these data provide an overwhelming support for the aberrant engagement of mechanisms regulating cell proliferation and survival by MDD fi broblasts when exposed to two distinct metabolic challenges. Commonality between GAL- and RL-induced responses in MDD was also detected in their respective miRNA signatures, where at least 38% (GAL) and 37%
(RL) of the miRNAs were regulators of metabolism or energy homeostasis, indicating de fi ciencies in those signaling cascades in MDD as well. In summary, the challenges presented by GAL and RL in MDD fi broblasts affected cellular processes, such as control of cell proliferation and survival, regulation of metabolism and energy production. The molecular machinery for regulation of these processes is located mainly in the mitochondria. Therefore, our data strongly support the disruption of mitochondrial functions in patients with MDD, as previously suggested.
10The GAL and RL treatment also evoked different responses in MDD fibroblasts. The number of mRNAs with changed expression in GAL was four times the number of mRNAs changed in RL. In contrast, the mRNA signatures characterizing the specific response of MDD to each stress, have similar number of mRNAs (MDD × GAL = 28, MDD × RL = 20). Therefore, the proportion of the speci fi c mRNAs from the total mRNA changes (GAL = 1196, RL = 360) is in favor of RL (5.6 vs 2.3%). Consequently, we concluded that RL vs GAL environment more strongly illuminates the molecular de fi cits of MDD. Furthermore, additional data, obtained from RL treatment, reveal abnormalities in MDD, which were not apparent in GAL. These are the eight miRNAs in the MDD × RL miRNA signature known to control lipid metabolism, pointing toward the possibility of fatty acid metabolism dysregulation in patients with MDD, a phenomenon studied in many different ways during the last couple of decades.
38–42Another interesting fact revealed only in RL environment is the presence of six hypoxamirs in the MDD × RL miRNA signature. Hypoxamirs have been identi fi ed as miRNAs contributing to mitochondrial respiration arrest in a low oxygen environment.
43In our study, CNTR fibroblasts upregulated six hypoxamirs (let-7b*, miR-192, miR-26a, miR-98, miR-23a and
Figure 3.Differential miRNA expression in pooled samples is
validated in individual samples. The expression level of 14 miRNAs, detected in miRNome analyses of pooled samples, was validated with independent qPCR arrays of individual samples (groups: MDD, CNTR; culture conditions: STD, GAL, RL). The expression changes, estimated with
ΔΔCt (
ΔΔCt
GAL=ΔCt
GAL−ΔCt
STD, blue;
ΔΔCt
RL=Δ
Ct
RL−ΔCt
STD,pink), from the pooled samples are plotted on the x axis, and from the individual samples on the y axis. Note that the values from each comparison were highly correlated. CNTR, control;
GAL, galactose; MDD, major depressive disorder; miRNA, microRNA;
qPCR, quantitative PCR; RL, reduced lipid; STD, standard.
6
miR-7)
44in response to RL, whereas MDD fi broblasts down- regulated them. This particular difference in the MDD response compared with CNTR further supports the notion of mitochondrial dysfunction in MDD. The RL challenge was also very informative in uncovering abnormalities in the process of cell migration; 39% of the miRNAs in the MDD × RL miRNA signature were regulators of metastasis. Also, MDD responded to RL with enrichment of ECM (extracellular matrix) pathway and TFF (Trefoil factors initiate mucosal healing) pathway; both important players in the processes of cell migration. The de fi cit of MDD in cell migration was not as apparent during adaptation to GAL, but was observed in a previous study in STD conditions.
32An important question is whether the changes we detect in peripheral tissues are relevant to a disease process that takes place primarily in the brain. Genetic factors associated with MDD are likely to be present throughout the entire body and not just be speci fi c to the brain. The adaptive de fi cits detected in fi broblast cell lines can be linked back to the function of neurons and the brain, with multiple examples found in the mRNA and miRNA challenge-response signatures and in the altered molecular pathways. On mRNA level, such examples are presented by genes important for neurite outgrowth, neurodevelopment and synaptic
plasticity: Actin-related protein 2/3 complex, subunit 5 (ARPC5),
45ArfGAP with coiled-coil, ankyrin repeat and PH domains 2 (ACAP2)
46and Beta-1,3-glucuronyltransferase 2 (glucuronosyl- transferase S, B3GAT2).
47Multiple important roles in the nervous system are associated with miRNA challenge-response signatures as well. Generally, 31% (GAL) and 47% (RL) of the miRNAs from the miRNA signatures are either regulators of molecular events in the brain or biological markers associated with psychiatric disorders in the periphery. In particular, we identi fi ed miRNAs with roles in neurite outgrowth and synapse formation: miR-7,
48miR-26a,
49miR-34a,
50miR-134 (ref. 51) and miR-132;
52,53cell cycle progres- sion, apoptosis and speci fi cation of neurons: miR-25,
54miR-34a,
55miR-497 (ref. 56) and miR-376a;
57brain morphogenesis: miR-7,
58miR-370 (ref. 59) and myelination in the central nervous system:
miR-23a.
60Furthermore, our study identi fi ed miRNAs implicated in the pathological development of schizophrenia, such as miR-132 (ref. 61) and miR-382;
62and of Alzheimer ’ s, such as miR-98.
63In addition, several of the miRNAs with aberrant challenge-response in MDD have been described as potential peripheral biomarkers for psychiatric or neurological diseases: miR-564 (ref. 64) and miR-132 for schizophrenia;
65hsa-let-7g and miR-15b for Alzhei- mer's;
66and miR-1285, miR-34a and miR-34b for Huntington’s
Figure 4.Disease × stressor interaction miRNA signatures. (
a) MDD × GAL and (
b) MDD × RL. The
ΔΔCts (
ΔΔCt
GAL=ΔCt
GAL−ΔCt
STD;
ΔΔCt
RL=Δ
Ct
RL−ΔCt
STD) of the miRNAs with signi
ficant disease × challenge interaction were subjected to unsupervised hierarchical clustering. The colored squares represent the increase (red) or decrease (blue) of each
ΔΔCt from the mean. Increased
ΔΔCt represents reduced level of miRNA in metabolic stress compared with STD conditions. Clear separation of MDD and CNTR groups was observed. Four miRNAs (that is, miR-7, miR-382, miR-296-5p and miR-3176), denoted by arrows, are commonly present in both signatures. CNTR, control; GAL, galactose; MDD, major depressive disorder; miRNA, microRNA; RL, reduced lipid; STD, standard.
7
disease.
67This study also identi fi ed a number of miRNAs that respond to different stressors in the nervous system: miR-34b, which affects the degree of oxidative stress and survival of dopaminergic neurons;
68miR-296-5p, which responds to oxidative stress in mouse hippocampal neuronal cultures;
69miR-199a, which reacts to hypoxia in rat cortical pericytes;
70and miR-98, which is elevated in the brains of newborn rats experiencing prenatal stress.
71And last, miR-296-5p, which showed aberrant response to both RL and GAL in MDD fi broblasts, presents a strong connection to MDD; miR-296-5p has been identified as a regulator of inducible I kappa-B kinase,
72a gene with genetic association with MDD.
73Taken together, this information gives con fi dence to the relevance of our observations in fibroblasts to the MDD disease state. This study provides a solid foundation for future experi- ments with human fi broblasts aimed at deciphering the systemic immune disturbances in MDD. Moreover, our results demonstrate that aberrant responses to stressors are indeed present in the peripheral tissues from MDD patients. These responses intersect multiple cellular processes associated with mitochondria, such as regulation of metabolism and energy production, cell prolifera- tion, survival and motility; therefore, they strongly suggest that the stress-response impairments of MDD patients are most likely based on impaired mitochondrial functions.
CONFLICT OF INTEREST
RCS receives unrelated research support from Assurex Health; Bristol-Myers Squibb;
Eli Lilly and Company; Elan Corporation; Euthymics Bioscience; Forest Pharmaceuticals; Janssen Pharmaceutica; Jazz Pharmaceuticals; Naurex; Novartis Pharmaceuticals; Otsuka Pharmaceuticals; Pamlab; Pfizer; Repligen Corporation;
Ridge Diagnostics; St. Jude Medical; and Takeda Pharmaceuticals and consults for Bristol-Myers Squibb Company; Cerecor; Cyberonics; Eli Lilly and Company; Forest Pharmaceuticals; Janssen Pharmaceutica; Medtronic; Naurex; Pamlab; Pfizer; Ridge Diagnostics; Shire Plc; and Takeda Pharmaceuticals. The remaining authors declare no conflict of interest.
ACKNOWLEDGMENTS
KM was supported by National Institute of Mental Health Grants R01 MH067234 and R01 MH079299. RCS was supported by National Institute of Mental Health Grants MH01741, MH52339 and MH073630 and a grant from the Brain and Behavior
Research Foundation. We are especially grateful to Weining Xu, Senior Manager at Qiagen, for her invaluable guidance in the use of the miRNome arrays. We thank the Vantage Molecular Biology Core at Vanderbilt for their help in performing the microarray and miRNome array studies. We offer our sincere appreciation to Dr Marla Perna, who provided constructive comments on the manuscript preparation.
REFERENCES
1 Verhoeven JE, Revesz D, Wolkowitz OM, Penninx BW. Cellular aging in depres- sion: permanent imprint or reversible process? An overview of the current evi- dence, mechanistic pathways, and targets for interventions.Bioessays2014;36:
968–978.
2 Klengel T, Binder EB. Gene-environment interactions in major depressive dis- order.Can J Psychiatry2013;58: 76–83.
3 Mahar I, Bambico FR, Mechawar N, Nobrega JN. Stress serotonin, and hippo- campal neurogenesis in relation to depression and antidepressant effects.
Neurosci Biobehav Rev2014;38: 173–192.
4 Yang H, Yang T, Baur JA, Perez E, Matsui T, Carmona JJet al.Nutrient-sensitive mitochondrial NAD+ levels dictate cell survival.Cell2007;130: 1095–1107.
5 Galluzzi L, Kepp O, Trojel-Hansen C, Kroemer G. Mitochondrial control of cellular life, stress, and death.Circ Res2012;111: 1198–1207.
6 DiMauro S, Schon EA. Mitochondrial disorders in the nervous system.Annu Rev Neurosci2008;31: 91–123.
7 Manji H, Kato T, Di Prospero NA, Ness S, Beal MF, Kramset al.Impaired mito- chondrial function in psychiatric disorders.Nat Rev Neurosci2012;13: 293–307.
8 Marazziti D, Baroni S, Picchetti M, Landi P, Silvestri S, Vatteroni Eet al.Psychiatric disorders and mitochondrial dysfunctions.Eur Rev Med Pharmacol Sci2012;16:
270–275.
9 Legido A, Jethva R, Goldenthal MJ. Mitochondrial dysfunction in autism.Semin Pediatr Neurol2013;20: 163–175.
10 Tobe EH. Mitochondrial dysfunction, oxidative stress, and major depressive disorder.Neuropsychiatr Dis Treat2013;9: 567–573.
11 Gohil VM, Sheth SA, Nilsson R, Wojtovich AP, Lee JH, Perocchi Fet al.Nutrient- sensitized screening for drugs that shift energy metabolism from mitochondrial respiration to glycolysis.Nat Biotechnol2010;28: 249–255.
12 Manier DH, Shelton RC, Ellis TC, Peterson CS, Eiring A, Sulser F. Humanfibroblasts as a relevant model to study signal transduction in affective disorders.J Affect Disord2000;61: 51–58.
13 Wang L, Lockstone HE, Guest PC, Levin Y, Palotas A, Pietsch Set al.Expression profiling of fibroblasts identifies cell cycle abnormalities in schizophrenia.J Proteome Res2010;9: 521–527.
14 Gasso P, Mas S, Molina O, Lafuente A, Bernardo M, Parellada E. Increased sus- ceptibility to apoptosis in cultured fibroblasts from antipsychotic-naive first- episode schizophrenia patients.J Psychiatr Res2014;48: 94–101.
Table 2. Experimentally established involvement of the miRNAs from MDD × GAL and MDD × RL signatures in cellular processes (on the basis of PubMed search)
Physiological process miRNA_ID MDD × GAL miRNA
Metabolism miR-33a*, miR-7, miR-296-5p, miR-181a*, miR-497*
Fatty acid metabolism miR-296-5p, miR-193a-3p ×
P53 miR-1208, miR-1285, miR-7
Apoptosis/proliferation miR-548c-5p, miR-7, miR-382, miR-296-5p, miR-181*, miR-193a-3p, miR-1285, miR-32, miR-497*
Migration/c-MET miR-548c-5p, miR-7, miR-296-5p, miR-497*
Neurons/psychiatry miR-7, miR-382, miR-296-5p, miR-32, miR-497*
MDD × RL miRNA
Metabolism miR-33a, miR-7, miR-661, miR-1307, miR-376a, miR-26a, miR-132, miR-25, miR-98, miR-34a, miR-23a, miR-199a/b-3p, miR-296-5p
Fatty acid metabolism miR-3613-3p, miR-33a, miR-192, miR-26a, miR-34a, miR-370, miR-15b, miR-296-5p
P53 miR-34b, miR-16-1*, miR-661, miR-192, miR-7, miR-134, miR-25, miR-98, miR-34a, miR-370, miR-15b, miR-199a/b-3p Apoptosis/proliferation miR-33a, miR-34b, miR-16-1*, miR-661, miR-192, miR-7, miR-376a, miR-382, miR-26a, miR-134, miR-379, let-7g, miR-132,
miR-25, miR-98, miR-34a, miR-370, miR-15b, miR-23a, miR-199a/b-3p, miR-100, miR-296-5p
Migration/c-MET miR-34b, miR-661, miR-550a, miR-7, miR-376a, miR-26a, let-7g, miR-134, miR-132, miR-25,miR-98, miR-34a, miR-100, miR-296-5p
Neurons/psychiatry miR-34b, miR-7, miR-376a, miR-382, miR-26a, miR-134, miR-564, let-7g, miR-132, miR-25, miR-98, miR-34a, miR-370, miR-15b, miR-23a, miR-199a/b-3p, miR-296-5p
Abbreviations: GAL, galactose; MDD, major depressive disorder; miRNA, microRNA; RL, reduced lipid. Metabolism/fatty acid metabolism.36,63,74–94Apoptosis/
proliferation/p53.37,49,54,56,58,95–118
Migration.29,54,98,99,119–131
Neurons/psychiatry.48–51,53,54,56–58,60,61,63–66,68–71,98,132–134
8
15 Korade Z, Xu L, Harrison FE, Ahsen R, Hart SE, Folkes OMet al.Antioxidant supplementation ameliorates molecular deficits in Smith-Lemli-Opitz syndrome.
Biol Psychiatry2013;75: 215–222.
16 Xu L, Korade Z, Rosado DA Jr., Mirnics K, Porter NA. Metabolism of oxysterols derived from nonenzymatic oxidation of 7-dehydrocholesterol in cells.J Lipid Res 2013;54: 1135–1143.
17 Akin D, Manier DH, Sanders-Bush E, Shelton RC. Decreased serotonin 5-HT2A receptor-stimulated phosphoinositide signaling infibroblasts from melancholic depressed patients.Neuropsychopharmacology2004;29: 2081–2087.
18 Gibson SA, Korade Z, Shelton RC. Oxidative stress and glutathione response in tissue cultures from persons with major depression.J Psychiatr Res2012;46:
1326–1332.
19 Kalman S, Garbett KA, Vereczkei A, Shelton RC, Korade Z, Mirnics K. Metabolic stress-induced microRNA and mRNA expression profiles of humanfibroblasts.
Exp Cell Res2013;320: 343–353.
20 Zhan Y, Yang YT, You HM, Cao D, Liu CY, Zhou CJet al.Plasma-based proteomics reveals lipid metabolic and immunoregulatory dysregulation in post-stroke depression.Eur Psychiatry2014;29: 307–315.
21 Karabatsiakis A, Bock C, Salinas-Manrique J, Kolassa S, Calzia E, Dietrich DEet al.
Mitochondrial respiration in peripheral blood mononuclear cells correlates with depressive subsymptoms and severity of major depression.Transl Psychiatry 2014;4: e397.
22 First MB, Pincus HA. The DSM-IV Text Revision: rationale and potential impact on clinical practice.Psychiatr Serv2002;53: 288–292.
23 Irizarry RA, Hobbs B, Collin F, Beazer-Barclay YD, Antonellis KJ, Scherf Uet al.
Exploration, normalization, and summaries of high density oligonucleotide array probe level data.Biostatistics2003;4: 249–264.
24 Kuehn H, Liberzon A, Reich M, Mesirov JP. Using GenePattern for gene expres- sion analysis.Curr Protoc Bioinformatics2008;Chapter 7: Unit 7.12.
25 Subramanian A, Kuehn H, Gould J, Tamayo P, Mesirov JP. GSEA-P: a desktop application for Gene Set Enrichment Analysis. Bioinformatics 2007; 23: 3251–3253.
26 Dumortier O, Hinault C, Van Obberghen E. MicroRNAs and metabolism crosstalk in energy homeostasis.Cell Metab2013;18: 312–324.
27 Jiang P, Du W, Mancuso A, Wellen KE, Yang X. Reciprocal regulation of p53 and malic enzymes modulates metabolism and senescence. Nature 2013; 493: 689–693.
28 Suzuki H, Yamamoto E, Nojima M, Kai M, Yamano HO, Yoshikawa Ket al.
Methylation-associated silencing of microRNA-34b/c in gastric cancer and its involvement in an epigeneticfield defect.Carcinogenesis2010;31: 2066–2073.
29 Kim S, Lee UJ, Kim MN, Lee EJ, Kim JY, Lee MYet al.MicroRNA miR-199a*
regulates the MET proto-oncogene and the downstream extracellular signal- regulated kinase 2 (ERK2).J Biol Chem2008;283: 18158–18166.
30 Shelton RC, Claiborne J, Sidoryk-Wegrzynowicz M, Reddy R, Aschner M, Lewis DA et al.Altered expression of genes involved in inflammation and apoptosis in frontal cortex in major depression.Mol Psychiatry2011;16: 751–762.
31 Manji HK, Drevets WC, Charney DS. The cellular neurobiology of depression.Nat Med2001;7: 541–547.
32 Garbett KA, Vereczkei A, Kalman S, Brown JA, Taylor WD, Faludi Get al.Coor- dinated messenger RNA/MicroRNA changes infibroblasts of patients with major depression.Biol Psychiatry2014;77: 256–265.
33 Baillat D, Hakimi MA, Naar AM, Shilatifard A, Cooch N, Shiekhattar R. Integrator, a multiprotein mediator of small nuclear RNA processing, associates with the C-terminal repeat of RNA polymerase II.Cell2005;123: 265–276.
34 Wang X, Trotman LC, Koppie T, Alimonti A, Chen Z, Gao Zet al.NEDD4-1 is a proto-oncogenic ubiquitin ligase for PTEN.Cell2007;128: 129–139.
35 Xu K, Chen Z, Qin C, Song X. miR-7 inhibits colorectal cancer cell proliferation and induces apoptosis by targeting XRCC2.Onco Targets Ther2014;7: 325–332.
36 Cazanave SC, Mott JL, Elmi NA, Bronk SF, Masuoka HC, Charlton MRet al.A role for miR-296 in the regulation of lipoapoptosis by targeting PUMA.J Lipid Res 2011;52: 1517–1525.
37 Li S, Meng H, Zhou F, Zhai L, Zhang L, Gu Fet al.MicroRNA-132 is frequently down-regulated in ductal carcinoma in situ (DCIS) of breast and acts as a tumor suppressor by inhibiting cell proliferation.Pathol Res Pract2013;209: 179–183.
38 Hibbeln JR, Salem N Jr. Dietary polyunsaturated fatty acids and depression:
when cholesterol does not satisfy.Am J Clin Nutr1995;62: 1–9.
39 Maes M, Christophe A, Delanghe J, Altamura C, Neels H, Meltzer HY. Lowered omega3 polyunsaturated fatty acids in serum phospholipids and cholesteryl esters of depressed patients.Psychiatry Res1999;85: 275–291.
40 Mamalakis G, Tornaritis M, Kafatos A. Depression and adipose essential poly- unsaturated fatty acids. Prostaglandins Leukot Essent Fatty Acids 2002; 67:
311–318.
41 Su KP, Huang SY, Chiu CC, Shen WW. Omega-3 fatty acids in major depressive disorder. A preliminary double-blind, placebo-controlled trial.Eur Neuropsycho- pharmacol2003;13: 267–271.
42 Kaddurah-Daouk R, Bogdanov MB, Wikoff WR, Zhu H, Boyle SH, Churchill Eet al.
Pharmacometabolomic mapping of early biochemical changes induced by ser- traline and placebo.Transl Psychiatry2013;3: e223.
43 Cottrill KA, Chan SY, Loscalzo J. Hypoxamirs and Mitochondrial Metabolism.
Antioxid Redox Signal2013;21: 1189–1201.
44 Nallamshetty S, Chan SY, Loscalzo J. Hypoxia: a master regulator of microRNA biogenesis and activity.Free Radic Biol Med2013;64: 20–30.
45 Liu CR, Miao J, Zhang YL, Liu YM, Yu BG. Effects of hypothyroidism on expression of CRMP2B and ARPC5 during development of the rat frontal cortex.Int J Biol Sci 2013;9: 209–218.
46 Kobayashi H, Fukuda M. Rab35 regulates Arf6 activity through centaurin-beta2 (ACAP2) during neurite outgrowth.J Cell Sci2012;125: 2235–2243.
47 Kahler AK, Djurovic S, Rimol LM, Brown AA, Athanasiu L, Jonsson EGet al.
Candidate gene analysis of the human natural killer-1 carbohydrate pathway and perineuronal nets in schizophrenia: B3GAT2 is associated with disease risk and cortical surface area.Biol Psychiatry2011;69: 90–96.
48 Liu J, Githinji J, McLaughlin B, Wilczek K, Nolta J. Role of miRNAs in neuronal differentiation from human embryonic stem cell-derived neural stem cells.Stem Cell Rev2012;8: 1129–1137.
49 Li B, Sun H. MiR-26a promotes neurite outgrowth by repressing PTEN expression.
Mol Med Rep2013;8: 676–680.
50 Agostini M, Tucci P, Steinert JR, Shalom-Feuerstein R, Rouleau M, Aberdam D et al. microRNA-34a regulates neurite outgrowth, spinal morphology, and function.Proc Natl Acad Sci USA2011;108: 21099–21104.
51 Khudayberdiev S, Fiore R, Schratt G. MicroRNA as modulators of neuronal responses.Commun Integr Biol2009;2: 411–413.
52 Numakawa T, Richards M, Adachi N, Kishi S, Kunugi H, Hashido K. MicroRNA function and neurotrophin BDNF.Neurochem Int2011;59: 551–558.
53 Hancock ML, Preitner N, Quan J, Flanagan JG. MicroRNA-132 is enriched in developing axons, locally regulates Rasa1 mRNA, and promotes axon extension.
J Neurosci2014;34: 66–78.
54 Rodriguez-Aznar E, Barrallo-Gimeno A, Nieto MA. Scratch2 prevents cell cycle re- entry by repressing miR-25 in postmitotic primary neurons.J Neurosci2009;33:
5095–5105.
55 Aranha MM, Santos DM, Sola S, Steer CJ, Rodrigues CM. miR-34a regulates mouse neural stem cell differentiation.PLoS One2011;6: e21396.
56 Yadav S, Pandey A, Shukla A, Talwelkar SS, Kumar A, Pant ABet al.miR-497 and miR-302b regulate ethanol-induced neuronal cell death through BCL2 protein and cyclin D2.J Biol Chem2011;286: 37347–37357.
57 Jovicic A, Roshan R, Moisoi N, Pradervand S, Moser R, Pillai Bet al.Compre- hensive expression analyses of neural cell-type-specific miRNAs identify new determinants of the specification and maintenance of neuronal phenotypes.J Neurosci2013;33: 5127–5137.
58 Pollock A, Bian S, Zhang C, Chen Z, Sun T. Growth of the developing cerebral cortex is controlled by microRNA-7 through the p53 pathway.Cell Rep2014;7:
1184–1196.
59 Qi L, Hongjuan H, Ning G, Zhengbin H, Yanjiang X, Tiebo Zet al.miR-370 is stage-specifically expressed during mouse embryonic development and regulates Dnmt3a.FEBS Lett2013;587: 775–781.
60 Lin ST, Huang Y, Zhang L, Heng MY, Ptacek LJ, Fu YH. MicroRNA-23a promotes myelination in the central nervous system.Proc Natl Acad Sci USA2013;110: 17468–17473.
61 Miller BH, Zeier Z, Xi L, Lanz TA, Deng S, Strathmann Jet al.MicroRNA-132 dysregulation in schizophrenia has implications for both neurodevelopment and adult brain function.Proc Natl Acad Sci USA2012;109: 3125–3130.
62 Santarelli DM, Beveridge NJ, Tooney PA, Cairns MJ. Upregulation of dicer and microRNA expression in the dorsolateral prefrontal cortex Brodmann area 46 in schizophrenia.Biol Psychiatry2011;69: 180–187.
63 Hu YK, Wang X, Li L, Du YH, Ye HT, Li CY. MicroRNA-98 induces an Alzheimer's disease-like disturbance by targeting insulin-like growth factor 1.Neurosci Bull 2013;29: 745–751.
64 Lai CY, Yu SL, Hsieh MH, Chen CH, Chen HY, Wen CCet al.MicroRNA expression aberration as potential peripheral blood biomarkers for schizophrenia.PLoS One 2011;6: e21635.
65 Mor E, Kano S, Colantuoni C, Sawa A, Navon R, Shomron N. MicroRNA-382 expression is elevated in the olfactory neuroepithelium of schizophrenia patients.Neurobiol Dis2013;55: 1–10.
66 Kumar P, Dezso Z, MacKenzie C, Oestreicher J, Agoulnik S, Byrneet al.Circulating miRNA biomarkers for Alzheimer's disease.PLoS One2013;8: e69807.
67 Gaughwin PM, Ciesla M, Lahiri N, Tabrizi SJ, Brundin P, Bjorkqvist M. Hsa-miR-34b is a plasma-stable microRNA that is elevated in pre-manifest Huntington's dis- ease.Hum Mol Genet2011;20: 2225–2237.
68 Minones-Moyano E, Porta S, Escaramis G, Rabionet R, Iraola S, Kagerbauer Bet al.
MicroRNA profiling of Parkinson's disease brains identifies early downregulation
9
of miR-34b/c which modulate mitochondrial function.Hum Mol Genet2011;20: 3067–3078.
69 Zhang R, Zhang Q, Niu J, Lu K, Xie B, Cui D et al.Screening of microRNAs associated with Alzheimer's disease using oxidative stress cell model and dif- ferent strains of senescence accelerated mice.J Neurol Sci2014;338: 57–64.
70 Truettner JS, Katyshev V, Esen-Bilgin N, Dietrich WD, Dore-Duffy P. Hypoxia alters MicroRNA expression in rat cortical pericytes.Microrna2013;2: 32–45.
71 Zucchi FC, Yao Y, Ward ID, Ilnytskyy Y, Olson DM, Benzies Ket al.Maternal stress induces epigenetic signatures of psychiatric and neurological diseases in the offspring.PLoS One2013;8: e56967.
72 Robson JE, Eaton SA, Underhill P, Williams D, Peters J. MicroRNAs 296 and 298 are imprinted and part of the GNAS/Gnas cluster and miR-296 targets IKBKE and Tmed9.RNA2012;18: 135–144.
73 Koido K, Eller T, Kingo K, Koks S, Traks T, Shlik Jet al.Interleukin 10 family gene polymorphisms are not associated with major depressive disorder and panic disorder phenotypes.J Psychiatr Res2010;44: 275–277.
74 Davalos A, Goedeke L, Smibert P, Ramirez CM, Warrier NP, Andreo Uet al.
miR-33a/b contribute to the regulation of fatty acid metabolism and insulin signaling.Proc Natl Acad Sci USA2011;108: 9232–9237.
75 Wang H, Zheng Y, Wang G, Li H. Identification of microRNA and bioinformatics target gene analysis in beef cattle intramuscular fat and subcutaneous fat.Mol Biosyst2013;9: 2154–2162.
76 Gao W, He HW, Wang ZM, Zhao H, Lian XQ, Wang YSet al.Plasma levels of lipometabolism-related miR-122 and miR-370 are increased in patients with hyperlipidemia and associated with coronary artery disease.Lipids Health Dis 2012;11: 55.
77 Zhang Y, Cheng X, Lu Z, Wang J, Chen H, Fan Wet al.Upregulation of miR-15b in NAFLD models and in the serum of patients with fatty liver disease.Diabetes Res Clin Pract2013;99: 327–334.
78 el Azzouzi H, Leptidis S, Dirkx E, Hoeks J, van Bree B, Brand Ket al.The hypoxia- inducible microRNA cluster miR-199a approximately 214 targets myocardial PPARdelta and impairs mitochondrial fatty acid oxidation.Cell Metab2013;18:
341–354.
79 Guo ST, Jiang CC, Wang GP, Li YP, Wang CY, Guo XYet al.MicroRNA-497 targets insulin-like growth factor 1 receptor and has a tumour suppressive role in human colorectal cancer.Oncogene2013;32: 1910–1920.
80 Tekirdag KA, Korkmaz G, Ozturk DG, Agami R, Gozuacik D. MIR181A regulates starvation- and rapamycin-induced autophagy through targeting of ATG5.
Autophagy2013;9: 374–385.
81 Wei Z, Cui L, Mei Z, Liu M, Zhang D. miR-181a mediates metabolic shift in colon cancer cells via the PTEN/AKT pathway.FEBS Lett2014;588: 1773–1779.
82 Meerson A, Traurig M, Ossowski V, Fleming JM, Mullins M, Baier LJ. Human adipose microRNA-221 is upregulated in obesity and affects fat metabolism downstream of leptin and TNF-alpha.Diabetologia2013;56: 1971–1979.
83 Hoffmeister A, Tuennemann J, Sommerer I, Mossner J, Rittger A, Schleinitz D et al.Genetic and biochemical evidence for a functional role of BACE1 in the regulation of insulin mRNA expression. Obesity (Silver Spring) 2013; 21:
E626–E633.
84 Collares CV, Evangelista AF, Xavier DJ, Rassi DM, Arns T, Foss-Freitas MCet al.
Identifying common and specific microRNAs expressed in peripheral blood mononuclear cell of type 1, type 2, and gestational diabetes mellitus patients.
BMC Res Notes2013;6: 491.
85 Zehavi L, Avraham R, Barzilai A, Bar-Ilan D, Navon R, Sidi Yet al.Silencing of a large microRNA cluster on human chromosome 14q32 in melanoma: biological effects of mir-376a and mir-376c on insulin growth factor 1 receptor.Mol Cancer 2012;11: 44.
86 Setyowati Karolina D, Sepramaniam S, Tan HZ, Armugam A, Jeyaseelan K. miR-25 and miR-92a regulate insulin I biosynthesis in rats.RNA Biol2013;10: 1365–1378.
87 Latreille M, Hausser J, Stutzer I, Zhang Q, Hastoy B, Gargani Set al.MicroRNA-7a regulates pancreatic beta cell function.J Clin Invest2014;124: 2722–2735.
88 Kim HR, Roe JS, Lee JE, Cho EJ, Youn HD. p53 regulates glucose metabolism by miR-34a.Biochem Biophys Res Commun2013;437: 225–231.
89 Karbiener M, Pisani DF, Frontini A, Oberreiter LM, Lang E, Vegiopoulos Aet al.
MicroRNA-26 family is required for human adipogenesis and drives character- istics of brown adipocytes.Stem Cells2014;32: 1578–1590.
90 Chen B, Liu Y, Jin X, Lu W, Liu J, Xia Zet al.MicroRNA-26a regulates glucose metabolism by direct targeting PDHX in colorectal cancer cells.BMC Cancer 2014;14: 443.
91 Gil-Zamorano J, Martin R, Daimiel L, Richardson K, Giordano E, Nicod Net al.
Docosahexaenoic acid modulates the enterocyte Caco-2 cell expression of microRNAs involved in lipid metabolism.J Nutr2014;144: 575–585.
92 Sangiao-Alvarellos S, Pena-Bello L, Manfredi-Lozano M, Tena-Sempere M, Cor- dido F. Perturbation of hypothalamic microRNA expression patterns in male rats after metabolic distress: impact of obesity and conditions of negative energy balance.Endocrinology2014;155: 1838–1850.
93 Fu T, Seok S, Choi S, Huang Z, Suino-Powell K, Xu HEet al.MiR-34a inhibits beige and brown fat formation in obesity in part by suppressing adipocyte FGF21 signaling and SIRT1 function.Mol Cell Biol2014;34: 4130–4142.
94 Gao P, Tchernyshyov I, Chang TC, Lee YS, Kita K, Ochi Tet al.c-Myc suppression of miR-23a/b enhances mitochondrial glutaminase expression and glutamine metabolism.Nature2009;458: 762–765.
95 Hoffman Y, Bublik DR, Pilpel Y, Oren M. miR-661 downregulates both Mdm2 and Mdm4 to activate p53.Cell Death Differ2013;21: 302–309.
96 Wang J, He Q, Han C, Gu H, Jin L, Li Qet al.p53-facilitated miR-199a-3p regulates somatic cell reprogramming.Stem Cells2012;30: 1405–1413.
97 Barbagallo D, Piro S, Condorelli AG, Mascali LG, Urbano F, Parrinello Net al.
miR-296-3p, miR-298-5p and their downstream networks are causally involved in the higher resistance of mammalian pancreatic alpha cells to cytokine-induced apoptosis as compared to beta cells.BMC Genomics2013;14: 62.
98 Rokavec M, Li H, Jiang L, Hermeking H. The p53/miR-34 axis in development and disease.J Mol Cell Biol2014;6: 214–230.
99 Fang L, Zhang HB, Li H, Fu Y, Yang GS. miR-548c-5p inhibits proliferation and migration and promotes apoptosis in CD90(+) HepG2 cells.Radiol Oncol2012;
46: 233–241.
100 Seok JK, Lee SH, Kim MJ, Lee YM. MicroRNA-382 induced by HIF-1alpha is an angiogenic miR targeting the tumor suppressor phosphatase and tensin homolog.Nucleic Acids Res2014;42: 8062–8072.
101 Kwon JE, Kim BY, Kwak SY, Bae IH, Han YH. Ionizing radiation-inducible micro- RNA miR-193a-3p induces apoptosis by directly targeting Mcl-1.Apoptosis2013;
18: 896–909.
102 Tian S, Huang S, Wu S, Guo W, Li J, He X. MicroRNA-1285 inhibits the expression of p53 by directly targeting its 3' untranslated region.Biochem Biophys Res Commun2010;396: 435–439.
103 Wu W, Yang J, Feng X, Wang H, Ye S, Yang Pet al.MicroRNA-32 (miR-32) regulates phosphatase and tensin homologue (PTEN) expression and promotes growth, migration, and invasion in colorectal carcinoma cells.Mol Cancer2013;
12: 30.
104 Shi L, Jackstadt R, Siemens H, Li H, Kirchner T, Hermeking H. p53-induced miR-15a/16-1 and AP4 form a double-negative feedback loop to regulate epithelial-mesenchymal transition and metastasis in colorectal cancer.Cancer Res2013;74: 532–542.
105 Song B, Wang Y, Kudo K, Gavin EJ, Xi Y, Ju J. miR-192 regulates dihydrofolate reductase and cellular proliferation through the p53-microRNA circuit. Clin Cancer Res2008;14: 8080–8086.
106 Wang F, Yu J, Yang GH, Wang XS, Zhang JW. Regulation of erythroid differ- entiation by miR-376a and its targets.Cell Res2011;21: 1196–1209.
107 Gentilin E, Tagliati F, Filieri C, Mole D, Minoia M, Rosaria Ambrosioet al.miR-26a plays an important role in cell cycle regulation in ACTH-secreting pituitary adenomas by modulating protein kinase Cdelta. Endocrinology 2013; 154: 1690–1700.
108 Boominathan L. The tumor suppressors p53, p63, and p73 are regulators of microRNA processing complex.PLoS One2010;5: e10615.
109 Khan S, Brougham CL, Ryan J, Sahrudin A, O'Neill G, Wall Det al.miR-379 regulates cyclin B1 expression and is decreased in breast cancer.PLoS One2013;
8: e68753.
110 Zhong Z, Dong Z, Yang L, Chen X, Gong Z. Inhibition of proliferation of human lung cancer cells by green tea catechins is mediated by upregulation of let-7.
Exp Ther Med2012;4: 267–272.
111 Zhang S, Zhang C, Li Y, Wang P, Yue Z, Xie S. miR-98 regulates cisplatin-induced A549 cell death by inhibiting TP53 pathway.Biomed Pharmacother2011;65: 436–442.
112 Tian Y, Zhang YZ, Chen W. MicroRNA-199a-3p and microRNA-34a regulate apoptosis in human osteosarcoma cells.Biosci Rep2014;34: e00132.
113 Cao X, Liu D, Yan X, Zhang Y, Yuan L, Zhang Tet al.Stat3 inhibits WTX expression through up-regulation of microRNA-370 in Wilms tumor.FEBS Lett2013;587:
639–644.
114 Rahman M, Lovat F, Romano G, Calore F, Acunzo M, Bell EHet al.miR-15b/16-2 regulates factors that promote p53 phosphorylation and augments the DNA damage response following radiation in the lung. J Biol Chem 2014; 289: 26406–26416.
115 Ruan W, Xu JM, Li SB, Yuan LQ, Dai RP. Effects of down-regulation of microRNA-23a on TNF-alpha-induced endothelial cell apoptosis through caspase-dependent pathways.Cardiovasc Res2011;93: 623–632.
116 Cirera-Salinas D, Pauta M, Allen RM, Salerno AG, Ramirez CM, Chamorro-Jorganes Aet al.Mir-33 regulates cell proliferation and cell cycle progression.Cell Cycle 2012;11: 922–933.
117 Rippo MR, Olivieri F, Monsurro V, Prattichizzo F, Albertini MC, Procopio AD.
MitomiRs in human inflamm-aging: a hypothesis involving miR-181a, miR-34a and miR-146a.Exp Gerontol2014;56: 154–163.
10
118 Lee YM, Lee JY, Ho CC, Hong QS, Yu SL, Tzeng CRet al.miRNA-34b as a tumor suppressor in estrogen-dependent growth of breast cancer cells.Breast Cancer Res2011;13: R116.
119 Reddy SD, Pakala SB, Ohshiro K, Rayala SK, Kumar R. MicroRNA-661 a c/EBPalpha target, inhibits metastatic tumor antigen 1 and regulates its functions.Cancer Res2009;69: 5639–5642.
120 Choudhury Y, Tay FC, Lam DH, Sandanaraj E, Tang C, Ang BTet al.Attenuated adenosine-to-inosine editing of microRNA-376a* promotes invasiveness of glioblastoma cells.J Clin Invest2012;122: 4059–4076.
121 Huang SD, Yuan Y, Zhuang CW, Li BL, Gong DJ, Wang SGet al.MicroRNA-98 and microRNA-214 post-transcriptionally regulate enhancer of zeste homolog 2 and inhibit migration and invasion in human esophageal squamous cell carcinoma.
Mol Cancer2012;11: 51.
122 Vaira V, Faversani A, Dohi T, Montorsi M, Augello C, Gatti Set al.miR-296 regulation of a cell polarity-cell plasticity module controls tumor progression.
Oncogene2012;31: 27–38.
123 Tian Q, Liang L, Ding J, Zha R, Shi H, Wang Qet al.MicroRNA-550a acts as a pro-metastatic gene and directly targets cytoplasmic polyadenylation element-binding protein 4 in hepatocellular carcinoma. PLoS One 2012; 7: e48958.
124 Jiang DS, Wang YW, Jiang J, Li SM, Liang SZ, Fang HY. MicroRNA-26a involved in Toll-like receptor 9mediated lung cancer growth and migration.Int J Mol Med 2014;34: 307–312.
125 Liu DZ, Ander BP, Tian Y, Stamova B, Jickling GC, Davis RRet al.Integrated analysis of mRNA and microRNA expression in mature neurons, neural pro- genitor cells and neuroblastoma cells.Gene2012;495: 120–127.
126 Menges CW, Kadariya Y, Altomare D, Talarchek J, Neumann-Domer E, Wu Yet al.
Tumor suppressor alterations cooperate to drive aggressive mesotheliomas with enriched cancer stem cells via a p53-miR-34a-c-Met axis.Cancer Res2014;74:
1261–1271.
127 Wang LG, Ni Y, Su BH, Mu XR, Shen HC, Du JJ. MicroRNA-34b functions as a tumor suppressor and acts as a nodal point in the feedback loop with Met.Int J Oncol2013;42: 957–962.
128 Niu CS, Yang Y, Cheng CD. MiR-134 regulates the proliferation and invasion of glioblastoma cells by reducing Nanog expression.Int J Oncol2013;42: 1533–1540.
129 You J, Li Y, Fang N, Liu B, Zu L, Chang Ret al.MiR-132 suppresses the migration and invasion of lung cancer cells via targeting the EMT regulator ZEB2.PLoS One 2014;9: e91827.
130 Feng S, Pan W, Jin Y, Zheng J. MiR-25 promotes ovarian cancer proliferation and motility by targeting LATS2.Tumour Biol2014;35: 12339–12344.
131 Wang M, Ren D, Guo W, Wang Z, Huang S, Du Het al.Loss of miR-100 enhances migration, invasion, epithelial-mesenchymal transition and stemness properties in prostate cancer cells through targeting Argonaute 2.Int J Oncol2014;45:
362–372.
132 Li J, Liu X, Qin S, Guan Y, Liu Y, Cheng Yet al.MicroRNA expression profile and functional analysis reveal that miR-382 is a critical novel gene of alcohol addiction.EMBO Mol Med2013;5: 1402–1414.
133 Ekdahl Y, Farahani HS, Behm M, Lagergren J, Ohman M. A-to-I editing of microRNAs in the mammalian brain increases during development.Genome Res 2012;22: 1477–1487.
134 Gaughwin P, Ciesla M, Yang H, Lim B, Brundin P. Stage-specific modulation of cortical neuronal development by Mmu-miR-134.Cereb Cortex2011;21: 1857–1869.
This work is licensed under a Creative Commons Attribution- NonCommercial-NoDerivs 4.0 International License. The images or other third party material in this article are included in the article’s Creative Commons license, unless indicated otherwise in the credit line; if the material is not included under the Creative Commons license, users will need to obtain permission from the license holder to reproduce the material. To view a copy of this license, visit http://
creativecommons.org/licenses/by-nc-nd/4.0/