Stress-induced changes in the metabolism, gut microbiome and behavior
PhD thesis
Dániel Kuti
Neurosciences (“János Szentágothai”) Doctoral School Semmelweis University
Supervisor: Krisztina Kovács, D.Sc Official reviewers: Barna Vásárhelyi, MD, D.Sc
József Halász, MD, Ph.D
Head of the Final Examination Committee: Árpád Dobolyi, D.Sc
Members of the Final Examination Committee: Attila Patócs, MD, D.Sc Máté Tóth, Ph.D
Budapest
2020
2
Table of Contents
Abbreviations ... 5
1. Introduction ... 8
1.1. Stress in general... 8
1.2. Hypothalamo-pituitary-adrenocortical (HPA) axis ... 9
1.3. Central regulation of food intake and energy metabolism ... 10
1.4. Effect of stress on the metabolic system ... 14
1.5. Effect of stress on gastrointestinal tract (GI)... 16
1.6. Gut brain axis ... 16
1.7. Targeting the microbiome ... 19
2. Aim ... 21
3. Materials and methods... 22
3.1. Animals ... 22
3.2. Stereotaxic surgery ... 22
3.3. Stress procedures ... 22
3.3.1. Acute and repeated stress ... 22
3.3.2. Chronic variable stress (CVS) ... 23
3.3.3. Two-hits stress protocol ... 25
3.4. General procedure in rifaximin experiment ... 26
3.5. Metabolic measurements ... 27
3.6. Behavior tests ... 28
3.6.1. Sucrose consumption test ... 28
3.6.2. Open field test ... 28
3.6.3. Novel environment test ... 28
3.6.4. Elevated plus maze ... 29
3.7. Gut permeability test in vivo ... 29
3.8. Hormone, endotoxin, glucose and triglyceride measurement from plasma ... 29
3.9. Gene expression analysis... 30
3.10. Microbiome analysis ... 31
3.11. Bacterial load in mesenteric lymph node ... 32
3.12. Histological methods ... 33
3.12.1. Perfusion and tissue processing ... 33
3.12.2. Haematoxylin & eosin staining, imaging and quantification ... 33
3.12.3. Immunostaining, imaging and quantification ... 33
3.13. Epidemiological data collection ... 34
3.14. Statistics... 35
3
4. Results ... 36
4.1. Basal metabolic and locomotor activity ... 36
4.2. Acute restraint stress ... 38
4.3. Effects of acute psychological stress on locomotor behaviour and metabolic variables... 39
4.3.1. Locomotor activity ... 39
4.3.2. Cumulative food intake ... 41
4.3.3. Energy expenditure (EE) ... 43
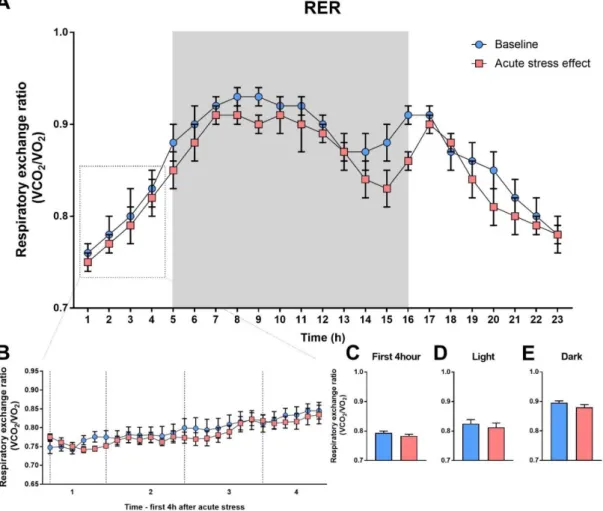
4.3.4. Respiratory exchange ratio (RER) ... 44
4.3.5. Body composition... 45
4.4. Chemogenetic activation of CRHPVN neurons... 45
4.5. Effect of CRHPVN activation on locomotor behavior and metabolism ... 46
4.5.1. Locomotor activity ... 46
4.5.2. Cumulative food intake ... 47
4.5.3. Energy expenditure (EE) ... 48
4.5.4. Respiratory exchange ratio (RER) ... 49
4.5.5. Body composition... 50
4.6. Control experiments ... 51
4.7. Effects of chronic stress ... 52
4.8. Effect of chronic variable stress on metabolism ... 54
4.8.1. Locomotor activity ... 54
4.8.2. Cumulative food intake ... 56
4.8.3. Energy expenditure... 57
4.8.4. Respiratory exchange ratio (RER) ... 58
4.8.5. Body composition... 59
4.9. Effect of chronic stress on gut microbiome and its restoration after rifaximin treatment ... 60
4.10. Effect of rifaximin treatment on chronic stress-induced changes in organ weights, hormones and metabolic markers ... 61
4.11. Effect of rifaximin on chronic stress-induced changes on behavior ... 63
4.11.1. Ethogram ... 63
4.11.2. Open field, EPM, sucrose consumption test... 65
4.12. Effect of MS+CVS and rifaximin treatment on the gut and gut-related immunity ... 67
4.12.1. Colon mucosa, tight junction protein expression and gut permeability ... 67
4.12.2. Gut permeability, macrophage infiltration, local- and systemic bacterial load . 69 4.13. Hypothesis: correlation between Parkinson’s disease prevalence, consumption of certain antibiotics and gut microbial dysbiosis ... 71
4
5. Discussion ... 73
5.1. The effect of acute stress and effect of the activation of CRHPVN on metabolic system ... 73
5.2. Metabolic changes after chronic stress and during recovery ... 76
5.3. Chronic stress effect on colon microbiome and gut ... 79
5.4. Antibiotic effect on gut microbiome ... 81
6. Conclusion ... 84
7. Summary ... 85
8. Összefoglalás ... 86
9. References ... 87
10. Publication of the author ... 106
11. Acknowledgement ... 108
5
Abbreviations
5-HT – Serotonin
AAV – Adeno-associated virus ACC – Anterior cingulate cortex ACTH – Adrenocorticotropic hormone AGRP – Agouti-related peptide
ahCRF – α-helical CRF9–41 AMP – Antimicrobial peptide ARC – Arcuate nucleus AVP – Arginine vasopressin BAT – Brown adipose tissue
BNST – Bed nucleus of stria terminals
CART – Cocaine- and amphetamine-regulated transcript CB1 – Cannabinoid-1 receptor
CCK – Cholecystokinin CNO – Clozapine-N-oxide CORT – corticosterone
CRH-Ires-Cre – Corticotropin releasing hormone-Internal ribosomal entry side-Cre CVS – Chronic variable stress
DMH – Dorsomedial nucleus of the hypothalamus DNA – deoxyribonucleic acid
DREADD – Designer receptor exclusively activated by designer drug ECDC – European Centre for Disease Prevention and Control
EDTA – Ethylenediaminetetraacetic acid EE – Energy expenditure
ENS – Enteric nervous system EPM – Elevated plus maze
ESAC – European Surveillance of Antibiotic Consumption network eWAT – Epididymal white adipose tissue
FITC – Fluorescein isothiocyanate FMT – Fecal microbiota transplant GABA – γ-aminobutyric acid
6
GAPDH – Glyceraldehyde 3-phosphate dehydrogenase GHSR1 – Ghrelin receptor
GIT – Gastrointestinal tract GLP-1 – Glucagon-Like Peptide 1 GR – Glucocorticoid receptor H&E – Hematoxylin & eosin
HPA axis – Hypothalamic-pituitary-adrenal axis IBD – Inflammatory bowel disease
IBS – Irritable bowel syndrome icv – Intracerebroventricular
IDO – Indoleamine 2,3 dioxygenase LAL – Limulus amebocyte lysate (assay) LepR – Leptin receptor
LHA – Lateral hypothalamic area LPS – Lipopolysaccharide
MCH – Melanin-concentrating hormone MD – Minimal disease
MLN – Mesenteric lymph node MR – Mineralocorticoid receptor MRI – Magnetic resonance imaging mRNA – messenger ribonucleic acid MS – Maternal separation
MSH – Melanocyte-stimulating hormone NA – Noradrenaline
NAc – Nucleus accumbens
NCBI – National Center for Biotechnology Information NPY – Neuropeptide Y
NTS – Nucleus of the solitary tract OF – Open field
PBS – Phosphate buffered saline PCR – Polymerase chain reaction.
PD – Parkinson’s disease PFC – Prefrontal cortex
PMv – Premammillary nucleus of the hypothalamus
7 POA – Preoptic area
POMC – Proopiomelanocortin
PVH – Paraventricular nucleus of hypothalamus PVN – Paraventricular nucleus
PYY – Pancreatic Peptide YY3-36
Reg3b – Regenerating islet-derived protein 3-beta RER – Respiratory exchange ratio
Retnlb – Resistin-like beta RIA – Radioimmunoassay SCFA – Short chain fatty acids SCh – Suprachiasmatic nucleus SEM – Standard error of mean
sWAT – Subcutan white adipose tissue TG – Triglyceride
TH – Tyrosine hydroxylase
TJP1-3 – Tight junction protein 1-3 TLR – Toll- like receptor
VMH – Ventromedial nucleus of the hypothalamus vSbc – Venral subiculum
VTA – Ventral tegmental area
Y1,2 and 5 receptors –Y1,2 and 5 receptors of Neuropeptide Y αSyn – α-synuclein
8
1. Introduction
1.1. Stress in general
Each living organism continuously struggle to maintain an internal homeostasis, as it was first defined by Walter Cannon [1]. Homeostasis is an equilibrium condition for many different physiological variables: body temperature, ionic composition and osmolality, pH, and blood glucose level etc. For survival in a continuously changing external and internal environment, these variables should be kept in well-defined range [2]. In 1936, Hans Selye published a paper in Nature entitled “A syndrome produced by diverse nocuous agents” and introduced the stress concept. He wrote: “…if the organism is severely damaged by acute non-specific nocuous agents, a typical syndrome appears, the symptoms of which are independent of the nature of the damaging agent, and represent rather a response to damage as such” [3]. He noticed that the same pathological triad (adrenal gland enlargement, thymus involution, gastrointestinal ulceration) evolves in response to many different stressors (bacterial infection, toxins, physical stimuli) [3]. A few years later, Selye defined the General Adaptation Syndrome, GAS as an “integrated syndrome of closely inter-related adaptive reactions to non-specific stress itself“ [4].
GAS develops in three successive stages: 1. alarm reaction, 2. active resistance, 3.
exhaustion (Fig. 1.) [5].
Figure 1. General adaptation system.
9
Sterling and Eyer were the first, who introduced the expression allostasis, which basically the maintenance of homeostasis through changes. The expended energy for allostasis is the allostatic load [6].
In response to various external and internal stressors catecholamines release from adrenal medulla, induced by the activation of sympathetic nervous system (SNS), and the hypothalamo-pituitary-adrenocortical (HPA) axis became rapidly activated. [7]. In response to the activation of both sympathetic nervous system and HPA, bodily resources are mobilized for fight or flight, including centrally mediated cardiovascular adaptations with increased heart rate and blood pressure and redistribution of blood supply between muscles and skin. During acute stress, respiration is also increased to support increased metabolic demands with oxygen. Increased vigilance, alertness and arousal are also specific features of stress. [8]. From the pathophysiological point of view, it is important to distinguish between acute and chronic stress. Acute stress is a short term challenge, while during chronic stress the body is exposed to stressors for a prolonged time or frequently exposed to various different stressors, chronically [9].
1.2. Hypothalamo-pituitary-adrenocortical (HPA) axis
Different environmental stimuli trigger stress response and activate the neuroendocrine stress axis as a reflex regulation. In first step, corticotropin-releasing hormone (CRH) and vasopressin (AVP) are released from the parvocellular neurons of the hypothalamic paraventricular nucleus (PVN). These hormones are secreted to the hypophyseal portal circulation and trigger adrenocorticotropic hormone (ACTH) release from the adrenocorticotropic cells of anterior pituitary gland. Then, ACTH reaches the adrenal cortex via the blood circulation and stimulates cortisol (in human) and corticosterone (in rodents) release from the zona fasciculata. Corticosteroids act through mineralocorticoid (MR) and glucocorticoid (GR) nuclear receptors [10]. The basal occupancy of MR is around nine fold higher than GR; because affinity of MR is higher (Kd = 0.1–0.5 nM) for corticosterone than that of GR (Kd = 2–5 nM). For this reason, occupancy of GR is increased seven-fold higher during stress, while MRs are alre ady fully occupied even at no stress conditions [11]. Therefore, stress effects occur rather through GR than MR. MR is involved in the appraisal process and the early-phase of stress [10]. Inhibitory feedback by glucocorticoids plays a major role in stress response.
This suppression occurs at several node of the axis, at pituitary, at hypothalamus or
10
extrahypothalamic sites (hippocampus, cortex) and inhibit expression of effector molecules [12].
The neural regulation of HPA axis is originated from different brain regions, which depends on the nature and intensity of stressor. The information of physical and metabolic stressors (hypovolemia, hypoglycaemia) are transported through ascending neurons from the brainstem and spinal cord and these neurons have direct projection to the PVN. These projections originated from the nucleus of the solitary tract (NTS) and C1 and C3 catecholaminergic neurons. Brainstem pathways also interact with other structures such as dorsal raphe and dorsomedial hypothalamic nucleus (DMH) [10].
By contrast, psychogenic stressors require more complex polysynapthic pathways, which include limibic brain regions such as prefrontal cortex (PFC), hippocampus, amygdala and bed nucleus of stria terminals (BNST). PFC projects both inhibitory and stimulatory information to PVN. These inputs are mediated through interconnections with other structures such as hippocampus, ventral subiculum (vSbc) and amygdala. The hippocampus is mainly suppress the activation of HPA axis. The projection of hippocampus reach indirectly the PVN. The projection occurs via vSbc and PFC. These regions innervate the periventricular region that projects glutamatergic and GABAergic neurons to the CRH neurons. There are neuronal innervations as well as from basolateral and medial amygdala to the PVN that potentiate the HPA axis. The central nucleus of amygdala express also CRH and has essential role in the stress induce behavioural responses (especially fear). The BNST is an integrative centre between limbic brain regions and PVN. The projections of BNST innervates the periventricular GABA- and glutamatergic neurons and suppress the inhibiting signals of GABAergic interneurons [10].
1.3. Central regulation of food intake and energy metabolism
In the beginning of this chapter, I would like to clarify few metabolism related concepts for the better understand ability. Orexigen is any substance, which stimulates appetite; by contrast, anorexigen inhibits appetite. Catabolism is the set of metabolic pathways that breaks down molecules into smaller units and anabolism constructs molecules from smaller units.
To govern neuroendocrine autonomic and behvaioral stress responses, hypothalamus is also a key node of metabolic regulation [13]. Arcuate nucleus (ARC), paraventricular
11
nucleus of the hypothalamus (PVH), ventromedial nucleus (VMH) and lateral hypothalamic area (LHA) were described as a key feeding regulatory centers in the hypothalamus [14]. Circulating metabolic-related hormones mediate information to these centers about the energy status from periphery. These hormones bind to specific receptors and can alter the physiology of the receptor containing neurons. Leptin, insulin and ghrelin all target multiple brain neurons involved in energy intake [15-17].
Leptin is secreted by adipocytes and secreted in proportions of adipose depots. The hormone has a key role in the regulation of glucose and lipid metabolism, by suppressing food intake by decreasing meal size rather than meal number [18-20]. In particular, leptin receptor (LepR) expressed in the retrochiasmatic area, arcuate- (ARC), dorsomedial- (DMH), ventral premammillary- (PMv) and ventromedial (VMH) nuclei of the hypothalamus. Elias et al. examined neuronal activation after leptin administration [21].
Leptin-induced c-Fos expression was detected in Lepr-expressing neurons in the hypothalamus and hindbrain [21]. In addition, other studies demonstrated that fos expression was very low in PVH, unlike in ARC and DMH, because of the secondary activation of leptin-dependent pathways [22, 23].In addition, leptin also aim hindbrain and the midbrain ventral tegmental area (VTA) to affect the reward system. Following studies showed that dopamine is an important neurotransmitter in this influence because of the dopaminergic inputs to the nucleus accumbens (NAc) from VTA [24-26]. LepR expressed also in the medial part of the nucleus of the solitary tract (NTS) and expression of leptin activation marker (pSTAT3) was demonstrated in this brain region after leptin injection [27].
Insulin is able to reduce blood glucose concentrations by facilitating glucose uptake into muscle, liver and adipose tissue through insulin dependent glucose transporter protein GLUT4. The hormone is secreted by the β cells of Langerhans islets of pancreas [28]. Insulin enters the brain from blood circulation [29] and reduces food intake there by suppressing neuropeptide Y (NPY) and increases the activation of melanocyte stimulating hormone (α-MSH) neurons in ARC [30]. Insulin also able to alter reward and motivation processes through insulin receptors (IRs) in the limbic system [31, 32]. In addition, insulin reduces the meal size by promoting the effect of cholecystokinin (CCK) [33]. It is also secreted at the proportion of adipose tissue [34]. Insulin receptors (IR) are expressed in different locations of the brain: olfactory bulb, cerebellum, parts of the cortex, hippocampus, choroid plexus, VTA and ARC [35]. However, arcuate nucleus of
12
hypothalamus is in the focus of investigation of insulin’s action in the aspect of metabolic function [36].
Ghrelin is a gastrointestinal (GI) hormone, which induces food intake. It is secreted by the stomach and proximal small intestine [37]. The ghrelin receptor (GHSR1) belongs to the G-protein coupled receptor family and affects adenylate cyclase activity and intracellular Ca2+ channels. GHSR1 expressed in most of the brain regions where IR or LepR are found [17]. Ghrelin also influences glucose homeostasis and reward [37].
Pancreatic Peptide YY3-36 (PYY) and Glucagon-Like Peptide 1 (GLP-1) are secreted by L cells in the distal part of small intestine. Both hormone inhibit food intake but on different ways. PYY binds Y2 receptor in the ARC and regulates energy homeostasis. In contrast, GLP-1 enhances the secretion of insulin but has direct effect on vagal afferents [38-40].
Cholecystokinin (CCK) is synthesized by I cells in the proximal part of intestine. The hormone regulates metabolism via vagal nerve and hindbrain. It has a powerful effect to decrease meal size [41].
Arcuate nucleus ARC harbors two separate neuron population that exert opposite influence on food intake (Fig. 2.). Neuropeptide Y (NPY) and Agouti-related peptide (AgRP) colocalized neurons mediate anabolic effects. These neurons located in the medial portion of ARC and the cells are GABAergic [42]. Intracerebroventricular administration of NPY or direct injection into hypothalamus stimulates food intake and reduce energy metabolism. Consequently, continuous central dosage of NPY leads to obesity [43, 44], however, NPY–KO mice display normal food intake and normal leptin and insulin levels [45]. It is likely that other orexigenic neuropeptides, such as AgRP, orexin or melanin-concentrating hormone (MCH), may compensate the lack of NPY.
Orexin and MCH are expressed in the lateral hypothalamic area and adjust food intake to the arousal state [46, 47]. NPY expressing neurons are key mediators of the orexigenic effect of ghrelin while they are inhibited by leptin and insulin. In addition, NPY/ AgRP neurons project a tonic GABAergic inhibition to the anorexigenic proopiomelanocortin (POMC)/ cocaine- and amphetamine-regulated transcript (CART) neurons [48].
The other major metabolic-related neuron population in the ARC is anorexigenic.
These cells are located in the lateral part of the nucleus and express POMC (alpha- melanocyte-stimulating hormone (MSH) and CART. Neurons in this region are equipped with leptin and insulin receptors and mediate their anorexigenic effect by increasing energy expenditure. [49]. In mice, CART is colocalized with POMC, however, CART is
13
coexpressed rather in orexigenic NPY/AgRP neurons than POMC neurons in human [50].
Besides that, CART is translated with MCH in the lateral hypothalamus in several species [51].
The anorexigenic effect of POMC neurons in ARC projects to PVN, ventromedial nucleus and lateral hypothalamus and reduce food intake with increased energy expenditure (EE) [52]. Similarly, NPY/AgRP neurons of ARC project to the same hypothalamic regions (PVN, VMH, LH) as POMC neurons, however orexigenic neurons of arcuate nucleus send axons also to the dorsomedial nuclei of hypothalamus. In these nuclei (PVN, VMH, LH, DMH), NPY neurons affect on the contrary of POMC food intake and EE via Y1,2 and 5 receptors; while, AgRP alters energy homeostasis as an antagonist of melanocortin 4 receptor (MC4R), thus inhibit the effect of α-MSH [50, 53].
The projected information of arcuate nucleus influences the parvo- and parvicellular neurons of PVN, where different hormones are expressed, such as corticotrophin- releasing hormone (CRH), thyrotrophin-releasing hormone (TRH) and oxytocin, thus regulates different neuroendocrine pathways [54].
Huge number of VMH are glucose-responsive neurons, which mediate the anorexigenic effect of leptin [55]. These neurons are also intervened by POMC neurons of ARC and mediate the effect of leptin-induced anorexia partly to the PVN via brain- derived neurotrophic factor (BDNF) [56].
14
Figure 2. Schematic representation of metabolic regulation in arcuate nuclei of the hypothalamus [57].
The dorsomedial nucleus is received inputs from other hypothalamic areas which are involved in food intake regulation. Furthermore, DMH interconnected with the circadian centre, suprachiasmatic nuclei (SCh) and includes neurons, which express circadian genes, sensitive to the daily schedule [58]. DMH intervenes preoptic area (POA), PVN and LH. Therefore, different studies propose that DMH plays an essential role in the circadian effect of thermoregulation, endocrine function, arousal and food intake [59], however, some studies disagree this hypothesis [58].
1.4. Effect of stress on the metabolic system
Stress is accompanied with increased energy expenditure and metabolic rate to promote coping. Food intake and appetite is inhibited during acute stress, which accompanied with high-energy expenditure. Both major classes of stress mediator
15
hormones, - the glucocorticoids and catecholamines (adrenaline and noradrenaline) - have profound metabolic effects. Epinephrine is synthetized in the adrenal medulla of adrenal gland by the chromaffin cells. These cells have sympathetic innervation and release upon sympathetic stimuli. Epinephrine is rapid mediator of stress response and acts on nearly all body tissues. Stress is accompanied with a rapid elevation of blood glucose, which is regulated by adrenaline. At cellular level, adrenaline phosphorylates enzymes of glycogenolysis in the liver and muscle, which results glycogen conversion to glucose.
Furthermore, adrenaline has an indirect effect on blood glucose level by triggering glucagon release and inhibiting insulin secretion. In the adipose tissues, adrenaline activates lipolysis [60].
Glucocorticoids are steroid hormones, which released from the zona fasciculata of adrenal cortex to the stress-induced activation of HPA axis. Glucocorticoids increase blood glucose level by increasing the synthesis of gluconeogenesis enzymes. The hormone mobilizes also the substrates for gluconeogenesis from other tissues via mobilization of amino acids from extrahepatic tissues and stimulates lipolysis in adipose tissues. In addition, these steroid hormones decrease energy uptake in muscle and adipose tissues to inhibit energy storage [61]. The effects of glucocorticoids are relatively slow, compared to other metabolic hormones like insulin, leptin or catecholamines, because these changes mediated through gene expression rather than direct control of enzymes regulation [62]. In addition, significant level of GRs are localized in different brain regions that influencing metabolic system, such as ARC, VMH and PVH [61].
The permanent presence of stressors seriously affect the resistance of the body, therefore the energy homeostasis may collapse during prolonged chronic stress. Catabolic changes may dominate in response to high level of glucocorticoids. Furthermore, due to the chronically elevated blood glucose level results in increased insulin secretion, which leads to insulin resistance and type2 diabetes on the long run [63]. Besides that, hormone sensitive lipase is continuously activated during chronic stress, which elevates glycerine and fatty acid levels in the blood and these changes accompanied with other metabolic related maladaptive processes like hypertriglyceridemia, non-alcoholic fatty liver disease (NAFLD) or atherosclerosis [64].
The sympathetic nervous system and glucocorticoid hormones act together to alter central metabolic pathways. Sympathetic activation results in suppression of food intake by inhibiting orexigenic NPY action [65]. In addition, α-MSH neurons of ARC potentiate CRH release in PVN. Leptin receptors, which are expressed in PVN, induce CRH
16
expression and results in activation of sympathetic preganglionic neurons projecting the brain stem and spinal cord. Leptin also inhibits NPY neurons in ARC, and activates the ventro- and dorsomedial hypothalamic projection of PVN [66].
1.5. Effect of stress on gastrointestinal tract (GI)
It is well known, that symptoms of different GI disorders worsen in prolonged stress and negative emotions. Activation of HPA axis and sympathoadrenal system alter various physiological functions of GI such as gastric secretion, gut motility, visceral sensitivity, mucosal blood flow, barrier function and triggers different gastrointestinal relevant symptoms like dyspepsia, diarrhoea or abdominal pain. Chronic activation of the stress system can lead to severe GI disorders such as irritable bowel syndrome (IBS) or inflammatory bowel disease (IBD). Enteric nervous system (ENS) plays an essential role in the regulation of gut functions. It has a great impact on motility and secretion of GI neuropeptides and hormones. Strong evidences confirm that, prolonged stress as well as early life stress are able to alter central pain circuitry, influence motility and permeability through GI [67, 68].
In the last decade, emerging studies demonstrated important interaction between the gut microbiome and host. Stress induces a notable shift in the composition of microbiota, with the growth of pathogenic bacteria and this alteration further aggravate the symptoms of GI disorders. For example, norepinephrine enhances the virulence of E. coli or C. jejuni [67, 68]. Infants with altered microbiota composition showed higher level of infant GI symptoms and allergic reactions.
The gut microbiome able to modify the interaction between HPA axis and immune system. Stress increases gut permeability and results in “leaky gut” which underpins chronic low-grade inflammation, due to the elevated plasma level of bacterial lipopolysaccharide (LPS) [69]. CRF, which is also produced within the gut, plays an essential role in the stress-induced gut permeability dysfunction, modulation of inflammation in gut, and contributes to visceral hypersensitivity via CRF receptors. Of note, early life stress causes elevated plasma corticosterone level and results in increased gut permeability and bacterial translocation to spleen and liver [69].
1.6. Gut brain axis
The microbiome is a complex and dynamic mixture of microorganisms, which includes different bacteria, fungi, archaea and viruses [70]. These microbial communities
17
present in different parts of the human body such as the oro-naso-pharyngeal cavity, skin, vagina, gastrointestinal tract etc. These communities interact with host and influence health and disease [71]. The largest proportion of the microbiome is found in the gastrointestinal tract: from the stomach to the colon, bacterial biomass ranges from 102–3 to 1011–1012 cells/ml, among those approximately 95% being anaerobic [70]. The human gut microbiome consists of seven major phyla: Bacteroidetes, Actinobacteria, Cyanobacteria, Fusobacteria, Proteobacteria, and Verrucomicrobia [72]. The microbiome is exposed to different factors, which constantly change the composition of it. These factors include many variables such as birth, breast feeding, diet, stress, aging, drugs (antibiotics) etc. [73-75].
Gut microbiome widely interacts with the host’s metabolic system (Fig.3.). The dietary ingredients can be metabolized differentially and it highly depend on the composition of microbiome. For instance, different bacteria can produce bile acid, short chain fatty acids (SCFA), choline etc. [69, 76]. SCFAs suppress histone deacetylases and able to modify intracellular signalling through their specific receptors that found throughout the body.
For instance, propionic acid mediates advantageous effect on the regulation of body weight and glucose metabolism by influencing FFAR3 receptor containing nerve fibres in hepatic portal vein [77]. Recent studies indicate that microbiome is able to influence enteroendocrine cells in gut. E. coli produced proteins are able to induce secretion of GLP-1 and PYY hormones from enteroendocrine cells that affect food intake [78]. For these reason, microbiome can contribute to the development of different metabolic system-related disorders such as, obesity or diabetes [79, 80].
18
Figure 3. Schematic representation of different pathways of gut brain axis [81].
It is also well documented that a shift in gut microbiome can be associated with gastrointestinal disorders such as inflammatory bowel disease (IBD) and irritable bowel syndrome (IBS). A recent study identified key bacterial species that may be involved in the development of these gastrointestinal diseases and altering the gut microbiota has been proposed as a strategy for the treatment [82].
Growing body of evidence indicates dysbiosis of gut microbiota could contribute or, exaggerate several neuropsychiatric disorders such as anxiety, depression, Alzheimer disease, Parkinson disease, multiple sclerosis, autism etc. [75]. There are many different pathways, through which, microbiome can influence the normal function of brain.
Recently, a number of microbial metabolites (referred to as neuro-active metabolites) produced through tryptophan metabolism have been suggested to influence the gut brain- axis. Interestingly, germ free mice have elevated level of circulating tryptophan beside lower level of 5-HT compared to conventionally colonized mice. Another study indicated that probiotic administration of Lactobacillus decreased the colonic tryptophan degradation by inhibiting indoleamine 2,3 dioxygenase (IDO – rate limiting enzyme of kynurenine pathways) [83]. Besides that, many microbes can metabolize
19
neurometabolites such as GABA, noradrenaline, serotonin, dopamine, acetylcholine, tryptophan that could directly affect brain functions [76]. In addition, gram-negative bacteria induce pro-inflammatory cytokines by their cell wall component, LPS; which stimulates toll- like receptor (TLR) coupled immunological pathways. Inflammatory mediators can also access to the brain. For instance, Campylobacter jejuni infection triggers neuronal activity in the vagal sensory ganglia and in the NTS. The vagus nerve has also an important role in the mediation of gut-brain communication. There are strong evidences, which demonstrate that microbiome is capable to alter the activity of vagal projection. Administration of Lactobacillus reuteri supported wound healing in mice by enhanced oxytocin secretion in hypothalamus, which was eliminated by vagotomy.
Another experiment showed that administration of Lactobacillus rhamnosus induced anxiolytic and antidepressant-like behaviour, however, this effect was attenuated in vagotomized mice [69, 76].
1.7. Targeting the microbiome
As microbiome is a permanently changing community and the effects of microbiome on the host depend on which bacteria colonized the host’s gut. Although the composition of the gut microbiome is relatively constant, it can be targeted by different factors, which provide the basis of microbiota- based therapies. [75]. There are specific dietary supplements through which the microbiome can be targeted. These are the probiotics, prebiotics and synbiotics.
Probiotics are living microorganisms, which provide beneficial effects to the host.
Probiotics should survive the low pH in the stomach, biliary salts and should be able to colonise the gut [69]. The most popular probiotics belong to Lactobacilli and Bifidobaceria, however, yeasts, such as Saccharomyces boulardii are also used in probiotic preparations.
Prebiotics are also a manuipulating factor, which are non-digestible fibres. These fibres are selectively metabolized in the intestinal tract and as a result, promote the proliferation of beneficial bacteria. For example, a Bifidobacterium derived prebiotic (B- GOS) induced bifidogenic effect in microbiome of young volunteers [69].
Parabiotics are non-living, inactivated probiotics, but imitate the beneficial effect of the living microorganism. In the contrary of probiotics, parabiotics have some advantages in safety aspect. For example, the risk of infection, risk of microbial translocation and the
20
possibility of inflammatory responses are lower that may occur in individuals with weak immune system [84].
Postbiotics are water-soluble metabolites, which are metabolized by gut colonising bacteria. Postbiotics includes wide range of metabolites such as enzymes, proteins, peptides, saccharides, organic acid, SCFA etc. It is demonstrated, postbiotics can mimics the effects of probiotics without the risky inherent [84].
Antibiotics is an antimicrobial molecule, which inhibit the growth of bacteria. In case of bacterial infections, antibiotics are the primary agents of pharmacological defence.
They target pathogenic bacteria, however, administration of antibiotics have also harmful effect on commensal bacteria in the gut and result reduced amount of microbiome and microbial diversity [69].
Faecal microbiota transplant (FMT) is a recently used administration. As it implies, FMT is a transplantation of faecal bacteria from healthy donor to a recipient. FMT was applied first in clinical trial against Clostridioides difficile infection and the treatment was highly effective against the infection. In addition, FMT is widely used application against different GI related disorders [85, 86].
21
2. Aim
My first aim was to investigate the effect of stress on the metabolic system. Therefore, I raised the following specific questions:
How an acute restraint stress affects metabolic variables and locomotor behavior?
What is the role of the hypothalamic paraventricular nucleus in the regulation of metabolic- and behavioral changes?
What are the differences between metabolic changes seen in response to acute and chronic stress?
How the metabolic system recovers after repeated stress?
My second main aim was to test the hypothesis, whether rifaximin – non-absorbable antibiotic - restores chronic stress-induced gastrointestinal and inflammatory symptoms and changes in microbiome along with stress-induced changes in anxiety-like behaviour.
Third, we challenged the hypothesis if there is a relation between the systemic antibiotic consumption and the prevalence of Parkinson’s disease.
22
3. Materials and methods
3.1. Animals
All experiments were performed on male mice with C57BL/6J genetic background.
CRH-Ires-Cre transgenic mouse line was used in the virus-injected experiments. Animals were born and housed at the minimal disease (MD) level of Medical Gene Technology Unit at the Institute of Experimental Medicine. Mice were housed in 12 h light/dark cycle (lights on from 6 a.m. to 6 p.m.) at 21–22 °C with humidity. Animals received standard pelleted rodent chow (VRF1, Special Diets Services (SDS), Witham, Essex, UK) containing 19,1 g% protein, 55,3 g% carbohydrate and 4,8 g% fat. Chow and water were provided ad libitum. Experiments were complied with the ARRIVE guidelines and performed in accordance with the guidelines of European Communities Council Directive (86/609 EEC), EU Directive (2010/63/EU) and the Hungarian Act of Animal Care and Experimentation (1998; XXVIII, Sect. 243/1998). All procedures and experiments were approved by the Animal Care and Use Committee of the Institute of Experimental Medicine (permit number: PEI/001/29-4/2013).
3.2. Stereotaxic surgery
CRH-IRES-Cre transgenic mice were anesthetized with a cocktail of 100 mg/kg ketamine and 10 mg/kg xylazine (1 ml/100 g bw, i.p.). Bilateral stereotaxic injection of a virus vector construct (pAAV8/hSyn-DIO-hM3D(Gq)-mCherry, Addgene; 4-7,9 x 10¹²/ml, UNC GTC Vectore Core) was performed into both side of paraventricular nucleus (PVN) (30 nl/side). PVN was approached by a glass cannula at the following coordinates from Bregma: AP:-0,7mm; lat: -0,035mm DV: -0,5mm. After surgery, mice recovered for 3 weeks before the beginning of metabolic measurements. Control animals have been injected with pAAV-hSyn-DIO-mCherry.
3.3. Stress procedures
3.3.1. Acute and repeated stress
Mice were exposed to restraint acute stress for 1h (n=8). For the procedure, 50ml Falcon tubes were used with small holes on side and one at the end for breathing and ventilating. Tubes were filled with paper towel from the opening of tube and closed with own cap to avoid turning around. With this procedure, mice were immobilized without
23
being harmful and provided a stressful event. During the 1h, tubes were stabilized from outside. Experimental design and timeline diagram is shown on figure 4.
Figure 4. Overview of the acute stress experiment.
3.3.2. Chronic variable stress (CVS)
During CVS, experimental animals were stressed for 4 weeks, two times daily, by different psychogenic stressors:
Water avoidance stress (WAS) – The test apparatus was a plastic tank (40 cm length × 40 cm width × 30 cm height) with a fixed glass cylinder (d=8 cm) in the center of the floor. The tank was filled with fresh water to 1 cm below the top of block. The stressed mice were placed on the block for 1 h.
Disturbed circadian rhythm - Mice were exposed to changed or extended light or dark phase.
Social defeat – Experimental mice (intruder) were placed one by one into the home cage of dominant CD1 male mice (aggressor) and they were left there for 8 minutes.
Footshock - Mice were shocked in every 20 sec by 0,5 mA electric shock for 12 minutes.
Forced swim - Mice were forced to swim for 6 min in 18 cm high and 14 cm diameter glass cylinders filled with clean tap water.
Slanted cage – The home cage of experimental mice was tilted to a 45° angle
Soaked bed – The bedding was mixed with water in the home cage
Shaking – The cages of the mice were placed on a shaker for 1 hour. The shaking speed was randomly changed during one hour.
24
Crowding – The moving area of the mice was reduced and the experimental mice were crowded. In case of rifaximin experiment, vehicle and rifaximin treated mice were separately crowded.
Rat feces odour – Feces of male rats was collected and it was placed into a Falcon tube with small holes and the tube was placed into the home cage of the stressed mice.
Daily schedule of the stressors is found in table 1. After CVS procedure, a cohort of experimental animals (n=4/group) were transferred to cages of Phenomaster system for metabolic measurements. Open field test was done with another cohort of mice (n=5- 6/group), then they were sacrificed, blood was collected on EDTA and plasma was stored at -20°C until assays. Adrenal glands were dissected and measured after autopsy.
Experimental design and timeline diagram is shown on figure 5.
Figure 5. Overview of the chronic variable stress experiment.
Chronic variable stress (2x daily); OF: Open field test.
25
Table 1. Daily schedule of the chronic variable stress.
CVS protocol
day a.m. p.m.
1.day water avoidance overnight light
2.day social defeat footshock
3.day forced swimming soaked bedding + slanted cages
4.day crowding + shaking crowding + dark for 18h
5.day restraint isolation
6.day social defeat forced swimming
7.day crowding + shaking soaked bedding + slanted cages
8.day forced swimming footshock
9.day water avoidance overnight light
10.day social defeat footshock
11.day isolation + rat feces odour isolation + rat feces odour + dark for 18h
12.day crowding + shaking crowding + soaked bedding + slanted cages
13.day forced swimming forced swimming
14.day social defeat restraint
15.day rat feces odour + dark for 18h crowding + shaking + overnight light
16.day isolation + rat feces odour footshock
17.day forced swimming crowding + soaked bedding
18.day social defeat (6-10 min) isolation + rat feces odour + dark for 18h
19.day water avoidance footshock
20.day dark for 18h crowding+shaking
21.day crowding + soaked bedding + slanted
cages isolation + rat feces odour
22.day footshock forced swimming
23.day water avoidance overnight light
24.day crowding + shaking isolation + rat feces odour + dark for 18h
25.day social defeat slanted cages + soaked bedding
26.day footshock restraint + shaking
3.3.3. Two-hits stress protocol
This protocol is a frequently used procedure to induce anxiety or depression-like symptoms in experimental animals [87]. It started at postnatal day 1, when pups were separated from their mother (maternal separation MS) for 3 hours daily for 12 days (early life stress - first hit). During the three hours, mothers were placed into separate individual cages and offspring were transferred into a small box, which was placed on a heating pad
26
(30-33°C). Mothers and pups were in two separate rooms. Control litters were not separated and left undisturbed except the change of bedding once a week. Pups were weaned at the 21th day after born and they were housed 2-3/cages. At the age of 50 days, mice were exposed to chronic variable stress paradigm (CVS - second hit). The protocol followed the same CVS schedule, which is written in table 1.
3.4. General procedure in rifaximin experiment
During chronic variable stress, half of the animals received 300 mg/kg bw/day rifaximin, a non-absorbable antibiotic (Sigma). Animals from different litters were randomly assigned to rifaximin/vehicle groups. Rifaximin was dissolved in 5%
hypromellose solution in drinking water. The other half of mice (controls) received 5%
hypromellose to drink. Fluid intake and body weight of the animals was monitored and rifaximin concentration in the drinking water was adjusted. This experiment was performed on two different set of experimental mice. At the end of the experiment behaviour tests were performed on both sets (see below). After last test, one set of mice (n=5-7/groups) was decapitated (30 min after EPM) and trunk blood was collected on EDTA and plasma stored at -20°C. This blood sample was the measure of stress-induced CORT, as it was collected at the time of maximal adrenocortical CORT release provoked by EPM exposure. Adrenal glands and thymus were collected, cleaned and weighed for each mouse. Organ weights were normalized to final body weight and expressed as mg/g bw. Colon, liver, mesenteric lymph node and colon content were harvested and stored at -70°C until assay. The upper intestinal tract has a very low population of bacteria because of different factors like gastric acidity, propulsive motility and pancreatic enzymes. By contrast, the colon has a very stagnant motility with retropulsive contractions keeping the contents in the proximal colon and thus, the largest and “most constant” bacterial ecosystem located in the colon [88]. For this reason, colon tissue and content was used for further analysis. Experimental design and timeline diagram is shown on figure 6. The second set of mice (n=22) were exposed to gut permeability test after the last behavioural test (see below).
27 Figure 6. Overview of the rifaximin experiment.
MS: Maternal separation (3h daily); CVS: Chronic variable stress (2x daily); OF: Open field test; EPM: Elevated plus maze test.
3.5. Metabolic measurements
Experimental mice were singly housed for 1 week before training. Then, the mice were housed in training boxes for 3 days for acclimatization to learn the use of feeders and drinking bottles. On the first day of acclimatization, body composition was measured by magnetic resonance imaging (MRI) scan (EchoMRI). One day long control measurement was performed in metabolic boxes (TSE Phenomaster) in normal circumstances after training (baseline). Then, mice were exposed to 1 h restraint acute stress. In case of virus- injected mice, control measurements were done after a saline injection, while the experimental mice were injected by clozapine-N-oxide (CNO). CNO was dissolved in 0,9
% saline solution (1 mg/ml) and was injected i.p. (dose:1mg/kg body weight). Control virus injected mice were treated by saline or CNO. After inducing stress response, and CNO/saline injections, the metabolic measurement was continued for further 24 hours.
Experimental design and timeline diagram is shown on figure 7.
Chronically stressed mice were placed into metabolic cages and their metabolic changes were measured after the last stress of the CVS protocol for three days. Data of the first day were regarded as stress effect on metabolism and data of the third day were considered as recovery. Food- and O2 consumption, CO2 production and X-Y-Z locomotor activity data were automatically collected during the metabolic measurements.
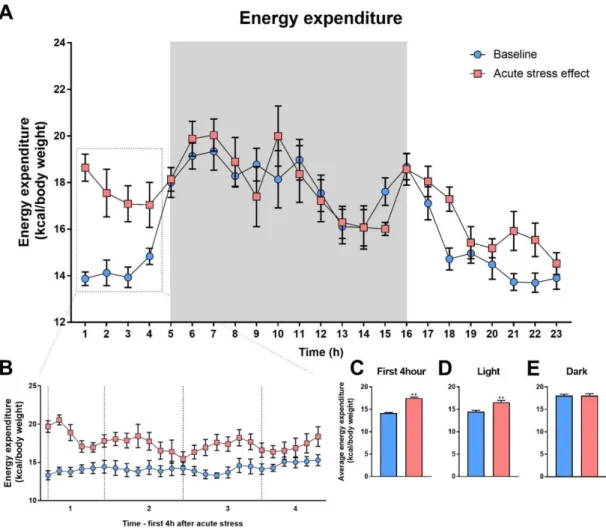
Energy expenditure (EE (kcal/h)) was calculated using a rearrangement of the abbreviated Weir equation as supplied by TSE Labmaster System: EE= (3.941 (VO2) + 1.106 (VCO2)) × 1.44. The respiratory exchange ratio (RER) was calculated also with the
28
following formula: VCO2/VO2. The body composition was determined again at the end of metabolic measurements.
Figure 7. Experimental overview of the CNO induced metabolic measurement.
3.6. Behavior tests
3.6.1. Sucrose consumption test
Sucrose consumption test was performed before the CVS part of two hits protocol and one day after chronic stress. Mice had free choice for 24h between two bottles: one with 1% sucrose solution and the other filled with tap water. The position of the two bottles was switched after 12h. Sucrose and tap water intakes were assessed by weighing bottles.
The sucrose consumption was expressed as a percentage of total liquid intake. As we did not habituate the animals to sucrose, this test measures neophobia rather than sucrose preference [89].
3.6.2. Open field test
In open field test, mice were placed in the center of a 40x40x30cm, white, non- transparent plastic box and their exploration was video-recorded from above for 10 min and then analyzed by Noldus EthoVision XT 10 program. The open field was divided into 16 squares by a 4x4 grid in the software. The four inner squares of the grid were considered as central area.
3.6.3. Novel environment test
The first five minutes of the mouse behavior in the open field arena was analyzed by Solomon Coder software. Four different behavior elements were differentiated in this analysis: walk, survey, rearing and grooming. The analysis was carried out by two individuals blinded to subject treatment group. Walking was noted when the mouse changed its location or turned as long as the front paws moved. Surveying was noted
29
when all paws were on the floor and head directed upwards. Rearing was noted when two hind legs were on the floor and head directed upwards.
3.6.4. Elevated plus maze
The elevated plus maze (arm length-30 cm, arm width-7 cm, wall height-30 cm platform height-80 cm) apparatus was made of dark-grey painted Plexiglas. Open arms were surrounded by 0,3 mm high ledges. Mice were placed into the central area of the platform facing to one of the open arms and were allowed to explore the apparatus for 5 min. Mice were considered to enter a compartment when all four legs crossed the lines separating the compartments. Videos were analyzed by Noldus Observer software.
Percentage of time spent in closed arms was used as a measure anxiety-like behavior.
3.7. Gut permeability test in vivo
To assess gut permeability, four experimental groups were formed: control, vehicle treated; control, rifaximin treated; chronically stressed, vehicle treated and chronically stressed, rifaximin treated mice. The dose of rifaximin was 300 mg/kg, vehicle was 5%
hypromellose) After overnight of fasting, all animals received FITC-labelled 4kDa Dextran (Sigma-Aldrich) via oral gavage (dose: 44 mg/kg; 100 mg/ml). 2 hours later, 250-300 µl blood was collected from heart, centrifuged and serum was collected. Serum samples were diluted with an equal volume of PBS and FITC concentration was measured from 100 µl of diluted serum at excitation 485nm and emission 535nm wavelength using Cytation 5 Cell Imaging Multimode reader (Biotek Instruments). A standard curve was obtained by serial dilution of FITC-dextran solution in PBS (range: 0-16000 ng/ml).
Equal volume of non-hemolytic serum from non- gavaged mice was added to the serial dilution before measurement.
3.8. Hormone, endotoxin, glucose and triglyceride measurement from plasma
Plasma corticosterone was measured from 10µl plasma by direct RIA as described Zelena et al. [90].
30
To determine plasma endotoxin levels, commercially available limulus amebocyte lysate (LAL) assay was used in accordance of the manufacturer’s instructions (Pierce LAL Chromogenic Endotoxin Quantitation Kit, Thermo Scientific).
Plasma glucose level was determined by Glucose Colorimetric Detection Kit from plasma according to the manufacturer’s protocol (Glucose Colorimetric Detection Kit, Invitrogen).
Plasma triglyceride (TG) level was measured by multiparameter diagnostic device for triglycerides (MultiCare-in; Biochemical Systems International Srl).
3.9. Gene expression analysis
Frozen colon tissue samples were homogenized by Bertin Technology Minilys homogenizer in 300 µl TRI reagent. Then, total mRNA was isolated from the homogenate using a Total mRNA Mini Kit (Geneaid) according the manufacturer’s instruction. To eliminate genomic DNA contamination, DNase I (Fermentas) treatment was used.
Sample quality control and the quantitative analysis were carried out by NanoDrop (Thermo Scientific). cDNA synthesis was performed with High Capacity cDNA Reverse Transcription Kit (Applied Biosystems). Real-Time PCR was carried out in ABI StepOnePlus instrument (Applied Biosystems) with Fast EvaGreen quantitative PCR master mix (Biotium) and gene-specific primers. Primers (Microsynth) were designed in our laboratory using Primer-BLAST software of the National Center for Biotechnology Information (NCBI). Forward and reverse primers used to quantify different mRNAs are listed in Table 2. Gene expression was analyzed by the 2-ΔΔCT method using the ABI StepOne Software v2.3 (Applied Biosystems). The amplicons were tested by melt curve analysis on ABI StepOnePlus instrument (Applied Biosystems). Relative changes in gene expression were normalized against GAPDH mRNA expression. Reference gene was selected based on the NormFinder software [91].
31
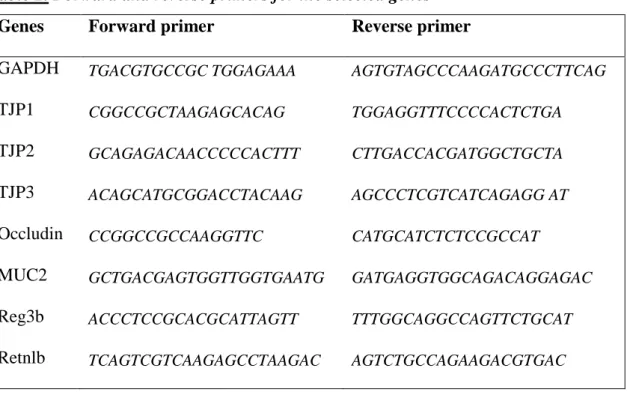
Table 2. Forward and reverse primers for the selected genes Genes Forward primer Reverse primer
GAPDH TGACGTGCCGC TGGAGAAA AGTGTAGCCCAAGATGCCCTTCAG
TJP1 CGGCCGCTAAGAGCACAG TGGAGGTTTCCCCACTCTGA
TJP2 GCAGAGACAACCCCCACTTT CTTGACCACGATGGCTGCTA
TJP3 ACAGCATGCGGACCTACAAG AGCCCTCGTCATCAGAGG AT
Occludin CCGGCCGCCAAGGTTC CATGCATCTCTCCGCCAT
MUC2 GCTGACGAGTGGTTGGTGAATG GATGAGGTGGCAGACAGGAGAC
Reg3b ACCCTCCGCACGCATTAGTT TTTGGCAGGCCAGTTCTGCAT
Retnlb TCAGTCGTCAAGAGCCTAAGAC AGTCTGCCAGAAGACGTGAC
3.10. Microbiome analysis
Total DNA was extracted from 200 mg colon content using QIAamp DNA Stool Mini Kit (Qiagen) according to the manufacturer’s protocol. Total genomic DNA concentration and quality control was checked by using NanoDrop (Thermo Fisher).
Targeting the bacterial 16S ribosomal RNA gene, dominant taxon of the gut microbiome were analyzed by real time quantitative PCR with Fast EvaGreen quantitative PCR master mix (Biotium) and taxon specific primers (Table 3.) on ABI StepOnePlus instrument (Applied Biosystems). In case of Proteobacteria, primer specificity for the phylum could not be confirmed, therefore, different subdivisions of the phylum were determined (Alpha-, Beta-, Epsilon- and Gamma-Proteobacteria). The position of the specific primers in 16S rRNA gene and primer references are found in Table 3. The primer specificity was tested by Melt Curve Analysis. DNA samples were diluted to the same concentration 5ng/µl. Quantification was done by using standard curves made from known concentrations of the respective amplicon for each set of primers. Gene expression was analyzed using ABI StepOne v2.3 program (Applied Biosystems). The results are expressed in copy number (CN) and it was calculated with the following formula: CN = A*6x10²³/(L*660)*1x109 ng/g; where A is the amount of the amplicon in ng, L is the length of the amplicon.
32
Table 3. Forward and reverse primers of the targeted microorganism, the PCR amplicon position in the 16S rRNA gene and the references of primers.
Target organism
Amplicon position in the 16S rRNA gene
Sequence Ref.
Actinobacteria Act920F3 Act1200R
f: TACGGCCGCAAGGCTA
r: TCRTCCCCACCTTCCTCCG [92]
Bacteroidetes Bact934F Bact1060R
f: GGARCATGTGGTTTAATTCGATGAT
r: AGCTGACGACAACCATGCAG [93]
Clostridium sp. Clos58-f Clos780-r
f: AAAGGAAGATTAATACCGCATAA
r: ATCTTGCGACCGTACTCCCC [94]
Cyanobacteria Cya-F783 Cya-R1100
f: GGCAGCAGTGGGGAATTTTC
r: GTMTTACCGCGGCTGCTGG [95]
Firmicutes 928F-Firm 1040FirmR
f: TGAAACTYAAAGGAATTGACG
r: ACCATGCACCACCTGTC [92]
α-proteobacteria A682F 908aR
f: CIAGTGTAGAGGTGAAATT
r: CCCCGTCAATTCCTTTGAGTT [96]
β-proteobacteria Beta680F 1392R
f: CRCGTGTAGCAGTGA
r: ACGGGCGGTGTGTACA [97]
γ-proteobacteria 1080γF γ1202R
f: TCGTCAGCTCGTGTYGTG
r: CGTAAGGGCCATGATG [92]
Verrucomicrobia VER_37F VER_673R
f: TGGCGGCGTGGWTAAGA
r: TGCTACACCGWGAATTC [98]
Total bacteria 331F 797R
f: TCCTACGGGAGGCAGCAGT
r: GACTACCAGGGTATCTAATCCTGTT [99]
3.11. Bacterial load in mesenteric lymph node
Mesenteric lymph nodes (MLN) were aseptically collected and stored at -70°C. Total DNA was isolated from MLN by Tissue Genomic DNA Mini Kit (Geneaid) according to the manufacturer. DNA concentration and quality control was checked by using NanoDrop (Thermo Scientific). Samples were diluted to the same DNA concentration.
Then total DNA was amplified targeting bacterial 16S rRNA gene by using a universal bacterial primer (Table 3.). Amplification was processed by RT-PCR as described in 2.6.
33
3.12. Histological methods
3.12.1. Perfusion and tissue processing
24h after metabolic measurement, restraint stress was repeated on CRH-Ires-Cre x tdTomato transgenic mice. In rAAV8/hsyn-DIO-hM3D(Gq)-mCherry injected mice, a second treatment with CNO was performed. Two hours after the beginning of stress or CNO injection, (at the maximum of cFos expression) mice were anesthetized and perfused with ice cold fixative (4% paraformaldehyde in 0.1 M phosphate buffer pH 7.2) for histology. Chronically stressed mice, which were kept in metabolic cages, were perfused 72h after metabolic measurements. The fixed brain tissue was dissected, post- fixed in the same fixative supplemented with 10% sucrose and incubated overnight in KPBS with sucrose. Then, coronal sections (20 μm) were cut on freezing microtome and stored in cryoprotectant at −20 °C until use.
In case of rifaximin experiment, cleaned colon samples was placed immediately after decapitation into 10% buffered paraformaldehyde (pH=7.4) for 24 h. Fixed tissues were embedded in paraffin and sectioned 5 µm thick sections in two parallel series.
3.12.2. Haematoxylin & eosin staining, imaging and quantification
One series of the two parallel colon sections was deparaffinized and stained with haematoxylin & eosin (H&E) according to a standard protocol. Images of stained colon sections were captured under 20x magnification with Spot RT color digital camera on Nikon Eclipse 6000 microscope. Mucosa thickness was measured by using ImageJ software, in a blinded manner. From each mouse, five sections were randomly selected, from each section, 10 measurements were done and averaged.
3.12.3. Immunostaining, imaging and quantification
To check the place of virus injections and to verify the effect of acute stress, free- floating coronal brain sections were washed three times in KPBS. To avoid nonspecific binding, sections were incubated in 2% normal donkey serum (Jackson ImmunoResearch Laboratories) in PBS/0,3% Triton X100 at room temperature for 1h. Then, sections were incubated in rabbit anti-c-Fos antibody made in rabbit primer (sc-52 Santa Cruz Biotechnology, Santa Cruz, CA, 1:10000) at 4°C for 72h. After 3 times washing, sections were incubated in anti-rabbit Alexa Fluor 488 secondary antibodies produced in donkey (Life technologies 1:1000) for 1hour at room temperature. After incubation, sections were
34
washed again in KPBS and were cover-slipped with DAPI Fluoromount-G (SouthernBiotech). Digital images of hypothalamic paraventricular nucleus (PVN) were captured using Nikon C2+ confocal microscope.
F4/80 (murine macrophage marker) immunostaining was performed on colon samples by an immunohistochemical protocol for paraffin embedded sections. Slides were deparaffinized and rehydrated. Antigen retrieval pre-treatment was performed with proteinase K (Sigma; 10 mg/ml; diluted 1:25 in digestion puffer: 1M Tris and 0,5M EDTA). In this immunostaining, endogenous peroxidase was blocked by 0,3% H2O2. Next, slides were incubated in 2,5% normal rabbit serum then incubated in anti-mouse F4/80 antibody made in rat (BMA Biomedicals, T-2008; 1:50) overnight at 4°C in humidified boxes. After washing, slides were incubated in biotinylated secondary antibody (Vector Laboratories, 1:250) for 1 h. Then, immunoreactivity was visualized with Alexa FluorTM 488 Tyramide SuperBoostTM Kit, according to the manufacturer’s instructions (Invitrogen by Thermo Fisher Scientific). Slides were cover slipped with DAPI Fluoromount-G (SouthernBiotech) and scanned with PannoramicMIDI II Slide Scanner. Images were analyzed with Caseviewer 2.3. software by two different investigators, who were blinded to treatment. For quantitative analysis of the area%
occupied by F4/80 immunoreactivity, ten images from each mouse were randomly selected and re-opened in Image J software. All images were set at a common threshold level and F4/80 positive areas were selected. Background subtraction procedure was performed equally in each image. The entire immunoreactive area fraction was then automatically measured by the program, with the same threshold. Area % was measured separately for submucosa and lamina propria.
3.13. Epidemiological data collection
Antibiotic consumption data, collected between 1997-2009 by the ESAC project (European Surveillance of Antibiotic Consumption network) and data from the ECDC (European Centre for Disease Prevention and Control) database (2010-2017) were used.
Within the penicillin group, consumption data of narrow spectrum penicillins (J01CE) plus penicillinase resistant penicillins (J01CF) and the extended spectrum penicillins (J01CA) plus β lactamase inhibitor combination penicillins (J01CR) were separately compared to PD prevalence change data. Changes in PD prevalence between 1990-2016
35
were obtained from [100]. Correlation was calculated between antimicrobial consumption data and changes in PD prevalence.
3.14. Statistics
All data are shown as means ± SEM. Unpaired or paired two tailed Student’s t-test were used when significant differences was determined between two groups. Statistical analysis was performed by two-way ANOVA (GraphPad Prism 7) followed by Sidak’s multiple comparison test when the mean differences was calculated between groups that have been split on two independent factors. In case of sugar preference, data was analyzed by repeated-measures ANOVA followed by Sidak’s post hoc test. Time was the repeated measure in paired two tailed Student’s t-test and repeated-measures ANOVA. Correlation analysis was performed in our medical hypothesis between antimicrobial consumption and changes in PD prevalence. In all cases, differences were considered statistically significant at p<0.05.
36
4. Results
4.1. Basal metabolic and locomotor activity
Control, basal metabolic measurements were done on intact C57BL/6J mice for 72h.
As seen on Fig. 8, locomotor activity and all metabolic parameters show circadian rhythmicity. Their locomotor activity, food intake, energy expenditure (EE) and respiratory exchange ratio (RER) are higher in the dark phase compared to the light phase (locomotor activity: F(1,3) = 15.47; p = 0.0293; food intake: F(1.3) = 17,68; p = 0.0245;
EE: F(1,3) = 39,94; p = 0.008; RER: F(1,3) = 24.4; p = 0.0159). Two distinct peaks occur in all parameters during the active phase: the first at the beginning of dark phase and the second is before the inactive state.
37 Figure 8. Basal metabolic measurement.
Baseline recordings of locomotor activity, food intake, energy expenditure (EE), respiratory exchange ratio (RER) and average of these activities in the light and dark phases. Data were analyzed by repeated two-way ANOVA (n =4). Time being the repeated measure. Mean ± SEM values, **p < 0.01 vs. control group [101].
38
4.2. Acute restraint stress
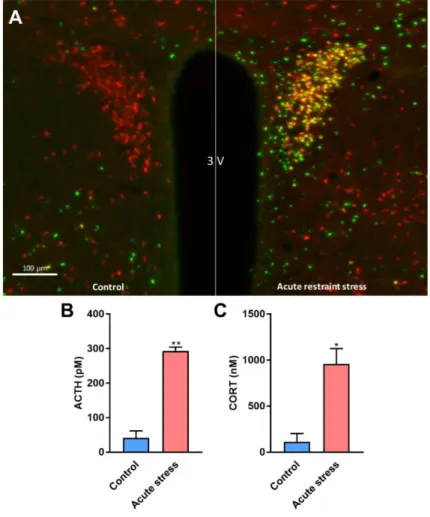
Neuronal activity in the hypothalamus of CRH IRES Cre/TdTomato mice, as assessed by c-Fos immunostaining revealed selective activation of CRH neurons in response to 1h restraint stress. 60,5% of the CRH neurons were c-Fos positive in PVN of stressed mice.
By contrast, CRH (Tomato) and c-Fos colocalization was not observed in the PVN of control, non-stressed mice (Fig. 9A). ACTH and corticosterone plasma levels were significantly increased in stressed mice compared to the controls [ACTH: t = 9.052; DF
= 4; p = 0.0028; corticosterone: t = 4.461; DF = 4; p =0.0112] (Fig. 9B-C).
Figure 9. Effectiveness of acute stress.
Representative images of the hypothalamic paraventricular nucleus (PVN) from control and restrained mice. Red- tdTomato fluorescent protein expression in CRH neurons of CRH-IRES-Cre mice Green- c-Fos immunolabelled cell nuclei. Yellow- Stress-activated CRH neurons. 3V- third ventricle. Scale bar is 100µm (A) [not published] Plasma ACTH level (B) and plasma corticosterone level (C) in control vs. acutely restrained male mice.
[101]. Data were analysed by unpaired t-test (n =3). Mean ± SEM values, *p<0.05,
**p<0.01 vs. control group.
39
4.3. Effects of acute psychological stress on locomotor behaviour and metabolic variables
4.3.1. Locomotor activity
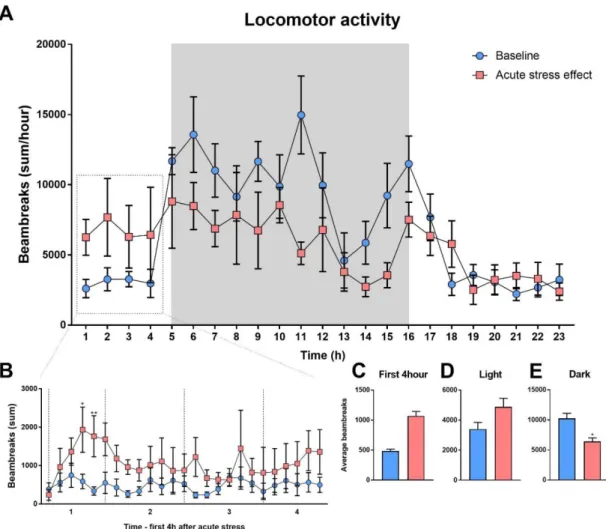
Stressed mice displayed increased locomotor activity in the first hours after acute stress [measurement points during the first hour: 1. point: t = 0.3764; DF = 168; p = >0.9999;
2. point: t = 1.025; DF = 168; p = 0.9999; 3. point: t = 1.582; DF = 168; p = 0.9535; 4.
point: t = 3.464; DF = 168; p = 0.0168; 5. point: t =3.656; DF = 168; p = 0.0085], it reminded elevated in the following three hours (Fig. 10B), however, average of the first four hours were not significantly changed [F(1,7) = 2.446; p = 0.1618] (Fig. 10C). The average locomotor activity was not changed when in the entire light phase was analyzed [F(1,7) = 1.427; p = 0.2712] (Fig. 10D). Nevertheless, locomotor activity of stressed animals was significantly decreased in dark phase compared to the basal measurements [F(1,7) = 6.823; p = 0.0348] (Fig. 10E).
40
Figure 10. Acute stress effect on locomotor activity.
Daily timeline of locomotor activity after acute restraint stress compared to basal measurements (A). The first four (4) hour timeline of locomotor activity after acute stress compared to the basal measurements (B). Average locomotor activity in the first four hour (C), in the light phase (D) and in the dark phase (E) after acute stress. Data were analyzed by repeated measures two-way ANOVA. In case of the first four hours ANOVA was followed by Sidak’s multiple comparison test (n =8). Time and treatment being the repeated measures. Mean ± SEM values, *p<0.05, **p<0.01 vs. control group [not published].
41
4.3.2. Cumulative food intake
Stressed mice consumed more food in the first four hours after acute stress. After the third hour, significant difference was noticed between basal measurement and the measurements after acute stress [measurement points during the fourth hour: 1. point: t = 3.16; DF = 168; p = 0.0457; 2. point: t = 3.917; DF = 168; p = 0.0033; 3. point: t = 4.34;
DF = 168; p = 0.0006; 4. point: t = 3.316; DF = 168; p = 0.0276; 5. point: t = 3.539; DF
= 168; p = 0.0129; 6. point: t = 3.872; DF = 168; p = 0.0038] (Fig. 11B). However, this difference was equalized later and the cumulative food intake was not changed neither in the entire light phase [t = 0.9107; DF = 7; p = 0.3927] (Fig. 11D) nor in the entire dark phase [t = 1.426; DF = 7; p = 0.1969] (Fig. 11E).
42 Figure 11. Effect of acute stress on food intake.
Daily timeline of cumulative food intake after acute restraint stress compared to the basal measurements (A). The first four hour timeline of cumulative food intake after acute stress compared to the basal measurements (B). Average cumulative food intake in the first four hour (C), in the light phase (D) and in the dark phase (E) after acute stress. Difference of cumulative food intake was tested by paired t-test. Time being the repeated measures.
During the first four hours, significance of the continuous changes was analyzed by repeated measures two-way ANOVA followed by Sidak’s multiple comparison test (n=8).
Time and treatment being the repeated measures. Mean ± SEM values, *p<0.05,
**p<0.01, ***p<0.001 vs. control group [not published].
![Figure 2. Schematic representation of metabolic regulation in arcuate nuclei of the hypothalamus [57]](https://thumb-eu.123doks.com/thumbv2/9dokorg/1380437.113816/14.892.130.763.103.653/figure-schematic-representation-metabolic-regulation-arcuate-nuclei-hypothalamus.webp)
![Figure 3. Schematic representation of different pathways of gut brain axis [81].](https://thumb-eu.123doks.com/thumbv2/9dokorg/1380437.113816/18.892.128.766.108.572/figure-schematic-representation-different-pathways-gut-brain-axis.webp)