Krassimira Garbett 1 Biological Psychiatry
BPS-D-13-02168 R2
4/30/2014 10:01 PM
Coordinated mRNA/miRNA changes in fibroblasts of patients with major depression
Krassimira A. Garbett1,$, Andrea Vereczkei1,2,$, Sára Kálmán1,3, Jacquelyn A Brown1, Warren D. Taylor1, Gábor Faludi4, Željka Korade1,6, Richard C. Shelton5 and Károly Mirnics1,3,6,*
1 Department of Psychiatry, Vanderbilt University, Nashville, TN, USA
2 Institute for Medical Chemistry, Molecular Biology and Pathobiochemistry, Semmelweis University, Budapest, Hungary
3 Department of Psychiatry, University of Szeged, Szeged, Hungary
4 Department of Psychiatry, Kútvölgyi Clinical Centre, Semmelweis University, Budapest, Hungary
5 Department of Psychiatry, University of Alabama, Birmingham, AL, USA
6 Vanderbilt Kennedy Center for Research on Human Development, Vanderbilt University, Nashville, TN, USA
Keywords: human fibroblasts, major depression, miRNA, gene expression, DNA microarray, biomarker
Abstract: 235 words
Tables: 2
Figures: 3
Supplementary Materials: 7
Body Text: 4002 words
$ K.A.G and A.V. equally contributed to this study.
*Correspondence: Karoly Mirnics, Department of Psychiatry, Vanderbilt University, 8130A MRB III, 465 21st Avenue South, Nashville TN 37232, USA,
karoly.mirnics@vanderbilt.edu, Office phone: 615-936-1074, http://www.mirnicslab.org
.d ocu -tra ck.co
.d ocu -tra ck.co
Krassimira Garbett 2 ABSTRACT
Background: Peripheral biomarkers for major psychiatric disorders have been an elusive target for the last half a century. Dermal fibroblasts are a simple, relevant, and much underutilized model for studying molecular processes of patients with affective disorders as they share considerable similarity of signal transduction with neuronal tissue.
Methods: Cultured dermal fibroblast samples from patients with Major Depressive Disorder (MDD) and matched controls (CNTR) (n=16 pairs, 32 samples) were assayed for genome wide mRNA expression using microarrays. In addition, a simultaneous qPCR-based assessment of >1,000 miRNA species was performed.
Finally, to test the relationship between the mRNA-miRNA expression changes, the two datasets were correlated with each other.
Results: Our data revealed that MDD fibroblasts, when compared to matched controls, showed a strong mRNA gene expression pattern change in multiple molecular pathways, including cell-to-cell communication, innate/adaptive immunity and cell proliferation. Furthermore, the same patient fibroblasts showed altered expression of a distinct panel of 38 miRNAs, which putatively targeted many of the differentially expressed mRNAs. The miRNA-mRNA expression changes appeared to be functionally connected, as the majority of the miRNA and mRNA changes were in the opposite direction.
.d ocu -tra c .d ocu -tra c
Krassimira Garbett 3 Conclusions: Our data suggest that a combined miRNA-mRNA assessments are informative about the disease process, and that analyses of dermal fibroblasts might lead to the discovery of promising peripheral biomarkers of MDD, which could be potentially used to aid the diagnosis and allow mechanistic testing of disturbed molecular pathways.
.d ocu -tra c .d ocu -tra c
Krassimira Garbett 4 INTRODUCTION:
There has been an intensive search for peripheral biomarkers of major psychiatric disorders for the last half a century. These efforts encompassed gene expression profiling of peripheral mononuclear cells (1, 2), biochemical evaluations of serum (3), urine (4), saliva (5), and cerebrospinal fluid (6), gene association studies of DNA markers (7) and many other approaches. More recently, inducible pluripotent stem cells (IPSCs) emerged as a very promising model for studying neuronal lineage disturbances across various disorders (8-10). Unfortunately, the complex diagnostic- phenotypic-genetic-etiologic heterogeneity continues (11) to provide significant obstacles for identifying highly specific and sensitive peripheral biomarkers of mental disorders.
Transcriptome profiling experiments of postmortem human brain tissue from subjects with major depressive disorder (MDD) suggest evidence of local inflammatory, apoptotic, oxidative stress and multiple other, non-brain specific molecular processes (12-17). Emerging evidence argues that many of these changes might be, at least partially, driven by altered expression of microRNAs (miRNAs): miRNA levels change during stress, in the brain of animal models of depression, and in human postmortem brain of MDD subjects(18) and depressed suicide subjects (19).
Importantly, peripheral biomarker studies of MDD over the last several decades revealed that peripheral growth factors, pro-inflammatory cytokines, endocrine factors, and metabolic markers all contribute to the disease pathophysiology (20). These combined data suggest that MDD is not only a disease of the CNS, but affects the
.d ocu -tra c .d ocu -tra c
Krassimira Garbett 5 whole body (21, 22), and that peripheral cellular-molecular events are strongly correlated with the disease pathology in the CNS (23). Experimental data suggest that analyzing patient dermal fibroblasts is a simple, relevant, and much underutilized model for studying processes of signal transduction in patients with affective disorders (24-26).
Dermal fibroblasts are easy to establish and maintain in culture without transformation, and the majority of confounding factors (e.g. life style or medication use) are virtually eliminated after several rounds of cell division. Furthermore, a recent study of fibroblasts obtained from MDD patients highlights the role that oxidative stress might play in the pathophysiology of MDD (25), which has been already well-established across multiple other research models and patient populations (27, 28). Thus, analyzing dermal fibroblast cultures from patients can give us meaningful insights into the molecular effects of the combined genetic predisposition to the disorder.
It appears that biomarker panels hold a greater promise than single analyte molecules in aiding the diagnosis, monitoring disease progression or therapeutic response in MDD (20). As understanding non-neuronal changes in MDD can be informative of the overall disease pathophysiology (23), we performed a combined mRNA-miRNA profiling of dermal fibroblasts from patients with MDD and matched controls.
.d ocu -tra c .d ocu -tra c
Krassimira Garbett 6 METHODS AND MATERIALS:
Participants in the study
The Study was approved by the Vanderbilt University Institutional Review Board (IRB). Procedures for recruitment and diagnosis have been described previously (24, 25). All participants were diagnosed with a current Major Depressive Episode according to the Structured Clinical Interview for DSM-IV-TR (29) with an exclusion criteria of other primary axis I DSM-IV diagnosis. A written informed consent was obtained from all participants before collecting skin biopsy samples. Sixteen pairs of subjects with Major Depressive Disorder (MDD) and healthy controls (CNTR) were matched by age, race and sex. The average age of the MDD patients and CNTR were comparable (MDD=34.9, CNTR=35.2), as were the sex (12F/4M in both groups) and race (12W/4AA), but there was a significant difference in body mass index at the time of skin biopsy (25.4 in CNTR and 32.3 in MDD, p=0.03) (Supplemental Material 1).
Human dermal fibroblasts
The skin biopsy was obtained from the lateral side of the upper arm (1 x 2 mm) according to a protocol previously described in details (24, 25). The sample was put into regular Dulbecco’s Modified Eagle’s Medium (DMEM, MediaTech, Manassas, VA, USA) without serum and processed the same day. Briefly, biopsy sample was cut into several smaller pieces with scissors and incubated in trypsin and collagenase mix at 37°C for 1 hr. Regular medium was added [DMEM containing high glucose, L-glutamine, 10% fetal bovine serum (FBS, ThermoScientific HyClone, Logan, UT, USA), and Penicillin/Streptomycin solution (MediaTech)] and biopsy pieces with dissociated cells were pelleted by centrifugation. The supernatant was discarded. Biopsy pieces with
.d ocu -tra c .d ocu -tra c
Krassimira Garbett 7 cells were resuspended in fresh regular medium and transferred to 60 mm tissue culture plates. Cells were cultured in incubator at 37°C and 5% CO2 concentration. Medium was changed 3 times a week. In about 2-3 weeks the fibroblasts divided and became confluent. The fibroblasts were subcultured using 0.5% Trypsin-EDTA (Invitrogen) as described elsewhere (30) and expanded for freezing in a liquid nitrogen cell repository or expanded for experiments. Selected fibroblasts from matching patient/control pairs were cultured simultaneously to ensure they grow under the same conditions. Cell growth and proliferation were checked regularly during the whole experiment. All cultured fibroblasts were less than passage 15. At the end of experiment, the fibroblasts were washed 2X with ice-cold PBS, collected with cell scraper, pelleted by centrifugation and frozen on dry ice and stored at -80°C.
mRNA expression analysis by microarrays
Total RNA was isolated using the mirVana™ miRNA Isolation Kit (Ambion, Foster City, CA, USA) and RNA quality assessed by an Agilent 2100 Bioanalyzer (Agilent, Palo Alto, California, USA). cDNA was generated using 2 µg of total RNA.
cDNA synthesis, amplification and labeling were performed using The Enzo Life Sciences Single-Round RNA Amplification and Biotin Labeling System (Enzo Life Sciences, Famingdale, NY, USA). 5 µg of the biotin labeled, fragmented aRNA were hybridized to a GeneChip HT HG-U133+ PM Array Plate (Affymetrix Inc, Santa Clara, CA, USA) at the Vanderbilt Microarray Shared Resource core facility.
Segmented images from each mircoarray were normalized and log2 transformed using GC-robust multi-array analysis (GC-RMA) (31). The normalized expression values were used in all analyses. Average expression values for each group (MDD and CNTR)
.d ocu -tra c .d ocu -tra c
Krassimira Garbett 8 were calculated for each gene probe. The magnitude of expression change was determined by the Average Logarithmic Ratio (ALR=meanMDD - meanCNTR). Student’s paired and grouped two-tailed t-tests were used to test the significance of the difference in gene expression (32-36). A gene was considered to be differentially expressed between MDD and CNTR when it met the dual criteria of |ALR|>0.585 (50%) and both pairwise and groupwise p-values<0.05.
The differentially expressed genes were subjected to a two-way hierarchical clustering analysis based on Pearson correlation using GenePattern software (37).
Gene set enrichment analysis (GSEA) based on pre-defined gene classes were carried out with the GenePattern software (38). GSEA determines whether an a priori defined set of genes shows statistically significant, concordant differences between our subject groups based on the BioCarta defined molecular pathways. GSEA calculates a normalized enrichment score (NES), which reflects the degree to which a gene set is overrepresented in the ranked list of genes and a nominal p-value which estimates the statistical significance of the enrichment score for a single gene set. BioCarta gene sets were considered differentially expressed at nominal p-value <0.05.
mRNA data validation by qPCR
cDNA was generated with random primers using High Capacity cDNA Reverse Transcription Kit (Applied Biosystems, Foster City, CA). Primers for 13 genes (heparin- binding EGF-like growth factor - HBEGF, major histocompatibility complex, class II invariant chain - CD74, major histocompatibility complex, class II, DP alpha 1 – HLA- DPA1, glutathione S-transferase theta 1 - GSTT1, major histocompatibility complex, class II, DR alpha - HLA-DRA, major histocompatibility complex, class II, DQ beta 1 -
.d ocu -tra c .d ocu -tra c
Krassimira Garbett 9 HLA-DQB1, major histocompatibility complex, class II, DP beta 1 - HLA-DPB1, major histocompatibility complex, class II, DQ alpha 1 - HLA-DQA1, interleukin 11 - IL11, Met proto-oncogene - MET, protocadherin 10 - PCDH10, S100 calcium binding protein B - S100B, tumor necrosis factor receptor superfamily, member 19 – TNF19) with efficiency
>85% were used in SYBR Green based PCR reactions. Each sample was tested in 4 technical replicates on an ABI Prism 7300 thermal cycler (Applied Biosystems, Foster City, CA). The cycle threshold (Ct) of the housekeeping gene Glyceraldehyde-3- Phosphate Dehydrogenase (GAPDH) was used for normalization of all samples.
miRNome Arrays and qPCR validation
Small RNAs were isolated using the mirVana™ miRNA Isolation Kit (Ambion, Foster City, CA, USA), and cDNA was prepared from it with miScript II RT Kit (Qiagen, Valencia, CA, USA) using miScript HiSpec Buffer. The individual sample cDNAs were pooled in equal proportions into four groups based on gender and age (Supplemental Material 1). The levels of 1008 miRNAs were assessed with Human miRNome miScript miRNA PCR Array (Qiagen, Valencia, CA, USA) according to the manufacturer`s instructions and as previously described (26). A 30% difference between the average ΔCt for MDD and CNTR (|ΔΔCt|>0.3785) and a group-wise p-value generated by a ttest (p<0.05) were used to determine differential expression for each miRNA.
Custom generated miScript miRNA PCR Arrays (Qiagen, Valencia, CA, USA) were used to assay the level of seven miRNAs: hsa-miR-21, hsa-miR-377, hsa-miR- 193a-3p, hsa-miR-542-3p, hsa-miR-22, hsa-miR-103a, hsa-miR-185. This assessment was performed on all individual samples (MDD n=16; CNTR n=16).
.d ocu -tra c .d ocu -tra c
Krassimira Garbett 10 RESULTS:
mRNA signature in MDD fibroblasts
The experimental design for our study is presented in Supplemental Material 2.
In the first part of the study, cultured fibroblast samples from patients with Major Depressive Disorder (MDD) and matched control (CNTR) subjects (n=16 pairs, 32 individuals) (Supplemental Material 1) were assayed for differential gene expression using GeneChip HT HG-U133 Plus PM 96 Array Plate (Affymetrix Inc, Santa Clara, CA).
We identified 162 differentially expressed gene probes (Supplemental Material 3) that reported > 50% change, and p<0.05 in both pairwise and groupwise assessment. Of the 162 changed gene probes, representing 139 unique known genes, 25 showed increased expression and 114 had decreased levels in MDD, suggesting a predominant loss of function, rather than induction of gene expression in the diseased subjects. A two-way hierarchical clustering (genes × samples) of the expression levels of these gene probes resulted in separation the majority of MDD samples to a distinct class (Supplemental Material 4).
Among the individual genes with the most prominent decrease were protocadherin 10 (PCDH10) (ALR= -1.73, ppval=0.00154, gpval=0.00057), tenascin XB (TNXB) (ALR=-1.30, ppval=0.04545, gpval=0.02515), periplakin (PPL) (ALR=-1.34, ppval=0.00556, gpval=0.02714), and hepatocyte growth factor receptor met (MET) (ALR=-1.21, ppval=0.04474, gpval=0.0012), which are involved in cell-cell communication/adhesion. Of these, due to its known effects on brain development and function, MET attracted particular attention and we decided to assess the expression of genes belonging to the MET intracellular cascade defined by Biocarta in a targeted
.d ocu -tra c .d ocu -tra c
Krassimira Garbett 11 fashion. Overall, from the 37 genes 16 showed a significant difference (Figure 1) including phosphoinositide-3-kinase, regulatory subunit 1 (PIK3R1), hepatocyte growth factor (HGF), GRB2-associated binding protein 1(GAB1), son of sevenless homolog 1 (SOS1), Rap guanine nucleotide exchange factor 1 (RAPGEF1), signal transducer and activator of transcription 3 (STAT3) protein tyrosine phosphatase, non-receptor type 11 (PTPN11), p21/Cdc42/Rac1-activated kinase 1 (PAK1), mitogen-activated protein kinase 1 (MAPK1), v-crk sarcoma virus CT10 oncogene homolog like (CRKL), jun oncogene (JUN), phosphoinositide-3-kinase, catalytic, alpha polypeptide (PTEN), member of RAS oncogene family (RAP1A) mitogen-activated protein kinase kinase 1 (MAP2K1), and v-Ha-ras Harvey rat sarcoma viral oncogene homolog (HRAS).
Furthermore, HGF/MET morphogenic signaling synergizes with v-erb-b2 erythroblastic leukemia viral oncogene homolog 2 (ErbB2) to enhance cell motility (39), and our data also revealed a significant downregulation of ErbB2, further supporting the notion for a deficit in HGF/MET-mediated signaling in MDD fibroblasts.
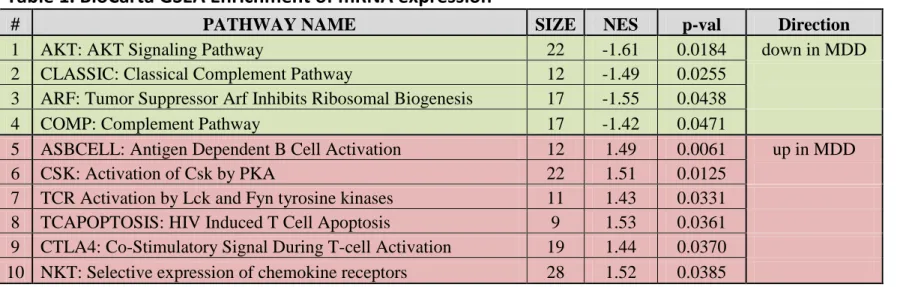
In addition to a targeted MET pathway analysis, we also performed an unbiased pathway enrichment analysis using Gene Set Enrichment Analyses (38). Using this approach, we identified 10 differentially expressed BioCarta gene sets, six of which were upregulated and 4 were downregulated in MDD samples (Table 1). Interestingly, most of these molecular pathways were related to cell-to-cell communication and are known for their role in the adaptive and innate immune system. These pathway analyses argue that the primary gene expression disturbance in the fibroblasts of MDD patients is in the expression of immune response genes, which has been also reported in the postmortem brain tissue of patients with MDD(12).
.d ocu -tra c .d ocu -tra c
Krassimira Garbett 12 qPCR validation of mRNA signature
Fourteen of the differentially expressed mRNA species were selected for further validation by qPCR. The genes for validation were primarily chosen because of their involvement in the immune system response, a process that has been previously implicated in the pathophysiology of the disease. Twelve of fourteen selected transcripts showed similar, significant expression differences between the control and MDD samples by the two methods, with a high degree of correlation between the microarray- reported ALRs and qPCR-obtained ΔΔCts (r=0.84) (Supplemental Material 5), but did not show correlation with body mass index in either dataset. qPCR-reported expression differences between the control and MDD samples were as follows: CD74: ΔΔCt=2.29, p=0.012; HLA-DRA: ΔΔCt =1.61, p=0.017; HLA-DQB1: ΔΔCt=1.31, p=0.018; IL11:
ΔΔCt=1.13, p=0.017; HLA-DPA1: ΔΔCt=1.08, p=0.011; S100B: ΔΔCt=1.05, p=0.031;
HBEGF: ΔΔCt= 1.00, p=0.010; HLA-DPB1: ΔΔCt=0.43, p=0.156; HLA-DQA1: ΔΔCt=0.29, p=0.285; MET: ΔΔCt=-0.42, p=0.043; PCDH10: ΔΔCt=-0.91, p=0.036;
TNF19: ΔΔCt=-1.11, p=0.007 and GSTT1: ΔΔCt=-3.77, p=0.007.
miRNA signature in MDD fibroblasts
miRNAs are important control elements in the fine-tuning of gene expression, and are capable of regulating extensive transcriptional networks (26, 40). Therefore, we further sought to determine if there was a disturbance of miRNA expression profile in MDD fibroblasts. Small RNA species were isolated from each fibroblast culture, cDNA was generated, pooled in 4 groups according to gender and age, and then used to probe Human MirNome arrays, containing assays for 1008 known human miRNAs (26).
We observed that approximately 50% (561) of the tested miRNAs were expressed in
.d ocu -tra c .d ocu -tra c
Krassimira Garbett 13 cultured dermal fibroblasts. We used a dual expression-significance criteria (26) for determining differential miRNA expression (>30% change, p<0.05). We detected 38 miRNAs with distinctly different expression in MDD fibroblasts compared to healthy controls (Supplemental Material 6). Of these, 17 miRNAs reported lower and 21 higher levels in MDD fibroblasts. Using unsupervised two-way hierarchical clustering of expression levels, these 38 miRNAs provided a clear separation basis of the MDD and CNTR samples (Figure 2).
Since the miRNA levels were assayed on 4 pooled sets of samples, we sought to validate the observed differences in individual samples. For this purpose, we created custom qPCR arrays containing assays for 7 differentially expressed miRNAs; hsa-miR- 21*, hsa-miR-377, hsa-miR-193a-3p, hsa-miR-542-3p, hsa-miR-22, hsa-miR-103a, hsa- miR-185. miRNA expression levels for these 7 miRNA species showed an extremely high correlation (R2 = 0.93, p<0.001) between the pooled sample and individual sample assessments, suggesting that the observations made using the combined samples were not an artifact generated by the pooling (Figure 3).
Cross-talk between miRNA and mRNA expression in MDD fibroblasts
Next, we tested if the miRNA signature can explain some of the mRNA signature in MDD fibroblasts. To achieve this, we identified all predicted target genes/mRNAs for each of the 38 miRNAs using miRDB online database for miRNA target prediction and functional annotations (41),(42) and tested if the targeted mRNAs were enriched in the transcriptome profile of MDD fibroblasts (Table 2). 32 out of 38 miRNAs (89%) had at least one target mRNA that was differentially expressed between the MDD and control samples. Furthermore, 51% of the differentially expressed mRNAs were targets of at
.d ocu -tra c .d ocu -tra c
Krassimira Garbett 14 least one of the 38 miRNAs that were differentially expressed in the MDD fibroblasts.
These findings suggest that the miRNA-mRNA expression signatures of MDD fibroblasts are strongly interconnected.
miRNAs are most commonly considered negative regulators of mRNA expression (44, 45), so we hypothesized that the miRNA and their mRNA targets will show expression changes in the opposite direction. Indeed, we found that 28 (76%) of the miRNAs with altered expression had mRNA targets changed in the opposite direction. Acknowledging the fact that different prediction algorithms produce different sets of target genes, we also performed a secondary identification of miRNA targets using TargetScan Release 6.2 (http://www.targetscan.org/) (43). TargetScan identified miRNA targets (Supplemental Material 7) that were somewhat different from the ones identified by miRDB, but strikingly similar in terms of relating the miRNA and the mRNA changes in MDD; 65% (TargetScan) and 76% (MiRDB) of the differentially changed miRNAs had mRNA targets that were changed in the opposite direction. Regardless of these differences, the findings across the two databases suggest a functionally interconnected miRNA-mRNA network disturbance in MDD fibroblasts, where many (if not the majority) of the mRNA changes are miRNA driven. Nevertheless, it remains challenging to establish which specific miRNA species control what individual mRNA transcripts, as 64% of the differentially expressed mRNAs in MDD fibroblasts were hypothetically controlled by more than one miRNA.
.d ocu -tra c .d ocu -tra c
Krassimira Garbett 15 DISCUSSION:
Our data revealed that 1) MDD fibroblasts, when compared to matched controls, show a strong mRNA gene expression difference in molecular networks known to engage in cell-to-cell communication and innate/adaptive immunity; 2) the same patient fibroblasts showed altered expression in a distinct panel of 38 miRNAs, which appeared to target many of the differentially expressed mRNAs; 3) the miRNA-mRNA expression changes appeared to be functionally connected, as the majority of the miRNA and mRNA changes were in the opposite direction.
These findings have conceptual implications for our understanding of MDD pathophysiology. Our findings reinforce the notion that MDD is not only a disease of the brain, but molecular deficiencies in MDD patients are detectable in other peripheral organs (28, 46), including dermal fibroblasts. In addition, it is important to note that the observed mRNA and miRNA changes in the patient fibroblasts are most likely driven by genetic susceptibility to the disease, rather than effects of the environment and lifestyle:
most of the epigenetic changes, environmental influences and drug effects are likely to disappear over time, as the fibroblasts continuously divide in the culture (25, 26).
However, our experiments cannot exclude the possibility that some of the extremely stable, cell-division-resistant epigenetic factors might also contribute to the observed changes (47, 48). In summary, the molecular changes observed in cultured fibroblasts of MDD patients can provide us clues about lifestyle- and medication-independent, conserved disturbances in MDD across the various tissue types.
An unexpected and interesting finding of this study is the strikingly different level of expression of approximately half of the Biocarta defined hepatocyte growth factor
.d ocu -tra c .d ocu -tra c
Krassimira Garbett 16 receptor met (MET) pathway genes. MET is a receptor tyrosine kinase activated by the hepatocyte growth factor (HGF) and affecting cellular signaling pathways involved in control of proliferation, motility, migration and invasion. Although the functions of MET have been primarily studied in the context of cancer (49), MET signaling is also known to be important in brain development (50) and the regulation of immune cells (51).
Importantly, in a recent study HGF was the most highly associated plasma analyte with depressive symptoms (52). Furthermore, the met pathway facilitates adult neurogenesis (53), a process that is significantly impaired in major depression (54).
Immune system disturbances in MDD appear to be an integral part of the disease process (22, 55, 56). The overlap between symptoms of infectious diseases and common affective manifestations (57) suggested a shared pathophysiology between these two systems, which was investigated in a host of follow-up studies. Ultimately, the combined findings lead to the formulation of the inflammatory and neurodegenerative (I&ND) hypothesis of MDD (46), which states that MDD is a consequence of neurodegeneration and reduced neurogenesis that arise from inflammation and cell- mediated immune activation. Today, this view is supported by converging data obtained across different methods and systems. First, postmortem findings identified that MDD patients show a strong dysregulation of immune system pathways in the brain, encompassing altered levels of pro- and anti-inflammatory cytokine expression of IL-1α, IL-2, IL-3, IL-5, IL-8, IL-9, IL-10, IL-12A, IL-13, IL-15, IL-18, IFN-γ and lymphotoxin-α (12). Similarly, altered mRNA levels of immune system genes were found in the neocortex of subjects who committed suicide (58, 59). Second, the immune deficits appear to be systemic in patients with MDD, and that they are readily detectable in the
.d ocu -tra c .d ocu -tra c
Krassimira Garbett 17 peripheral tissues (2). Inflammation and immune system biomarkers of MDD might include C-reactive protein (CRP), cytokines (in particular tumor necrosis factor-α (TNF- α) and interleukin-6 (IL-6)), neopterin and tryptophan catabolites (reviewed by (28)).
Third, while in the most recent genome-wide association study of MDD no SNPs achieved genome-wide significance in the MDD discovery or replication phase (60), candidate gene studies hint that genetic vulnerability in immune system genes might predispose to MDD in a complex pattern (61-64). However, it is also clear that the immune system genes are only partially responsible for the genetic vulnerability of MDD, as a recent pathway analysis found that genetic elements regulating growth and organ development might also represent vulnerability factors (65). Our results are also aligned with this overall view: the disturbance in classic complement pathway, cell-to- cell communication and innate/adaptive immunity suggest an integrated immune system and growth disturbance in the patient population.
Several miRNAs have been already associated with treatment response or an increased risk for major depression (18, 66-68). Recent reports suggest that polymorphism in the miR-30e precursor is associated with major depressive disorder risk (69), and that miRNA expression was significantly and globally down-regulated in prefrontal cortex of depressed suicide subjects (19). In addition, abnormal processing of pre-miR-182 (a circadian clock modulator) was found in major depression patients with insomnia (70). Unfortunately, due to lack of replication, specific experimental design, differences in analyzed tissue and variety of cohorts the data are challenging to interpret and combine into a comprehensive view in a context of MDD. However, it is clear that miRNAs play a pivotal role in a vast variety of MDD-relevant biological processes,
.d ocu -tra c .d ocu -tra c
Krassimira Garbett 18 including synaptic plasticity, neurogenesis, and stress response (for a review, see (18)).
Thus, it is worth pointing out that at least 8 of the 38 differentially expressed miRNAs that we identified in our MDD-fibroblast screen have been previously implicated in either pathophysiology of psychiatric disorders or pathophysiological processes relevant to MDD: 1) miR-32 and miR-22 levels were altered in both our and in a bipolar postmortem dataset (71), 2) miR-22 represses BDNF, serotonin receptor 2C (HTR2C), monoamine oxidase A (MAO-A), and the regulator of G protein signaling (RGS2) (72), 3) miR-196 plays an important regulatory role in schizophrenia (73), 4) miR-132 regulates neurite outgrowth and dendritic morphogenesis (74-76), 5) miR-16 acts as a central effector in 5-HT transporter regulation, mediating the adaptive response of serotonergic and noradrenergic neurons to SSRI antidepressant treatment (77), 6) miR-7 expression is altered in the prefrontal cortex of schizophrenia patients (71), 7) miR-429 is downregulated in response to repeated shocks in a rodent model (78), and 8) miR-107 associated with accelerated disease progression in Alzheimer’s disease through regulation of BACE1 (β-site amyloid precursor protein-cleaving enzyme 1) (79).
Still, in our study, the most promising miRNA candidate for diagnostic biomarker was hsa-miR-122, with a 350% decrease in MDD cases at p<0.00004. Hsa-miR-122 is highly expressed in the hippocampus (80) and has been implicated in regulation of fatty acid metabolism (81, 82) and circadian rhythm (83). Unfortunately, its role in the central nervous system has not been well established, and understanding its function in the brain requires further studies.
In summary, we believe that a combined miRNA-mRNA analysis approach has a potential to uncover reliable, disease-related panels of biomarkers. The mRNA/miRNA
.d ocu -tra c .d ocu -tra c
Krassimira Garbett 19 panel identified in this study represents a promising lead, but it will have to be further validated on a different cohort of patients and across different experimental manipulations. Even through in our data sets we did not observe an association between expression and body mass index recorded at the time of the material harvest, we cannot exclude the possibility that some of the observed mRNA/miRNA changes might be related to confounding factors such as life style.
We wish to emphasize that dermal fibroblasts are an appealing experimental model. First, they are easy to obtain and propagate. Second, they are not genetically modified and/or immortalized, yet, the resource is not easily depleted. Third, due to their division in the cell culture, many confounds and epigenetic changes disappear over time. Fourth, our current and previous data suggests that the miRNA and mRNA expression profiles of the fibroblasts from MDD patients are likely to be related to the changes that occur in the brain (25, 30, 84, 85). Fifth, this model is potentially well- suited for in vitro drug screening. Finally, establishing this patient-derived model requires only minimal technical and financial resources, and is ideally suited for smaller laboratories. In addition, should the need arise in follow-up experiments, patient fibroblasts can be transformed into IPSCs that can be differentiated into neuronal lineages (86).
Acknowledgments:
KM’s work is supported by NIMH grants R01MH067234 and R01 MH079299.
RCS work was supported by NIMH grants MH01741, MH52339, and MH073630, and a grant from the Brain & Behavior Research Foundation. We are especially grateful to
.d ocu -tra c .d ocu -tra c
Krassimira Garbett 20 Weining Xu, Senior Manager at Qiagen, for her invaluable guidance in the use of the miRNome arrays, and the Vantage Molecular Biology Core at Vanderbilt for their help in carrying out the microarray and miRNome array studies.
Financial Disclosures:
KAG, AV, SK, WDT, ZK, GF, JAB and KM have no financial disclosures related to the performed studies. RCS receives unrelated research support from Appian Labs, Assurex, Inc., Cerecor, Inc., Elan, Corp., Euthymics Bioscience, Forest Pharmaceuticals, Janssen Pharmaceutica, Jazz Pharmaceuticals, Naurex, Inc., Novartis Pharmaceuticals, Otsuka Pharmaceuticals, Pamlab, Inc., Pfizer, Inc., Repligen, Corp., Ridge Diagnostics, Shire Plc, St. Jude Medical, Inc., Takeda Pharmaceuticals and consults for Bristol-Myers Squibb Company, Cerecor, Inc., Cyberonics, Inc., Eli Lilly and Company, Forest Pharmaceuticals, Janssen Pharmaceutica, Medtronic, Inc., Otsuka Pharmaceuticals, Pamlab, Inc., Pfizer, Inc., Ridge Diagnostics, Shire Plc, and Takeda Pharmaceuticals.
.d ocu -tra c .d ocu -tra c
Krassimira Garbett 21 TABLES:
Table 1. BioCarta GSEA Enrichment of mRNA expression.
Table 2. Regulated miRNAs in MDD and their target mRNAs.
FIGURE LEGENDS:
Figure 1. mRNA expression of HGF/MET signaling pathway genes is different between the fibroblasts originating from MDD and CNTRL subjects.
Y-axis depicts differentially expressed HGF/MET pathway transcripts as defined by BioCarta/GSEA. X-axis denotes Average Log2 Ratio (ALR) between the MDD and CNTR samples. Bars denote magnitude of change. Note that the vast majority of the genes within this pathway were underexpressed in the MDD fibroblasts.
Figure 2. Clustering of miRNAs that are differentially expressed between the MDD and CNTR samples.
miRNA levels were assessed in 8 pooled samples (4 CNTR + 4 MDD) using miRNome PCR Arrays. 38 miRNAs reported differential expression between fibroblasts from MDD patients and healthy controls. Unsupervised two-way hierarchical clustering of these miRNA expression levels provided a clear separation between the MDD and CNTR samples. Samples were clustered vertically, miRNAs were clustered horizontally.
Each colored square represents a normalized miRNA expression level, color coded for increase (red) or decrease (blue) from the mean. Color intensity is proportional to magnitude of change. The clustering resulted in a separation of the samples into two groups, perfectly matching the two distinct diagnostic categories (vertical dendrogram:
.d ocu -tra c .d ocu -tra c
Krassimira Garbett 22 green - CNTR samples, purple – MDD samples). For more detail, see Supplemental Material 4.
Figure 3. Differential miRNA expression in pooled MDD fibroblast samples validated on individual samples.
The expression levels of 7 miRNAs in pooled samples determined by miRNome arrays were validated on individual samples using custom qPCR arrays (n=32, 16 MDD + 16 CNTR). ΔΔCt from the pooled samples are plotted on the x-axis, ΔΔCts from individual samples are denoted on the y-axis. Individual data points indicate the expression of 7 miRNA species. Note that the two datasets were highly correlated (R2=0.93, p<0.001).
.d ocu -tra c .d ocu -tra c
Krassimira Garbett 23 REFERENCES:
1. Schlaak JF, Trippler M, Hoyo-Becerra C, Erim Y, Kis B, Wang B, et al. (2012): Selective hyper- responsiveness of the interferon system in major depressive disorders and depression induced by interferon therapy. PLoS One. 7:e38668.
2. Hepgul N, Cattaneo A, Zunszain PA, Pariante CM (2013): Depression pathogenesis and treatment: what can we learn from blood mRNA expression? BMC Med. 11:28.
3. Myint AM (2012): Kynurenines: from the perspective of major psychiatric disorders. FEBS J.
279:1375-1385.
4. Chung CP, Schmidt D, Stein CM, Morrow JD, Salomon RM (2012): Increased oxidative stress in patients with depression and its relationship to treatment. Psychiatry Res. 206:213-216.
5. Suri R, Hellemann G, Cohen L, Aquino A, Altshuler L (2008): Saliva estriol levels in women with and without prenatal antidepressant treatment. Biol Psychiatry. 64:533-537.
6. Raedler TJ (2011): Inflammatory mechanisms in major depressive disorder. Curr Opin Psychiatry.
24:519-525.
7. Craddock N, Sklar P (2013): Genetics of bipolar disorder. Lancet. 381:1654-1662.
8. Israel MA, Yuan SH, Bardy C, Reyna SM, Mu Y, Herrera C, et al. (2012): Probing sporadic and familial Alzheimer's disease using induced pluripotent stem cells. Nature. 482:216-220.
9. Hrvoj-Mihic B, Marchetto MC, Gage FH, Semendeferi K, Muotri AR (2013): Novel Tools, Classic Techniques: Evolutionary Studies Using Primate Pluripotent Stem Cells. Biol Psychiatry.
10. Shcheglovitov A, Shcheglovitova O, Yazawa M, Portmann T, Shu R, Sebastiano V, et al. (2013):
SHANK3 and IGF1 restore synaptic deficits in neurons from 22q13 deletion syndrome patients. Nature.
11. Horvath S, Mirnics K (2013): Immune System Disturbances in Schizophrenia. Biol Psychiatry.
12. Shelton RC, Claiborne J, Sidoryk-Wegrzynowicz M, Reddy R, Aschner M, Lewis DA, et al. (2010):
Altered expression of genes involved in inflammation and apoptosis in frontal cortex in major depression. Mol Psychiatry. 16:751-762.
13. Sibille E, Wang Y, Joeyen-Waldorf J, Gaiteri C, Surget A, Oh S, et al. (2009): A molecular signature of depression in the amygdala. Am J Psychiatry. 166:1011-1024.
14. Tochigi M, Iwamoto K, Bundo M, Sasaki T, Kato N, Kato T (2008): Gene expression profiling of major depression and suicide in the prefrontal cortex of postmortem brains. Neurosci Res. 60:184-191.
15. Kang HJ, Adams DH, Simen A, Simen BB, Rajkowska G, Stockmeier CA, et al. (2007): Gene expression profiling in postmortem prefrontal cortex of major depressive disorder. J Neurosci. 27:13329- 13340.
16. Evans SJ, Choudary PV, Neal CR, Li JZ, Vawter MP, Tomita H, et al. (2004): Dysregulation of the fibroblast growth factor system in major depression. Proc Natl Acad Sci U S A. 101:15506-15511.
17. Edgar N, Sibille E (2012): A putative functional role for oligodendrocytes in mood regulation.
Transl Psychiatry. 2:e109.
18. Dwivedi Y (2011): Evidence demonstrating role of microRNAs in the etiopathology of major depression. J Chem Neuroanat. 42:142-156.
19. Smalheiser NR, Lugli G, Rizavi HS, Torvik VI, Turecki G, Dwivedi Y (2012): MicroRNA expression is down-regulated and reorganized in prefrontal cortex of depressed suicide subjects. PLoS One. 7:e33201.
20. Schmidt HD, Shelton RC, Duman RS (2011): Functional biomarkers of depression: diagnosis, treatment, and pathophysiology. Neuropsychopharmacology. 36:2375-2394.
.d ocu -tra c .d ocu -tra c
Krassimira Garbett 24 21. Nemeroff CB, Goldschmidt-Clermont PJ (2012): Heartache and heartbreak--the link between depression and cardiovascular disease. Nat Rev Cardiol. 9:526-539.
22. Miller AH, Maletic V, Raison CL (2009): Inflammation and its discontents: the role of cytokines in the pathophysiology of major depression. Biol Psychiatry. 65:732-741.
23. Belzeaux R, Bergon A, Jeanjean V, Loriod B, Formisano-Treziny C, Verrier L, et al. (2012):
Responder and nonresponder patients exhibit different peripheral transcriptional signatures during major depressive episode. Transl Psychiatry. 2:e185.
24. Manier DH, Shelton RC, Ellis TC, Peterson CS, Eiring A, Sulser F (2000): Human fibroblasts as a relevant model to study signal transduction in affective disorders. J Affect Disord. 61:51-58.
25. Gibson SA, Korade Z, Shelton RC (2012): Oxidative stress and glutathione response in tissue cultures from persons with major depression. J Psychiatr Res. 46:1326-1332.
26. Kalman S, Garbett KA, Vereczkei A, Shelton RC, Korade Z, Mirnics K (2013): Metabolic stress- induced microRNA and mRNA expression profiles of human fibroblasts Exp Cell Res.in press.
27. Scapagnini G, Davinelli S, Drago F, De Lorenzo A, Oriani G (2012): Antioxidants as antidepressants: fact or fiction? CNS Drugs. 26:477-490.
28. Lopresti AL, Maker GL, Hood SD, Drummond PD (2013): A review of peripheral biomarkers in major depression: The potential of inflammatory and oxidative stress biomarkers. Prog
Neuropsychopharmacol Biol Psychiatry. 48C:102-111.
29. First MB, Pincus HA (2002): The DSM-IV Text Revision: rationale and potential impact on clinical practice. Psychiatr Serv. 53:288-292.
30. Akin D, Manier DH, Sanders-Bush E, Shelton RC (2004): Decreased serotonin 5-HT2A receptor- stimulated phosphoinositide signaling in fibroblasts from melancholic depressed patients.
Neuropsychopharmacology. 29:2081-2087.
31. Irizarry RA, Hobbs B, Collin F, Beazer-Barclay YD, Antonellis KJ, Scherf U, et al. (2003):
Exploration, normalization, and summaries of high density oligonucleotide array probe level data.
Biostatistics. 4:249-264.
32. Lazarov O, Robinson J, Tang YP, Hairston IS, Korade-Mirnics Z, Lee VM, et al. (2005):
Environmental enrichment reduces Abeta levels and amyloid deposition in transgenic mice. Cell.
120:701-713.
33. Unger T, Korade Z, Lazarov O, Terrano D, Schor NF, Sisodia SS, et al. (2005): Transcriptome differences between the frontal cortex and hippocampus of wild-type and humanized presenilin-1 transgenic mice. Am J Geriatr Psychiatry. 13:1041-1051.
34. Unger T, Korade Z, Lazarov O, Terrano D, Sisodia SS, Mirnics K (2005): True and false discovery in DNA microarray experiments: transcriptome changes in the hippocampus of presenilin 1 mutant mice.
Methods. 37:261-273.
35. Arion D, Unger T, Lewis DA, Levitt P, Mirnics K (2007): Molecular evidence for increased expression of genes related to immune and chaperone function in the prefrontal cortex in schizophrenia. Biol Psychiatry. 62:711-721.
36. Glorioso C, Sabatini M, Unger T, Hashimoto T, Monteggia LM, Lewis DA, et al. (2006): Specificity and timing of neocortical transcriptome changes in response to BDNF gene ablation during
embryogenesis or adulthood. Mol Psychiatry. 11:633-648.
37. Kuehn H, Liberzon A, Reich M, Mesirov JP (2008): Using GenePattern for gene expression analysis. Curr Protoc Bioinformatics. Chapter 7:Unit 7 12.
38. Subramanian A, Kuehn H, Gould J, Tamayo P, Mesirov JP (2007): GSEA-P: a desktop application for Gene Set Enrichment Analysis. Bioinformatics. 23:3251-3253.
39. Khoury H, Naujokas MA, Zuo D, Sangwan V, Frigault MM, Petkiewicz S, et al. (2005): HGF converts ErbB2/Neu epithelial morphogenesis to cell invasion. Mol Biol Cell. 16:550-561.
.d ocu -tra c .d ocu -tra c
Krassimira Garbett 25 40. O'Carroll D, Schaefer A (2012): General principals of miRNA biogenesis and regulation in the brain. Neuropsychopharmacology. 38:39-54.
41. Wang X, El Naqa IM (2008): Prediction of both conserved and nonconserved microRNA targets in animals. Bioinformatics. 24:325-332.
42. Wang X (2008): miRDB: a microRNA target prediction and functional annotation database with a wiki interface. RNA. 14:1012-1017.
43. Friedman RC, Farh KK, Burge CB, Bartel DP (2009): Most mammalian mRNAs are conserved targets of microRNAs. Genome Res. 19:92-105.
44. Carrington JC, Ambros V (2003): Role of microRNAs in plant and animal development. Science.
301:336-338.
45. Zhang N, Lin JK, Chen J, Liu XF, Liu JL, Luo HS, et al. (2013): MicroRNA 375 mediates the signaling pathway of corticotropin-releasing factor (CRF) regulating pro-opiomelanocortin (POMC) expression by targeting mitogen-activated protein kinase 8. J Biol Chem. 288:10361-10373.
46. Maes M, Yirmyia R, Noraberg J, Brene S, Hibbeln J, Perini G, et al. (2009): The inflammatory &
neurodegenerative (I&ND) hypothesis of depression: leads for future research and new drug developments in depression. Metab Brain Dis. 24:27-53.
47. Hoffmann A, Spengler D (2012): DNA memories of early social life. Neuroscience.
48. Stringer JM, Barrand S, Western P (2013): Fine-tuning evolution: germ-line epigenetics and inheritance. Reproduction. 146:R37-48.
49. Organ SL, Tsao MS (2011): An overview of the c-MET signaling pathway. Ther Adv Med Oncol.
3:S7-S19.
50. Maina F, Klein R (1999): Hepatocyte growth factor, a versatile signal for developing neurons. Nat Neurosci. 2:213-217.
51. van der Voort R, Taher TE, Derksen PW, Spaargaren M, van der Neut R, Pals ST (2000): The hepatocyte growth factor/Met pathway in development, tumorigenesis, and B-cell differentiation. Adv Cancer Res. 79:39-90.
52. Arnold SE, Xie SX, Leung YY, Wang LS, Kling MA, Han X, et al. (2012): Plasma biomarkers of depressive symptoms in older adults. Transl Psychiatry. 2:e65.
53. Nakaguchi K, Jinnou H, Kaneko N, Sawada M, Hikita T, Saitoh S, et al. (2012): Growth factors released from gelatin hydrogel microspheres increase new neurons in the adult mouse brain. Stem Cells Int. 2012:915160.
54. Tanti A, Belzung C (2013): Neurogenesis along the septo-temporal axis of the hippocampus: are depression and the action of antidepressants region-specific? Neuroscience. 252:234-252.
55. Raison CL, Capuron L, Miller AH (2006): Cytokines sing the blues: inflammation and the pathogenesis of depression. Trends Immunol. 27:24-31.
56. Raison CL, Miller AH (2011): Is depression an inflammatory disorder? Curr Psychiatry Rep.
13:467-475.
57. Licinio J, Frost P (2000): The neuroimmune-endocrine axis: pathophysiological implications for the central nervous system cytokines and hypothalamus-pituitary-adrenal hormone dynamics. Braz J Med Biol Res. 33:1141-1148.
58. Pandey GN, Rizavi HS, Ren X, Fareed J, Hoppensteadt DA, Roberts RC, et al. (2011):
Proinflammatory cytokines in the prefrontal cortex of teenage suicide victims. J Psychiatr Res. 46:57-63.
59. Galfalvy H, Zalsman G, Huang YY, Murphy L, Rosoklija G, Dwork AJ, et al. (2011): A pilot genome wide association and gene expression array study of suicide with and without major depression. World J Biol Psychiatry.
60. Ripke S, Wray NR, Lewis CM, Hamilton SP, Weissman MM, Breen G, et al. (2012): A mega- analysis of genome-wide association studies for major depressive disorder. Mol Psychiatry. 18:497-511.
.d ocu -tra c .d ocu -tra c
Krassimira Garbett 26 61. Song GG, Kim JH, Lee YH (2013): Genome-wide pathway analysis in major depressive disorder. J Mol Neurosci. 51:428-436.
62. Jia P, Kao CF, Kuo PH, Zhao Z (2012): A comprehensive network and pathway analysis of candidate genes in major depressive disorder. BMC Syst Biol. 5 Suppl 3:S12.
63. Su S, Miller AH, Snieder H, Bremner JD, Ritchie J, Maisano C, et al. (2009): Common genetic contributions to depressive symptoms and inflammatory markers in middle-aged men: the Twins Heart Study. Psychosom Med. 71:152-158.
64. Wong ML, Dong C, Maestre-Mesa J, Licinio J (2008): Polymorphisms in inflammation-related genes are associated with susceptibility to major depression and antidepressant response. Mol Psychiatry. 13:800-812.
65. Wong ML, Dong C, Andreev V, Arcos-Burgos M, Licinio J (2012): Prediction of susceptibility to major depression by a model of interactions of multiple functional genetic variants and environmental factors. Mol Psychiatry. 17:624-633.
66. Serafini G, Pompili M, Hansen KF, Obrietan K, Dwivedi Y, Shomron N, et al. (2013): The Involvement of MicroRNAs in Major Depression, Suicidal Behavior, and Related Disorders: A Focus on miR-185 and miR-491-3p. Cell Mol Neurobiol.
67. Oved K, Morag A, Pasmanik-Chor M, Oron-Karni V, Shomron N, Rehavi M, et al. (2012): Genome- wide miRNA expression profiling of human lymphoblastoid cell lines identifies tentative SSRI
antidepressant response biomarkers. Pharmacogenomics. 13:1129-1139.
68. Mouillet-Richard S, Baudry A, Launay JM, Kellermann O (2012): MicroRNAs and depression.
Neurobiol Dis. 46:272-278.
69. Xu Y, Liu H, Li F, Sun N, Ren Y, Liu Z, et al. (2010): A polymorphism in the microRNA-30e precursor associated with major depressive disorder risk and P300 waveform. J Affect Disord. 127:332- 336.
70. Saus E, Soria V, Escaramis G, Vivarelli F, Crespo JM, Kagerbauer B, et al. (2010): Genetic variants and abnormal processing of pre-miR-182, a circadian clock modulator, in major depression patients with late insomnia. Hum Mol Genet. 19:4017-4025.
71. Kim AH, Reimers M, Maher B, Williamson V, McMichael O, McClay JL, et al. (2010): MicroRNA expression profiling in the prefrontal cortex of individuals affected with schizophrenia and bipolar disorders. Schizophr Res. 124:183-191.
72. Muinos-Gimeno M, Espinosa-Parrilla Y, Guidi M, Kagerbauer B, Sipila T, Maron E, et al. (2011):
Human microRNAs miR-22, miR-138-2, miR-148a, and miR-488 are associated with panic disorder and regulate several anxiety candidate genes and related pathways. Biol Psychiatry. 69:526-533.
73. Guo AY, Sun J, Jia P, Zhao Z (2010): A novel microRNA and transcription factor mediated regulatory network in schizophrenia. BMC Syst Biol. 4:10.
74. Kawashima H, Numakawa T, Kumamaru E, Adachi N, Mizuno H, Ninomiya M, et al. (2010):
Glucocorticoid attenuates brain-derived neurotrophic factor-dependent upregulation of glutamate receptors via the suppression of microRNA-132 expression. Neuroscience. 165:1301-1311.
75. Vo N, Klein ME, Varlamova O, Keller DM, Yamamoto T, Goodman RH, et al. (2005): A cAMP- response element binding protein-induced microRNA regulates neuronal morphogenesis. Proc Natl Acad Sci U S A. 102:16426-16431.
76. Wayman GA, Davare M, Ando H, Fortin D, Varlamova O, Cheng HY, et al. (2008): An activity- regulated microRNA controls dendritic plasticity by down-regulating p250GAP. Proc Natl Acad Sci U S A.
105:9093-9098.
77. Baudry A, Mouillet-Richard S, Schneider B, Launay JM, Kellermann O (2010): miR-16 targets the serotonin transporter: a new facet for adaptive responses to antidepressants. Science. 329:1537-1541.
.d ocu -tra c .d ocu -tra c
Krassimira Garbett 27 78. Smalheiser NR, Lugli G, Rizavi HS, Zhang H, Torvik VI, Pandey GN, et al. (2011): MicroRNA expression in rat brain exposed to repeated inescapable shock: differential alterations in learned helplessness vs. non-learned helplessness. Int J Neuropsychopharmacol. 14:1315-1325.
79. Wang WX, Rajeev BW, Stromberg AJ, Ren N, Tang G, Huang Q, et al. (2008): The expression of microRNA miR-107 decreases early in Alzheimer's disease and may accelerate disease progression through regulation of beta-site amyloid precursor protein-cleaving enzyme 1. J Neurosci. 28:1213-1223.
80. Deng X, Zhong Y, Gu L, Shen W, Guo J (2013): MiR-21 involve in ERK-mediated upregulation of MMP9 in the rat hippocampus following cerebral ischemia. Brain Res Bull. 94:56-62.
81. Lagos-Quintana M, Rauhut R, Yalcin A, Meyer J, Lendeckel W, Tuschl T (2002): Identification of tissue-specific microRNAs from mouse. Curr Biol. 12:735-739.
82. Lynn FC (2009): Meta-regulation: microRNA regulation of glucose and lipid metabolism. Trends Endocrinol Metab. 20:452-459.
83. Gatfield D, Le Martelot G, Vejnar CE, Gerlach D, Schaad O, Fleury-Olela F, et al. (2009):
Integration of microRNA miR-122 in hepatic circadian gene expression. Genes Dev. 23:1313-1326.
84. Akin D, Manier DH, Sanders-Bush E, Shelton RC (2005): Signal transduction abnormalities in melancholic depression. Int J Neuropsychopharmacol. 8:5-16.
85. Shelton RC, Mainer DH, Sulser F (1996): cAMP-dependent protein kinase activity in major depression. Am J Psychiatry. 153:1037-1042.
86. Fink KD, Crane AT, Leveque X, Dues DJ, Huffman LD, Moore AC, et al. (2014): Intrastriatal
Transplantation of Adenovirus-Generated Induced Pluripotent Stem Cells for Treating Neuropathological and Functional Deficits in a Rodent Model of Huntington's Disease. Stem Cells Transl Med.
.d ocu -tra c .d ocu -tra c
Table 1. BioCarta GSEA Enrichment of mRNA expression
# PATHWAY NAME SIZE NES p-val Direction
1 AKT: AKT Signaling Pathway 22 -1.61 0.0184 down in MDD
2 CLASSIC: Classical Complement Pathway 12 -1.49 0.0255
3 ARF: Tumor Suppressor Arf Inhibits Ribosomal Biogenesis 17 -1.55 0.0438
4 COMP: Complement Pathway 17 -1.42 0.0471
5 ASBCELL: Antigen Dependent B Cell Activation 12 1.49 0.0061 up in MDD
6 CSK: Activation of Csk by PKA 22 1.51 0.0125
7 TCR Activation by Lck and Fyn tyrosine kinases 11 1.43 0.0331 8 TCAPOPTOSIS: HIV Induced T Cell Apoptosis 9 1.53 0.0361 9 CTLA4: Co-Stimulatory Signal During T-cell Activation 19 1.44 0.0370 10 NKT: Selective expression of chemokine receptors 28 1.52 0.0385
.d ocu -tra ck.co
.d ocu -tra ck.co
LEGEND: Red - upregulated mRNAs in MDD; Green - downregulated mRNAs in MDD; Bold symbols - regulated by multiple miRNAs
miRNA ID ΔΔCt p- value
mRNA targets
mRNA up
in MDD mRNA down in MDD mRNAs
up
mRNAs down
hsa-miR-122 2.17 0.0000 157 --- OCLN, MASP1, KCNJ2 0 3
hsa-miR-32 2.01 0.0214 431 BCL11A LSAMP, CHM, KLF4, SVIP,
SSFA2, XPNPEP3, FNIP1, AFF1 1 8
hsa-miR-196b* 1.96 0.0281 16 --- --- 0 0
hsa-miR-377 1.62 0.0104 145 --- PTGFR 0 1
hsa-miR-193a-
3p 1.52 0.0176 181 HLA-
DPB1 DNAJC13, KCNJ2 1 2
hsa-miR-337-5p 1.52 0.0043 27 --- ERAP1 0 1
hsa-miR-675* 1.46 0.0065 185 --- --- 0 0
hsa-miR-3176 1.39 0.0172 228 RUFY2 RAC2 1 1
hsa-miR-21* 0.91 0.0396 446 B3GNT7 IL6ST, LSAMP, BMP6 1 3
hsa-miR-22 0.76 0.0423 294 RUFY2 FMNL2, PTGFR, CBL, OGN 1 4
hsa-miR-425* 0.71 0.0227 25 --- --- 0 0
hsa-miR-185 0.60 0.0038 430 TRIM58 FAIM2, LSAMP, CPT1A 1 3
hsa-miR-296-5p 0.56 0.0187 111 KAZALD1 0 1
hsa-miR-103a 0.55 0.0198 434 BCL11A PIK3R1, DCLK1, ZCCHC2, MASP1 1 4
hsa-miR-107 0.53 0.0357 452 BCL11A PIK3R1, DCLK1, ZCCHC2 1 3
hsa-miR-186 0.53 0.0343 1443 FRMD4A
IL6ST, ATP7A, PABPC4L, FNIP1, OCLN, KIAA1324L, AFF1, SFRS6,
MET
1 9
hsa-miR-887 0.45 0.0277 22 --- --- 0 0
.d ocu -tra ck.co
.d ocu -tra ck.co
miRNA ID ΔΔCt p-value mRNA targets
mRNA up in
MDD mRNA down in MDD mRNAs
up
mRNAs down
hsa-mir-132 -0.42 0.0028 537 SLC2A1 ANKRD29, ENPP4, PCDH10 1 3
hsa-mir-421 -0.43 0.0013 468 SCG2 BMP2, RASSF8, PTGFR, PTGES 1 4
hsa-mir-542 -0.44 0.0078 209 KIAA1324L 0 1
hsa-mir-450a -0.50 0.0233 20 --- --- 0 0
hsa-mir-16-2*
(3p) -0.54 0.0381 868 MSTN,
RUFY2
PIK3R1, FMNL2, ATP7A, DDIT4L,
PABPC4L, ERAP1, OGN, MET 2 8 hsa-mir-424 -0.69 0.0309 885
PIK3R1, HSPA4L, ZFHX4, MLL3, DCLK1, ATP7A, RASSF8, SVEP1, ENPP4,
ZCCHC2, MASP1, KCNJ2
0 12
hsa-mir-628-3p -0.72 0.0101 231 --- AMPD3 0 1
hsa-mir-629-5p -0.76 0.0244 224 --- NFIB 0 1
hsa-mir-4293 -0.77 0.0086 234 --- PTGFR 0 1
hsa-mir-661 -0.80 0.0072 315 B3GNT7 PCDH10 1 1
hsa-mir-3909 -0.80 0.0286 178 HLA-DRA CHM, PTGFRN, PDE1A 1 3
hsa-mir-33a*
(3p) -0.80 0.0156 1541 MSTN, LEF1
SEMA3D, CCNL1, RALGPS2, DCLK1, HECTD1, EHBP1, EIF4G3, AHNAK, ETV1,
RASSF8, PTGFR, DDIT4L, KIAA1324L, ERAP1, TNFRSF19, AFF1, OGN
2 17
hsa-mir-135b -0.84 0.0289 405 --- IGF2BP3, KLF4, IL1R1, PABPC4L,
IGF2BP3 0 5
hsa-mir-7 -0.96 0.0320 675 TRIM58 KLF4, CBL, KCNJ2 1 3
hsa-mir-4267 -0.97 0.0360 272 --- PREX1, SSFA2, XPNPEP3, AFF1 0 4
hsa-mir-548a-3p -1.05 0.0052 1118 ---
PIK3R1, IGF2BP3, CYP1B1, ZFHX4, RAPGEF2, IL1R1, SSFA2, CBL, OCLN,
PDE1A, IGF2BP3, DDX17
2 12
hsa-mir-548d-
3p -1.25 0.0120 1380 LEF1,
SLC2A1
ZBTB38, FOXP2, RALGPS2, MLL3, PER3,
DCLK1, ATP7A, IL1R1, XPNPEP3, OCLN 2 10
hsa-mir-613 -1.53 0.0025 371 --- CHM, ANKRD29, PAX3, OGN, MET 1 5
hsa-mir-3714 -1.58 0.0202 545 ---
SEMA3D, RALGPS2, ERC1, AMPD3, CPT1A, CBL, PABPC4L, AFF1, KCNJ2,
BMP6
0 10
hsa-mir-1294 -1.78 0.0371 165 --- --- 0 0
hsa-mir-429 -2.00 0.0109 842 MSTN, FRMD4A
RALGPS2, CHM, KLF4, RAPGEF2,
RASSF8, SSFA2, OCLN 2 7
LEGEND: Red - upregulated mRNAs in MDD; Green - downregulated mRNAs in MDD; Bold symbols - regulated by multiple miRNAs
.d ocu -tra c .d ocu -tra c