JAAS Journal of Analytical Atomic Spectrometry rsc.li/jaas
September 2021 Pages 1785–2020
ISSN 0267-9477
CRITICAL REVIEW G. Galbács et al.
Nanoparticles in analytical laser and plasma spectroscopy – a review of recent developments in
Nanoparticles in analytical laser and plasma
spectroscopy – a review of recent developments in methodology and applications
G. Galb´acs, *abA. K´eri,abA. Kohut, bcM. Veres dand Zs. Geretovszky bc
The present review attempts to comprehensively overview the progress in thefield of nanoparticle-related analytical laser and plasma spectroscopy research, focusing on the results of the past decade. The discussion involves the brief description of the motivation and principle of operation behind all existing technologies. As a novel approach, the connection between nanoparticles and laser and plasma spectroscopy is discussed in all three major areas: monitoring of nanoparticle synthesis, nanoparticle characterization, as well as plasmonic signal enhancement achieved by using nanoparticles. In each area, a detailed description of methodological developments and modern applications is provided.
1. Introduction
Nanoscience has moved forward with giant leaps in the last two decades. The special optical, mechanical, magnetic and
energetic properties of nanoparticles (NPs) have been widely recognized and are being exploited in an array of industrial, scientic and medicalelds. Today, numerous synthesis tech- nologies are available for the controlled production of engi- neered NPs, nanostructures and nanocomposites not only at the laboratory, but also at the industrial scale.1–3The inuence of nanostructured materials on the efficiency and cost of, or approaches to industrial and scientic processes is so immense that many scientists consider the most recent decades as the
rst ones in the“nano age”, which interweaves with the silicon era.
Analytical science also benets from the special properties of nanomaterials, as it not only uses these materials, but also
G´abor Galb´acs is holding MSc diplomas in chemistry and physics, as well as in environ- mental sciences (University of Szeged, Hungary). He obtained a PhD/CSc degree from the same university in 1998 and a DSc title from the Hungarian Academy of Sciences in 2013, both in the eld of analytical chemistry. His research is diverse, but focuses on funda-
mental studies and
instrumentation/method development for laser and plasma analytical spectroscopy, mostly involving LIBS, ICP-MS and ICP- AES. He is a full professor and the head of the Department of Inorganic and Analytical Chemistry at the University of Szeged since 2014.
Albert K´eri received his B.Sc. in Environmental Engineering (2014) and his M.Sc. in Chem- istry (2016) from the University of Szeged, Hungary. The topic of his PhD thesis– that he defen- ded in 2020 at the University of Szeged – was ICP-MS-based analytical method development for the investigation of multi- component nanoparticles. He participated in several national and European founded research and R + D projects where he developed ICP-MS and LIBS based analytical methods. Currently he is a postdoctoral researcher at the Inorganic and Analytical Chemistry Department at University of Szeged.
aDepartment of Inorganic and Analytical Chemistry, University of Szeged, D´om sq. 7, 6720 Szeged, Hungary. E-mail: galbx@chem.u-szeged.hu
bDepartment of Materials Science, Interdisciplinary Excellence Centre, University of Szeged, 6720 Szeged, Dugonics sq. 13, Hungary
cDepartment of Optics and Quantum Electronics, University of Szeged, D´om sq. 9, 6720 Szeged, Hungary
dDepartment of Applied and Nonlinear Optics, Institute for Solid State Physics and Optics, Wigner Research Centre for Physics, 1121 Konkoly-Thege M. way 29-33, Budapest, Hungary
Cite this:J. Anal. At. Spectrom., 2021, 36, 1826
Received 30th April 2021 Accepted 14th July 2021 DOI: 10.1039/d1ja00149c rsc.li/jaas
JAAS
CRITICAL REVIEW
contributes to or provides inspiration for the development of new ones. Among others, sample preparation and separation techniques,4,5chemical sensing6–8and spectroscopy9–12are the
elds of analytical science that have the most interaction with nanoscience. Instrumental analytical techniques are also crucial to the characterization of NPs,13 as well as for the monitoring of nanostructures either during controlled synthesis14,15or when released in the environment.16This close interaction between analytical science and nanoscience has already produced a number of scientic results, which have been overviewed in several books17–19and review papers.9,20–23
Laser and plasma spectroscopic (LPS) techniques are pres- ently dominating theeld of analytical spectroscopy. Plasma- based spectroscopy techniques, such as inductively coupled plasma optical emission and mass spectrometry (ICP-OES and ICP-MS), microwave induced optical emission spectroscopy (MIP-OES), glow discharge optical emission and mass spec- troscopy (GD-OES and GD-MS), are naturally used mainly for elemental and isotopic analysis, whereas laser sources can serve both atomic and molecular analyses, depending on the laser
uence applied and the analyte reservoir. Examples include
laser-induced breakdown spectroscopy (LIBS), laser ablation (LA) sample introduction, Raman spectroscopy, laser-induced
uorescence spectroscopy (LIFS), photoacoustic spectroscopy (PAS), laser enhanced ionization spectroscopy (LEIS), cavity ringdown spectroscopy (CRDS) and more.24More recently, the combination of laser and plasma sources for analytical spec- troscopy purposes is also gaining momentum, used either as a performance booster (e.g. ref. 25 and 26), or in tandem (hyphenated) instruments in order to provide more, atomic plus molecular, analytical information about the sample. In the latter bin, oen are instruments which involve LA and LIBS, for the reason that these techniques lend versatile sampling and spatial resolution capabilities to other analytical spectros- copies. LIBS-Raman,27LIBS/LA-ICP-MS,28LA-GD-MS29and LIBS- LIF30are examples for such tandem instruments.
Nanomaterials are also more and more involved with lasers and plasmas. For instance, nanoparticle synthesis by electrical discharge plasmas1,31 or via laser ablation32 are recently becoming increasingly common methodologies. Since the most popular engineered NPs are metallic therefore laser and plasma based atomic spectroscopies are most oen called for thein situ monitoring of the synthesis process or for the characterization of the produced particles. LIBS33–35and ICP-MS seem to show the best performance and practicality in these applications. In particular, the single particle ICP-MS (spICP-MS) technique has become a very powerful and versatile nanoparticle character- ization approach36,37for nanosols. Laser light scattering38and absorption methods (such as PAS39), are also well established, important tools of nanoaerosol characterization. Analytical signal enhancement in LPS is also oen effectuated by using nanoparticles, mostly based on plasmonic effects. A premier example for this is surface enhanced Raman spectroscopy (SERS),10 but LA-ICP-MS40 and LIBS12,41 applications are also beneting from similar effects. Last, but not least, the use of NP- based liquid sample preparation methodologies in LPS in Attila Kohut completed his PhD
in physics at the University of Szeged, Hungary in 2018. His PhD research was centered around the fundamental investi- gation of spark plasmas used for nanoparticle generation.
Currently, his research is focusing on the generation of bimetallic nanoparticles in elec- trical discharges and their appli- cations in differentelds.
Mikl´os Veres graduated in physics at the Uzhhorod National University (Uzhhorod, Ukraine) in 2000. He received a PhD degree from the Budapest University of Technology and Economics in 2005 and a DSc title from the Hungarian Academy of Sciences in 2021, both in theeld of physics. His research focuses on optical spectroscopy including sponta- neous and stimulated Raman scattering, photoluminescence, plasmonic enhancement, spectro- scopic imaging and instrumentation development. He is a senior researcher and the head of the Department of Applied and Non- linear Optics at the Wigner Research Centre for Physics (Buda- pest, Hungary).
Zsolt Geretovszky holds an MSc in Physics and Chemistry, and a PhD in Physics, both from the University of Szeged (USZ, Hun- gary). He has been a research fellow at the University College London (UK) and Lund Univer- sity (Sweden) and currently holds an associate professor position at USZ, where he is the head of the Nano- and Micro- processing Laboratory. Dr Ger- etovszky has expertise in the generation–especially in the gas phase and laser-based synthesis– and characterization of nanoparticles/nanomaterials. He co- authored more than 60 peer-reviewed publications and led several Hungarian and international R&D projects. Currently he is supervising the work of one postdoctoral and 5 doctoral fellows.
general, such as separation or preconcentration, are also becoming more frequent in recent literature.
Several reviews overviewed earlier the applications of nano- materials in analytical science in general,9,20–23but so far none focused on theeld of laser and plasma spectroscopy, while this
eld enjoys a steadily increasing involvement of nanomaterials in recent years. The closest scope was provided by the review of Jianget al.9in 2012, which covered applications in analytical atomic spectrometry. Therefore, the present review attempts to encompass and comprehensively overview the recent develop- ments in all main areas of laser and plasma spectroscopy which interact with inorganic nanoparticles: namely the monitoring of the synthesis of nanoparticles, the detection and characteriza- tion of nanoparticles and the use of nanoparticles for signal enhancement. Please note that the scope does not include single macromolecule analysis. Our review focuses on results that appeared in the literature in about the last decade. Brief overviews of the methodologies of included subelds will be provided, along with references to seminal books and pio- neering works, but the focus is on recent applications.
2. Monitoring of nanoparticle generation
2.1. Importance, driving force and overview
NP synthesis methods range over numerous techniques, including chemical, physical, mechanical, and even biological approaches.42–44While there are some“golden standards”of NP characterization, such as transmission electron microscopy, certain generation methods have their unique characterization toolbox which ts the conditions of the given production method best. This is especially true when the monitoring of the whole synthesis process is aimed. Laser- and plasma-based spectroscopic techniques proved useful forin situmonitoring of particle formation in a temporally and/or spatially resolved and– potentially –minimally invasive manner. Plasma spec- troscopic monitoring is a natural choice when NP generation process includes a plasma stage, such as in the case of laser45or spark46 ablation, but it can also be useful when plasma is generated from the already formed particles by means of an energetic excitation source, such as a laser pulse.47The devel- opment of the spectroscopic toolbox used for monitoring plasma-based NP generation dates back long before the intro- duction of the term“nanoparticle”. Although in early research the occurrence of microscopic particulates was mostly consid- ered as a side-effect,48the accumulated knowledge on material removal from the target,49 on the excitation of different species,50 or on the determination of important plasma parameters51 provided valuable contribution to the plasma spectroscopic monitoring of current NP generation techniques.
The application of lasers in monitoring the NP generation opens up further possibilities via selectively exciting particle populations even at different stages of their formation. Various approaches exist, depending on the laser–particle interaction initiated, such as laser-induced incandescence (LII),52 laser- induced breakdown spectroscopy (LIBS),53 elastic,54 or
inelastic55scattering, or absorption,56to mention but a few. In the following sub-chapters, we will summarize some of the most recent laser- and plasma spectroscopy methods applied for the monitoring of NP generation, aer a brief description of the plasma diagnostic methodology related to this analytical problem.
2.2. A concise introduction to plasma diagnostics
Plasma diagnostics incorporates a broad variety of techniques aiming to give a comprehensive description of plasma proper- ties. When plasmas are utilized as sources for NP synthesis, plasma diagnostic tools allow for the precise measurement of synthesis conditions, hence facilitating the better under- standing of particle formation mechanisms as well as providing more control over the generation process. Plasmas are different from other, more common states of matter,rst and foremost in that their most important properties are generally cannot be measured directly. Instead, plasma properties are deduced from observations of physical processes and their effects.57 This approach greatly relies on the understanding of plasma physics and chemistry involved in said processes. It rather naturally follows from the above that modeling the plasma, or at least those aspects which are subject of investigation, is oen an integral part of plasma diagnostics. Since a complete descrip- tion of the distribution function of the plasma constituents' position and velocity is not feasible in general, plasma diag- nostics usually aims at determining the so-called lower order moments of the distribution function, such as the density, mean velocity, pressure, temperature, and heatux. Numerous techniques exist for obtaining these values, along with multiple possibilities to categorize the different methods.
One way to sort plasma diagnostic techniques is based on the physical process or property of the plasma that is measured, as proposed by Hutchinson in his very comprehensive book on plasma diagnostics.57 By following this approach magnetic, particleux, and refractive index measurements, the measure- ment of photon emission from free or bound electrons, as well as the measurement of interaction with electromagnetic waves can be distinguished. Since the detailed discussion of these experimental approaches are far beyond the scope of the present review, we will only briey overview some of the main aspects of the interpretation of the emission from free and bound electrons, i.e., the topic of plasma emission spectroscopy.
Optical plasma emission spectroscopy (OES) is a versatile tool for diagnosing laboratory plasmas, with a well-established theoretical and instrumentational background.58–60Apart from the identication of species present in a plasma, the two main parameters that are predominantly determined by OES are the number concentration of electrons (electron density,ne) and the electron temperature (Te).61In order to support the following sub-chapter, we will briey mention some widely used methods for calculatingneandTe, usually employed during the moni- toring of plasma-based NP synthesis.
In case of laser- and electric discharge plasmas, electron concentration is mostly calculated from the spectral broadening
of emission lines, predominantly assuming that Stark broad- ening is the dominant mechanism.62,63Stark broadening and line shiing results from the Coulomb interactions between the emitting species and the charge carriers present in the plasma.
Due to the availability of precise tabulated data and validated theoretical description, the Stark broadening of H lines – especially the Hbline–are widely used to determine the elec- tron concentration in plasmas.64–66If H atoms are not present in the plasma, other elements can also be used to estimate the electron concentration, however, in this case the accuracy is usually lower, deviations typically in the range of 15–50% can be found.65,67 Even though, various theoretical models exist to interpret Stark-broadened spectral lines,68in most of the prac- tical cases electron concentration is estimated based on the comparison of the broadened full width at half maximum (FWHM) or line shiwith reference data,69tabulated for various transitions.70–72The following two equations are adapted from ref. 69. Eqn (1) describes the electron concentration as a func- tion of the Stark-broadened FWHM for hydrogen and hydrogen- like ions:
ne¼C(ne,Te)DlS3/2 (1) whereDlSis the FWHM of the Stark component, andC(ne,Te) is a coefficient, which is only a weak function of the electron temperature and concentration. Eqn (2) is valid for two- or more-electron atoms:
ne¼nrefe Dltotal
2wð1þ1:75Að10:75RÞÞ (2) whereDltotal is the total FWHM of the spectral line,w is the electron-impact half-width,Ais the ion broadening parameter describing the relative importance of collisions of ions with respect to the broadening, and thenrefe is the reference electron concentration, at whichwandAare measured or calculated.w andA only slightly depend on the electron temperature and concentration. R describes the ratio of the mean distance between ions and the Debye radius. For eqn (2) to be valid,A# 0.5 andR#0.8 must hold. For singly charged emitters, the term 0.75Rin eqn (2) should be replaced by 1.2R.
It should be noted that in some cases the effect of other line broadening mechanisms (such as instrumental, Doppler, reso- nance, van der Waals broadening) cannot be neglected, there- fore the contribution of the Stark effect to the overall line width –oen called Stark width–must be determined. To this end, various deconvolution procedures can be used depending on the relative importance of the different mechanisms.73,74 In certain cases, deconvolution procedures allow for the simulta- neous derivation of electron concentration from the Stark component and the electron temperature from other mecha- nisms, such as Doppler73 or van der Waals75 broadening. It should be mentioned that different approaches also exist for determining the electron concentration from the emission spectrum of a plasma, e.g., by using absolute irradiance methods, which usually require the calibration of the spec- trometry setup and the modelling of the emission spectrum.76,77
The other important plasma parameter, which can be derived by means of plasma OES, is the electron temperature, Te. It should be noted that plasmas are generally described by several different temperature values, corresponding to different plasma constituents (such as electrons, atoms and ions) or processes (such as atomic excitation and molecular vibrations or rotations). In many cases, these temperatures are not equal, hence different approaches are needed to determine a specic temperature value. However, there are certain cases, when some sort of equilibrium can be assumed, thus making temperature determination much easier. This is the case when local ther- modynamic equilibrium (LTE) prevails in the plasma. Simply speaking, LTE means that different species present in the plasma have the same local temperature.78To reach LTE, the electron concentration needs to be sufficiently high in the plasma facilitating collisions with electrons to be dominated over radiative processes. In this case, a single“LTE tempera- ture”can be derived, representative to the temperature of the electrons as well. Here we will briey overview the most popular method used for estimatingTfrom the emission spectrum of a plasma assumed to be in LTE, usually called the Boltzmann plot method. As suggested by the name, it is related to the Boltzmann equation, which describes the population of excited energy levels as a function of temperature.58Since the emission line intensities characteristic to different transitions of an atom or ion are proportional to the number concentration of the species in the corresponding excited states, a relation can be found between the emitted line intensities (Iij) and the so-called excitation temperature governing the population of the excited states, described by the following equation:
Iij¼hnijAij1 Zgine
Ei kT
(3) whereAijis the transition probability,Zis the partition func- tion,giandEiare the statistical weight and the energy of the excited level, respectively, k and h are the Boltzmann and Planck's constant, respectively,Tis the excitation temperature, nij is the frequency of the transition, and n is the number concentration of the studied species. Aer rearranging eqn (3), one can obtain
ln Iij
nijgiAij
¼ln hn
Z
Ei
kBT (4)
It is apparent from eqn (4) that the excitation temperature, which in LTE equals toTe, can be derived from the measured line intensities and the atomic data corresponding to the rele- vant transitions. A minimum of two emission lines are needed to calculate the temperature by using the Boltzmann equation– oen called line-pair method,79or two-line method80,81–but the results are generally more reliable when more spectral lines are involved, preferably with a wide spread over the upper energy level. In this case, the temperature is given by the slope of the graph described by eqn (4).51,82
As it was already noted, Boltzmann plot method relies on the assumption that local thermodynamic equilibrium (LTE)– at
least partially, for the corresponding transitions– exists. The validity of LTE can be estimated based on the electron concentration from the Griem83or McWhirter84criteria. Even though these criteria are widely used to justify the presence of LTE in atmospheric pressure laser- and arc or spark plasmas,51,69,85 there are indications that a more thorough analysis should be made to assess the validity of the assumption of LTE.86When deviation from LTE prevails, the Boltzmann plot method can still be employed to derive the excitation temper- ature by introducing correction factors.51 Nevertheless, the temperature determined from the Boltzmann plot method describes the temperature of the electrons only when the pres- ence of LTE is justied.
Originally, the Boltzmann plot method can be applied to a single species in a given ionization level. However, by exploiting the fact that in LTE the population of different ionization stages are determined byTeandne, one can extend the method to successive ionization stages. The method that incorporates this extension is called the Saha–Boltzmann method, named to refer to the fact that the ionization equilib- rium is described by the Saha equation (eqn (5)):51,69,87
nþ¼ 1 ne2Zþ
Z
2pmekBT h2
3
2exp
WþDW kBT
n (5) whereneis the number concentration of electrons, W+ is the ionization energy of the studied species andDWis the lowering of the ionization energy.88 The + subscript refers to ions.
Including successive ionization stages widens the energy range in the Saha–Boltzmann plot, as exemplied in Fig. 1, allowing for a more reliable determination of the slope of the linearized equation. However, since the combined Saha–Boltzmann equation is a more complicated function of Te and ne, this method normally requires an iterative approach to obtain the temperature.65,85When further assumptions can be made about the plasma, such as its stoichiometry, the Saha–Boltzmann
method can be extended to different elements as well. Due to the involvement of multiple elements at potentially different ionization stages, the so-called multi-element Saha–Boltzmann method allows for an even more precise determination of the LTE temperature of the plasma.89
We have already mentioned the importance of LTE in Boltzmann plot methods, but there are several additional considerations which should also be kept in mind. Here we only briey list some of these considerations, for further details please refer to the cited literature. First, it is important to note that the accuracy of constants involved in the equations highly affect the accuracy of the calculated values. The most critical factor here is the transition probability, which in many cases is only known with poor accuracy.65It should also be noted that the above methods are applicable for optically thin plasmas.
Therefore, when self-absorption is dominantly present in the emission spectra, additional techniques or corrections must be applied.69,90–92It should also be kept in mind that OES tech- niques provide spatially integrated information over the line of observation. Therefore, spatial deconvolution techniques might need to be applied. For instance, a commonly used technique for optically thin plasmas with cylindrical symmetry is the Abel inversion. By employing Abel inversion, the radial intensity distribution can be reconstructed from the lateral intensity distribution.69
The above-mentioned methods rely on the line emission of the plasma for temperature determination, but additional OES- based plasma diagnostic techniques also exist. The continuum radiation emitted by plasmas–highly characteristic to the early stages of laser ablation plasmas69 – can be exploited for temperature calculation via the so-called line-to-continuum intensity ratio method. As suggested by its name, this method employs both the intensity of the spectral lines and the continuous component of the emission spectrum to derive the electron temperature under LTE conditions.93Apart from the importance of sufficiently well-known parameters and constants, which cannot be stressed enough at all OES-based methods, the applicability of this approach is also limited to those stages of plasma evolution when line spectrum coexists with continuum radiation, both having sufficient signal-to- noise ratio.69
It should also be mentioned that LTE conditions are oen not met in many plasmas, however, OES- (and laser spectros- copy) based methods are still proved useful in the description of these plasmas. An important parameter of non-LTE plasmas is the rotational temperature of molecules present in the plasma, which is oen assumed to be equal to the–translational–gas temperature. There are various techniques for obtaining the rotational temperature from emission (and absorption) spectra, which were critically reviewed recently by Bruggemanet al.94We only mention that when an equilibrium rotational population is assumed, essentially the Boltzmann plot method can be applied to the determination of the rotational temperature, with the difference that rotational spectral lines must be used for con- structing the plot. Simulating the rotational spectrum and
tting to its measured counterpart is also a commonly used method for deriving the rotational temperature. This approach Fig. 1 Saha–Boltzmann plot constructed from the emission spectrum
of a Cu/Ar spark discharge plasma measuredca.1ms after the onset of the gas breakdown (based on the authors' own data).
has the advantage that depending on the complexity of the model used for generating the synthetic spectrum, more thor- ough description of the analyzed plasma can be given than in case of equilibrium-based methods.
2.3. Methodology and applications
Laser- and plasma spectroscopic methods are predominantly used in the in situ monitoring of NP generation in particle synthesis techniques where the initiation of a plasma is involved, such as electrical discharges (mostly arcs and sparks), laser ablation, and ames. Therefore, in the following subchapters we will focus on the monitoring methodology applied in these synthesis methods, while some further synthesis routes where in situlaser- or plasma-based particle monitoring were utilized will be mentioned at the end of the chapter.
2.3.1 Monitoring of ame synthesis. Flame synthesis is a well-established gas-phase method for the production of inorganic NPs, predominantly metal oxides and carbon black.95 Considering the amount of the produced particles, ame synthesis is the most widely used NP generation technique by far, mainly used for the synthesis of SiO2, TiO2, and Al2O3on industrial scale.96 Flame aerosol reactors are based on the controlled burning of a gaseous or liquid precursor, which yields NPs in the range of several hundreds of grams per hour.96 Due to its exceptional capability for producing NPs on a large scale, the technique was subjected to extensive academic and industrial interest.97 This is justied by the highly complex nature of the processes taking place in aame, necessitating the combination of knowledge in molecular chemistry, reaction kinetics, thermodynamics, and materials science.97 From a point of view of the generated NPs, it is especially important to assess the temperature–time history of a particle, one of the most signicant parameters determining the properties of the
nal product, which can be estimated byin situtemperature and velocity measurements.98
Since optical diagnostic methods are capable of providing this information without disturbing the synthesis process, a broad range of techniques have been developed or applied to the specic conditions ofame synthesis. Fig. 2 schematically shows the particle generation in aame reactor and exemplies several optical and non-optical diagnostic tools for thein situ and ex situ investigation of different aspects of the particle formation process. Optical diagnostic methods applicable for monitoring ame synthesis were thoroughly reviewed very recently by Dreier and Schulz,100Schulzet al.,101and Rahinov et al.102 therefore we only recall here some of their main considerations supplemented by related literature.
Laser-based methods applicable for thein situmonitoring of
ame NP synthesis can be divided into two main groups, the
rst includes the methods appropriate for monitoring the gas- phase particle formation process (such as the temperature and intermediate species concentration), while the second group consists of the techniques capable of monitoring the properties of the generated particles.100 A commonly used method both for temperature and concentration measurements
is based on the absorption of a laser beam. Information on the average temperature or concentration of intermediate species (such as small molecules corresponding to precursor reactions) can be gained by measuring the absorption spectrum by using ring-dye lasers or tunable diode lasers, employing Fourier- transform infrared spectroscopy (FTIR), intra-cavity laser absorption spectroscopy (ICLAS), or cavity-ring-down absorp- tion spectroscopy (CRDS).100 Even though absorption-based techniques provide line of sight information, by employing fan-shaped laser illumination and multiple detectors, temper- ature and concentration distributions can be reconstructed using a 1D tomographic algorithm.103Another method enabling the online monitoring of the ame temperature and the concentration of the intermediate species is laser-induced
uorescence (LIF). LIF methods are usually distinguished by the species the measurements are based on, such as NO or OH for temperature, and various other species (e.g., Fe, CH2O, CH, OH, SiO, FeO, In, AlO, TiO) for intermediate concentration determination.100Recently, the good applicability of SiO-LIF in quantitative temperature104 and concentration105 imaging as well as the investigation of the combustion chemistry of the
ame synthesis of SiCl4 nanoparticles106 have been demonstrated.
In addition to the above techniques, the temperature can also be determined based on both elastic and inelastic scat- tering of laser light. Raman- and coherent anti-Stokes Raman scattering (CARS) as well as Rayleigh scattering have been applied to measure the temperature in ame reactors,100 however, since these techniques are more suitable for particle- free environments, usually they are of limited use in strongly particle-ladenows.101Apart from temperature measurements, light scattering-based techniques can also be used to monitor the properties of the as formed particles in situ. For this purpose, another laser-based technique is the so-called laser- induced incandescence (LII), which is based on the measure- ment and analysis of the incandescence signal of the particles heated up by a laser beam, providing information on volume fraction and primary particle size100 (see Section 3.3.2. for details). Since the proper interpretation of the LII signal is not straightforward, attempts are made to standardize calibration and signal processing protocols.107,108When the laseruence is high enough to vaporize the NPs, the emitted atomic spectrum can also be used to gain information on the particles. This is the basis of laser-induced breakdown spectroscopy (LIBS), a tech- nique well-known in analytical spectrochemistry109(see Section 3.3.3. for details).In situaerosol LIBS is relatively challenging to execute and interpret the results, but it has been shown to be able to provide valuable information on the complex processes taking place in turbulentame reactors.110
2.3.2. Monitoring of laser ablation synthesis. NP genera- tion by lasers is based on the ablation of a solid target by an energetic laser beam in a gaseous or liquid environment.
Particle formation will take place through several steps from the material ejected offthe surface, the exact process of which is depending on the laser parameters (wavelength, pulse width,
uence), the target material, and the surrounding medium (gas, liquid, or vacuum).45The particles can be collected in the form
of a nanopowder, colloid, or they can be deposited onto a substrate to form a thin layer. The latter is the basis of the well-established technique of pulsed laser deposition, or PLD.111 Laser-based NP generation is associated with the formation of a plasma plume over the ablated surface, consisting of neutral and excited species of the target material. The emission or the absorption of this plasma can be investigated by various spec- troscopic and plasma diagnostic methods. In fact, laser ablation NP generation mostly accompanied by the creation of a plasma plume, which is the very basis of LIBS.112,113Due to this common root, instrumentation and methodology developed for LIBS can naturally be adapted to the monitoring of laser ablation NP generation. Similarly to that of the monitoring of electrical discharges (see in the next sub-chapter), this is predominantly based on the acquisition of the emission of the plasma and the calculation of the main plasma parameters, such as the electron concentration and temperature.
The most basic approach for the monitoring of the laser- induced plasma (LIP) is the collection of its temporally and spatially integrated radiation by means of an optical ber during the ablation process. Thereaer,e.g., the Boltzmann plot method (see in Chapter 2.2.) can be applied to calculate the excitation temperature of the plasma,115,116 or the Stark
broadening to derive the electron concentration.117 Naturally, much more reliable data can be obtained when the highly transient LIP is monitored with appropriate temporal resolu- tion. Evolution of electron concentration as derived from Stark broadening,118–120 temperature evolution calculated from the Boltzmann plot120 and Saha–Boltzmann plot,118,121 or relative line intensity119 methods are routinely applied. It should be noted that even in case of temporally resolved measurements, care should be taken when temperature calculation methods relying on the existence of LTE are applied. This is especially true in case of low-pressure laser ablation experiments where electron concentration decreases rapidly, hence LTE can only be assumed in the earliest stages of the laser plasma.122 Another circumstance, which necessitates high temporal resolution is the limited temporal detectability of the emission signal, as in case of pulsed laser ablation under liquid (PLAL), where the signal is detectable for only a short period of time (a few tens of nanoseconds to a few microseconds). Nevertheless, by employing a high temporal resolution ICCD camera, the evolution of the plasma emission can be monitored123and the plasma temperature can be deduced in this short intervale.g., bytting the continuum component of the emission spectrum by a Planck-like distribution,114or by employing the Boltzmann Fig. 2 Schematicfigure of an experimentalflame spray pyrolysis (FSP) reactor setup and process diagnostics for analyzing the consecutive stages of metal oxide NP evolution. Nonintrusive laser and camera diagnostics including phase-Doppler anemometry (PDA), laser sheet (LS) and shadow graphic (SG) for liquid spray analysis (blue), as well as optical emission spectroscopy (OES) and camera imaging for determination of the metal oxide nanoparticle nucleation zone (green). Thermophoretic sampling with subsequent transmission electron microscope analysis (TS-TEM, orange) and scanning mobility particle sizer (SMPS, red) are applied for local description of primary and agglomerate nanoparticle evolution, whilefilter collected particles are considered for ex situ analysis (BET and XRD). Figure and caption are taken from ref. 99.
plot method to the spectral lines.124A typical experimental setup for OES-based monitoring of NP generation during PLAL is shown in Fig. 3. The temperature can also be deduced by comparing the measured and simulated vibrational and rota- tional spectra of the plasma, supplemented by electron concentration determination from the Stark broadening of spectral lines.125
Apart from the calculation of plasma parameters (such as temperature or electron concentration), the intensity variation of specic spectral lines also carries important information on the particle generation process. Such information for instance is the transfer of species dissolved in a liquid into the plasma created during PLAL. By following the intensity variation of two ionic lines the spectral features can be correlated to the composition of the ablated sample and thus the transfer process can be investigated.126 Similarly, by comparing the emission intensity of an atom to that of the ion or oxide of this atom, the dynamics of the ionization or oxidization processes can be monitored.118,125Direct information on the variation of atomic or ionic spectral lines is also useful when spatially and temporally resolved OES is employed to monitor one or more process parameters of the laser ablation process, such as the ablation medium (e.g.gas or liquid),119ablation wavelength121or the ambient pressure.127–130 Having spatial, temporal, and spectral resolution at the same time allows for carrying out
time-of-ight measurements of specic species generated during laser ablation. The expansion dynamics of selected plasma constituents can be derived from the emission spectra and used for instance in correlation with the excitation processes,130or to detect the onset of the deposition process and the growth of a NPlm during PLD.121,127,131,132
It should be noted that temporally and spatially resolved OES is predominantly carried out by acquiring a relatively broad spectrum of a localized spatial region with a ns-gated camera, thus obtaining information on several species at the same time.
However, this indicates that an extended area can only be covered by “scanning”, i.e., repeating the measurements in different locations. In contrast, when the spatio-temporal investigation of only one or a few specic spectral lines is aimed, high spatial and temporal resolution can be achieved at once by imaging the plasma aer using a wavelength-dispersive element.133 Additional information can be gained on the particle formation process by employing a second laser pulse to excite the species ablated by the main pulse. The second pulse can be either collinear114or orthogonal124to the main pulse, and the emission of the excited species can be used to calculate the excitation temperatureviathe Boltzmann plot method, or the electron concentration from Stark broadening.114A remarkable feature of this double-pulse approach is the correlation of the emission generated by the second pulse with the changes
Fig. 3 Schematic of the experimental setup for the OES-based monitoring of NP generation by pulsed laser ablation in gas and liquid.114
associated with therst pulse, be it the dynamics of bubble formation under liquid,114or the composition of the generated nanoparticles.124
In the above cited studies, optical emission of the laser- generated plasma was acquired and analyzed during NP generation to monitor the particle synthesis process. However, different approaches also exist, which use plasma- and/or laser spectroscopic techniques for thein situcharacterization of the laser ablation-generated particles and therefore monitor the generation process. Dynamic light scattering (DLS) is a widely used technique to investigate NPs dispersed in a liquid,38,134see Section 3.3.1. for details. Wei and Saitow have demonstrated that DLS can be used in connection with a pulsed laser ablation NP generation system for the in situ monitoring of particle synthesis in a supercriticaluid.135As opposed to the seconds to hours temporal domain covered by the DLS measurements of Wei and Saitow, temporal resolution in the picosecond range can also be achieved via femtosecond transition absorption spectroscopy. By employing sub-picosecond pump and probe laser beams, the evolution of the transient absorption spectrum of gold NPs exposed to pulsed laser irradiation could be fol- lowed.136In situprobing a femtosecond laser plasma was carried out by Oujjaet al.They have employed a second, nanosecond laser pulse perpendicular to the material ablating laser to generate its third harmonics and obtained its spatiotemporal distribution from nanoseconds to hundreds of microseconds aer ablation. It was concluded that the harmonic generation is affected by the formation of middle-sized metal clusters that had a huge effect on the harmonic generation yield. Thus, this nonlinear optical approach is capable of investigating the cluster formation during fs-laser ablation-based NP genera- tion.137All the previous methods exploited the investigation of the optical response of the laser plasma or the generated NPs, induced by laser excitation. However, as demonstrated by Valverde-Alvaet al., the photoacoustic signal generated during the laser ablation of a target in ethanol can also be used to monitor the NP generation process.138Their results exemplify well that the acoustic signal generated by the ablating laser pulses is also useful for thein situmonitoring of laser ablation- based NP synthesis.
2.3.3. Monitoring of electrical discharge synthesis. Elec- trical discharges generally involve the (partial) ionization of a gas or a liquid by an electric eld, facilitating the ow of electrical current through this ionized medium.139 Such a phenomenon can occur in various forms, resulting in various types of different discharges depending on the experimental conditions. Although NPs can be generated by virtually any type of discharge, from a spectroscopic monitoring point of view it is worth distinguishing between discharges forming thermal and non-thermal plasmas. Thermal or hot plasmas can be described by some form of equilibrium (most oen LTE), meaning that species are characterized by the same temperature, at least in a given spatial point.86On the contrary, non-thermal or cold plasmas are characterized by higher electron temperature than that of the heavy species, therefore LTE conditions are not ful-
lled.140Most prominent examples of the latter are dielectric barrier discharges,141glow discharge,142or several types of spark
discharges.143Thermal plasmas include atmospheric-pressure (transferred) arcs,144 and atmospheric-pressure, microsecond- long, oscillatory sparks.85In the following, we will discuss the spectroscopic monitoring results of the latter two types of discharges in more detail for the main reason that in the past few decades the experimental techniques relying on arc and spark plasmas have attracted considerable scientic and industrial interest and became prominent candidates for satisfying the need for the mass production of high purity, engineered NPs.46,144–146
Electric sparks are not self-sustaining discharges, meaning that aer the initiation of the breakdown of the medium between the electrodes, energy must be continuously supplied externally to maintain sparking.147The way of the energy input, the design of the electrodes or the surrounding medium may vary, thus greatly inuencing the discharge characteristics, including the existence or non-existence of LTE in the discharge plasma. One form of spark discharges associated with the formation of a thermal plasma is utilized in the so-called spark discharge nanoparticle generators (SDGs).148SDGs are based on the spark ablation of a pair of electrodes placed in a gas-tight chamber under atmospheric pressure. The sparking is main- tained by periodically discharging a capacitor (typically having a capacitance in the range of a few or a few tens of nF) con- nected to the electrodes. The sparking is associated with an energetic discharge plasma allowing for high currents (several hundreds of amperes) toow between the electrodes typically for a few microseconds, resulting in the atomization of the electrode material. This material is quickly cooled down due to expansion and the presence of a gas stream continuously
owing through the interelectrode gap. This gas ow also carries away the ablated material and facilitates the formation of NPs.149,150The generated NPs are dispersed in the carrier gas thus forming an aerosol. Aerosol science has well established methodologies to analyze the produced particles both in situ151–153andex situ.154However, an inherent limitation of these techniques is that they only provide information about the
“nal product”of the process – i.e., the NPs – and therefore unable to monitor the generation process itself, especially the initial plasma stage.
Optical diagnostics of thermal spark plasmas has a long history with well-established methodology and scientic results, mostly driven by the research interest in theeld of analytical spectrochemistry. Spark plasmas include transient, temporally and spatially varying phenomena the reliable investigation of which necessitates the use of temporally–and preferably spatially–resolved techniques.155Due to the analyt- ical perspective, the early studies in theeld mostly focused on the direct analysis of the emitted light in order to understand the sampling and excitation mechanisms taking place in the spark.156 Those studies mostly included the determination of the concentration of the ions and electrons by utilizing the Stark effect,64or laser scattering,157or interferometry.158Calculation of the plasma temperature by means of the Boltzmann159or the Saha–Boltzmann plot method51 has also been carried out. A comprehensive overview of the methods applicable for gas discharges can be found in the book by Boumans,50while the
fundamental mechanisms obtained during the analysis of the spark emission is reviewed by Scheeline.49
These results serve as an important basis for the optical monitoring of electrical discharge-based NP generation;
however, they cannot be directly applied for modern SDGs. The reason for this is, in contrast to the highly regulated and well- controlled analytical sparks, SDGs are mostly operated in
“free running mode” when sparking occurs as soon as the breakdown voltage of the interelectrode gap is reached.160The lack of regulating circuitry results in a technically simple and easy-to-construct design and a higher particle yield, but also hinders the use of external instrumentation with precise active triggering and sometimes poses stability issues. Other technical constraints, originating frome.g., the generator chamber or the components of the gas line also introduce physical limitations which narrows the range of applicable methods. All the above considerations rather naturally lead to the use of OES as a useful spectroscopic technique applicable under the circumstances of NP generation. In its most basic form, OES can be applied simply to analyze the emission originating from the spark gap without spatial or temporal resolution. Honta˜n´onet al.used an optical ber to collect the light emitted by the spark plasma during NP generation and analyzed its spectrum by a simple tabletop spectrometer. The acquired spectra reected the spatially and temporally averaged spectrum of several concomitant sparks but still provided useful information about the conditions of the generation process. They have collected the spectra of a continuous glow and arc discharge used for NP generation as well and demonstrated that even with such an experimentally simple OES approach, the three discharge regimes are clearly discernible.161This has great potential in the optical monitoring of electrical discharge-based NP generators.
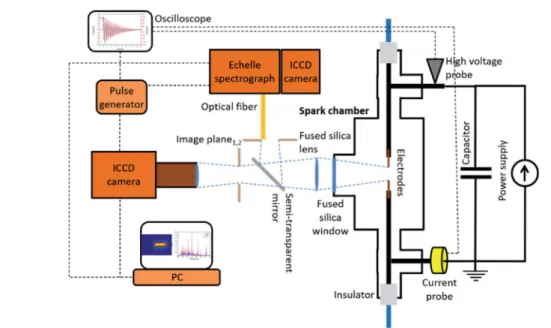
A much deeper insight can be gained by acquiring time- resolved spectra of the spark plasma, an experimental setup
for which is shown in Fig. 4. In a similar arrangement, Kohut et al.employed aber-coupled echelle spectrograph equipped with an intensied CCD to investigate the temporal evolution of the spectrum emitted by a spark plasma during NP generation, with the concomitant fast imaging of the sparking, with a temporal resolution of 50 ns.85Due to the already mentioned unregulated nature of the sparking, the spectral acquisition was synchronized to the plasma formation by using the sharp drop of the capacitor voltage as a trigger signal. This introduced aca.
100 ns time delay, which inherently means that the veryrst stages of a spark discharge–i.e., the so-called pre-breakdown and breakdown stages162 – cannot be investigated by this approach. These temporal periods, however, are considered to have minor contribution to NP generation, compared to the following – arc and aerglow – stages.15 The temporally resolved, though spatially integrated, spectra also allowed for reconstructing the intensity evolution of the atomic lines of the electrode material, which correlated well with the evolution of the discharge stages. The time-resolved data allows for the identication of temporal windows in which LTE holds, there- fore the Boltzmann plot method (see Chapter 2.2.) can be applied to obtain the temperature-variation of the spark plasma, thus deriving its cooling rate.15 The fundamental information, which can be gained from the time-resolved emission spectrum of the spark discharge can be enriched by increasing the spatial resolution of the spectral acquisition. In case of an SDG operating with argon carrier gas and copper electrodes, the applicability of the Saha–Boltzmann method was demonstrated for calculating the evolution of the LTE temper- ature of the plasma in itsrstca.2.5ms aer the onset of the breakdown.85In the same period, the electron concentration in different spatial positions could also be deduced from the Stark broadening of selected lines of argon ions. The sufficient temporal and spatial resolution also allowed for using the
Fig. 4 Schematic view of the experimental setup used for thein situOES-based monitoring and imaging of a spark discharge nanoparticle generator.
collected spectral data as an input for a semi-empirical plasma model, which was able to describe the cooling stage of the spark plasma (aerglow). Moreover, due to the spatially resolved spectral acquisition, the spatial distribution of the concentra- tion could also be deduced.85
Although SDGs are most commonly operated in argon or nitrogen, pulsed discharges are also widely applied for producing NPs under a liquid environment.163–165The working liquids usually consist of hydrogen, which allows for the application of the well-established methodology for deriving the electron concentrationviathe Stark-broadening of H lines.166,167 As it was mentioned earlier, another type of gas discharge used for nanoparticle generation–both in gas and liquid–is the thermal arc plasma.78Arc discharge NP generators (ADGs) have the advantage over SDGs that due to the continuous regime and hence the lack of a capacitor and high voltage charging power supply, an even simpler and cheaper technical design can be realized.168 ADGs are characterized by high particle yield and very good scalability, however the particle sizes are typically considerably larger than that of spark- produced NPs and its applicability for producing high purity and multielement particles is also limited.168From the point of view of spectroscopic measurements, arc plasmas have an even more established historical background, on which the moni- toring of ADGs can be based.50Generally, this includes all those plasma diagnostic techniques discussed in Chapter 2.2. and utilized for SDGs. However, due to the different plasma char- acteristics there are additional methods which can be employed. One important distinction from sparks is that – depending on the exact experimental conditions–the emission spectrum of the arc consists of a continuous background orig- inating from the blackbody radiation of the electrodes.161This can be simply exploited for temperature estimation in addition to other– already described – techniques, such as the Boltz- mann plot and line-intensity-ratio methods, or for electron concentration measurements based on the Stark broad- ening.169,170 In ADGs operating under different experimental conditions molecular bands of the ambient nitrogen gas was observed in the spectrum, the intensity variation of which along the arc plasma was correlated to the properties of the produced nanostructures.169 Similarly, in case of underwater or submerged arcs, the features of the temporally resolved emis- sion spectra were used to assess the peculiarities of the elec- trode erosion process and the degree of dissociation of water in the vicinity of the anode.171
In the previous paragraphs, the importance of spatial and temporal resolution in OES-based monitoring of arc and spark plasmas was pointed out and appropriate methods have been reviewed. These approaches mostly used well-localized signal collection with variable spatial positioning combined with a spectrograph. However, spatial resolution can be achieved in a single step by employing an imaging camera with appropriate optical lters. Bachmann et al. have proposed a method for obtaining the temperature distribution of a free-burning arc plasma, based on the simultaneous imaging of the plasma at two carefully chosen wavelengths.172 The experimentally acquired data was processed by using an LTE plasma model to
derive the plasma temperature. Abel inversion of the data was used to reconstruct the radial distribution of the arc plasma column. A detailed assessment of the potential sources of errors and uncertainties was also provided.
In addition to the detection and analysis of the light emitted by the discharge plasma, thein situmonitoring of the particle gener- ation has been also approachedvialaser-based methods. Santra et al.have shown theoretically that NPs can be detectedviaRayleigh scattering spectroscopy during arc synthesis, along with the continuous monitoring of the evolution of the particle pop- ulation.173Rayleigh scattering spectroscopy is based on the probing of the electronic polarizability of particles interacting with a laser beam. Since Rayleigh scattering is elastic, this technique has the advantage over for instance Raman spectroscopy that the signal levels are orders of magnitudes higher.173Another technique, which pushes down the detection size limit to the atomic scale and applicable to thein situmonitoring of arc synthesis is the coherent Rayleigh–Brillouin scattering (CRBS). CRBS is originally a laser- based gas detection technique, which was adapted to NPs and experimentally validated by Gerakis et al.174 CRBS relies on the creation of an electrostrictive grating and the probing of the velocity distribution in a mediumviaa four-wave mixing process. According to Gerakiset al.this technique can be effectively used to detect NPs in situ in volumetric particle generation methods, such as arc synthesis.174The formation of arc-produced carbon nanostructures was also monitoredin situby using laser-induced incandescence measurements and simulations by Yatomet al.175The viability of their approach was demonstrated via the recognition of two spatially separated group of particles with distinctly different sizes, having different role in the arc-based NP formation process.175At higher laser uences the particles can be effectively vaporized, which facilitates theirin situinvestigation by means of aerosol mass spectrometry. The successful application of this technique for investigating spark-generated NPs has been demonstrated by Nils- sonet al.153
As it was mentioned at the beginning of this chapter, spectroscopy-based methodology briey overviewed here are mostly applicable to thermal plasmas, where most of the LTE- based plasma diagnostic calculations can be carried out.
However, OES-based techniques are involved in the investiga- tion of cold plasmas as well. Particle generation by cold plasmas (produced by e.g. lamentary discharges or dielectric barrier discharges)176can also be monitored by spectroscopic means.
Due to the relatively low gas temperature molecular spectral bands are usually observable. The gas temperature can be determined by simulating the molecular spectrum andnding the best t of its measured counterpart.177–179 Processing the experimentally acquired data is usually carried out by dedicated purpose-made soware and scripts but commercial soware is also available for tting the spectra of several transitions observed in plasmas and for calculating the corresponding temperatures.180
2.4. Other generation techniques
In the previous subchapters we have briey reviewed the laser- and plasma diagnostic techniques used for monitoring NP
generation in plasma-based methods of high relevance from the point of view of applications. There are other additional particle generation methods as well, where the applicability of laser- and plasma diagnostic monitoring has been demonstrated. An example for such techniques is the continuous laser vapor- ization, which – unlike pulsed laser ablation – employs a continuous wave, usually CO2laser to vaporize a precursor, predominantly for producing carbon nanotubes.181Similarly to the monitoring of ames, CARS, LIF, and LII have been employed for thein situ monitoring of temperature, interme- diate concentration, as well as the assessment of the particle formation process.182In a similar, laser-based particle genera- tion scheme, the applicability of in situ LIBS has also been demonstrated to monitor the properties of the generated particles. Picardet al.employed aerodynamic focusing of the NPs under vacuum in order to eliminate the contribution of the background gas from the LIBS spectrum.183Low-temperature, low-pressure reactive plasmas are also successfully used to generate nanostructures,184,185 the formation of which can be monitored by laser spectroscopic approaches. Hundtet al.have employed quantum cascade laser absorption spectroscopy for the real time monitoring of the variation of the acetylene concentration in an Ar/C2H2 plasma during nanostructure synthesis in a radio frequency (RF) plasma.186 Leparoux and coworkers have investigated the synthesis process of graphene nano-akes in Ar/H2/CH4 RF inductively coupled plasmas by usingin situOES.187,188The acquired emission spectra allowed for the determination of the gas temperature from the C2Swan band, which could be correlated to the particle generation conditions. A recent review on the monitoring of non-thermal plasmas used for NP synthesis has been published by Mangolini.189
Particle generation techniques overviewed in the previous subchapters in context of real-time laser- and plasma spectro- scopic process monitoring employed various types of precursors (solid, liquid, gas), in different media (liquid, solid, vacuum), but both included plasmas to initiate particle formation.
However, laser spectroscopy has been also used to monitor wet chemical NP synthesis. Haber and coworkers used in situ second harmonic generation (SHG) and extinction spectroscopy to monitor the growth dynamics of seed-mediated gold and gold–silver core–shell NPs,190,191 which demonstrates the even wider possibilities of laser-based NP monitoring approaches.
3. Nanoparticle detection and characterization
3.1. Importance, driving force and overview
As it is known, the size and structure of nanomaterials are mainly responsible for their novel properties (electric, chemical, magnetic, optical, etc.), so naturally the characterization of nanomaterials has become the subject of intense research in the past couple of decades. Unfortunately, the fact that their size and structure critically determine their characteristics also makes the assessment of their physico-chemical properties (or structure–function relations) challenging, because their
synthesis is prone to reproducibility problems and generally produces polydisperse particles, frequently with a broad distribution and defects. In addition to this, their character- ization needs a comprehensive analytical approach, which also dictates the knowledge of limitations of the different tech- niques. As nowadays nanoparticles are being synthesized and used at an industrial scale, also including medical applica- tions,192,193 it has led to their inevitable appearance in the environment, which in turn generated an urge for the devel- opment of sensitive and credible techniques for their detection.
Since there is no universal characterization method that could simultaneously determine all important NP parameters, typically the use of complementary techniques is required. NP systems can be investigated in powder or suspension form but in certain cases the dissolution of particles is needed. Here follows a brief overview of the NP characterization methods.
Further information about these techniques and their applica- tion in various media can be found in specic reviews and books.13,14,194–199
Electron microscopy techniques represent one of the most frequently applied group of NP characterization methods.
Scanning electron microscopy (SEM) utilizes a well-focused electron beam that scans the surface of the sample and re-
ected electrons are used for imaging, while in transmission electron microscopy (TEM) a thin (typically less than 200 nm) sample interacts with the electron beam and the transmitted electrons are collected. Their popularity is derived from the fact that through“visualizing”NPs, a wide set of important char- acteristics can be determined, such as particle morphology, size distribution, degree of aggregation and – using a high- resolution apparatus–even crystal structure.
Scanning probe microscopes move a very sharp tip across the solid sample surface. In scanning tunneling microscopy (STM), DC voltage is applied between the conducting sample and the tip and the tunneling current, which is formed if the distance of the two object is very small (nm scale), is monitored. Atomic force microscopy (AFM) is based on electrostatic interactions between the atoms of the tip and the sample. Both STM and AFM allow for an atomic scale resolution imaging, hereby providing information on the morphology of nanomaterials.
They can even be utilized to create structures in the sub-nano range by manipulating atoms or molecules on the sample surface.200,201
Due to different electromagnetic radiation–matter interac- tions, a great number of NP parameters can be studied by X-ray techniques. Complementing electron microscopy with energy- dispersive X-ray (uorescence) spectroscopy (EDS or EDX) the elemental composition and its distribution in single NPs can be determined. Small angle X-ray scattering (SAXS) provides information about the size and size distribution, shape, and specic surface area of NPs. X-ray diffraction (XRD) probes ordered structures (crystal planes); hence the crystal structure, lattice parameters and crystallite size of the investigated nano- material can be determined. X-ray photoelectron spectroscopy (XPS) utilizes the photoelectric effect to perform surface anal- ysis with an information depth of 2–10 nm. XPS is capable of the investigation of electronic structure, elemental composition,