Capillary sodium dodecyl sulfate gel electrophoresis of proteins:
Introducing the three dimensional Ferguson method
Csenge Filep
a, Andras Guttman
a,b,*aHorvath Csaba Memorial Laboratory of Bioseparation Sciences, Research Center for Molecular Medicine, Faculty of Medicine, Doctoral School of Molecular Medicine, University of Debrecen, 98 Nagyerdei Krt, H-4032, Debrecen, Hungary
bTranslational Glycomics Group, Research Institute of Biomolecular and Chemical Engineering, University of Pannonia, 10 Egyetem Street, H-8200, Veszprem, Hungary
h i g h l i g h t s g r a p h i c a l a b s t r a c t
3D Ferguson plots were introduced to better understand the electro- migration of SDS proteins in cross- linked sieving gels.
16 different borate cross-linked dextran gel formulations were evaluated.
High selectivity was attained be- tween the regular and de-N- glycosylated etanercept subunits.
The KRvs logarithmic Mw plot pro- vided cross-linker concentration dependent molecular weight estimation.
a r t i c l e i n f o
Article history:
Received 30 April 2021 Received in revised form 10 August 2021 Accepted 14 August 2021 Available online 17 August 2021
Keywords:
Capillary gel electrophoresis Sodium dodecyl sulfate Ferguson plot Dextran Borate Etanercept
a b s t r a c t
One of the most extensively utilized rapid characterization, release and stability testing methods of therapeutic proteins in the biopharmaceuticalfield today is capillary SDS gel electrophoresis using borate cross-linked high molecular weight dextran. In spite of its widespread use, however, the gel composition dependent separation characteristics of this very unique sieving matrix has not been investigated yet.
Introduction of three dimensional (3D) Ferguson plots, based on simultaneous variation of the dextran (D) and borate (B) concentrations generating 16 different D/B ratio gels, allowed better understanding of the electromigration process of the SDS-protein complexes. As a result of this comprehensive study, non- linear 3D logarithmic mobility vs dextran and borate concentration surfaces were obtained. Both, the molecular weight protein standards and the new modality fusion protein etanercept resulted in concave 3D Ferguson plots. The interplay between the electroosmoticflow and the viscosity of the matrices played a key role in the resulting migration time and resolution. Selectivity values were defined and evaluated in 3D graph formats for the regular and de-N-glycosylated subunits of etanercept, as well as for the latter with the 10 kDa internal standard to understand both the dextran-borate complexation and sized based selectivities. KRplots of the retardation coefficients as the function of the logarithmic
Abbreviations:CGE, capillary gel electrophoresis;SDS, sodium dodecyl sulfate;D%, dextran concentration;B%, borate concentration;D/B, dextran/borate ratio;3D, three dimensional.
*Corresponding author. Horvath Csaba Memorial Laboratory of Bioseparation Sciences, Research Center for Molecular Medicine, Faculty of Medicine, Doctoral School of Molecular Medicine, University of Debrecen, 98 Nagyerdei Krt, Debrecen, H-4032, Hungary.
E-mail addresses:filep.csenge@med.unideb.hu(C. Filep),guttman@mik.uni-pannon.hu(A. Guttman).
Contents lists available atScienceDirect
Analytica Chimica Acta
j o u r n a l h o me p a g e : w w w . e l s e v i e r . c o m/ l o ca t e / a c a
https://doi.org/10.1016/j.aca.2021.338958
0003-2670/©2021 The Authors. Published by Elsevier B.V. This is an open access article under the CC BY-NC-ND license (http://creativecommons.org/licenses/by-nc-nd/4.0/).
molecular weights were used to more precisely assess the Mw of the samples and to obtain information about the molecular characteristics of the electromigrating SDS-protein complexes.
©2021 The Authors. Published by Elsevier B.V. This is an open access article under the CC BY-NC-ND license (http://creativecommons.org/licenses/by-nc-nd/4.0/).
1. Introduction
The rapidly growing biopharmaceutical industry requires rapid and high resolution separation of both thefirst generation (mAbs) and new modality protein therapeutics (fusion proteins, antibody drug conjugates, nanobodies, etc.) during production and release testing. Electricfield mediated separation methods of biologically important polymers, such as nucleic acids and SDS protein com- plexes, have long been routinely applied for molecular size esti- mation and purity analysis [1]. With the use of agarose or cross- linked polyacrylamide, gel electrophoresis became indispensable in biochemistry and molecular biology laboratories. For proteins, complexation with a charged surfactant, in most instances sodium dodecyl sulfate, is necessary (~1.4 g SDS/g protein) to diminish the effect of the intrinsic charge of the molecules with the goal to attain practically identical surface charge densities for their size based separation in sieving gels [2].
Capillary SDS gel electrophoresis (SDS-CGE) of proteins is a well- accepted separation method in the biomedical and biopharma- ceutical industry. It can be considered as an automated alternative to manual SDS polyacrylamide slab gel electrophoresis (SDS-PAGE), eliminating many of its disadvantages, making it an essential tool for high resolution analysis of proteins, based on their mass-charge, or rather hydrodynamic volume-charge ratio. Recent SDS-CGE product developments and method optimizations enabled this separation technique to be routinely applied in standard product release processes of therapeutic proteins. The most commonly used separation matrix for SDS-CGE today is borate cross-linked high molecular weight dextran polymer (2 M), covering the separation range of 10e225 kDa [3]. As a matter of fact, borate mediated reversible cross-linking of polysaccharides have long been used in various industrial applications [4]. Borate ions can form monomeric (1:1) and dimeric (2:1) high frequency lifetime complexes [5] with thecis-type diol groups of polymeric sugars, leading to gelation and viscosification during the adduct formation [6]. Dextran polymers are composed of a1-6 linked glucose units, in which case six- member borate complexes are formed [7].Scheme 1shows these possible boric acid adducts with monomeric (one sugar/one borate, D1/B1, left panel) and dimeric (two sugars/one borate, D2/B1, left panel) complexes [8]. The availability of the number of boric acid molecules and dextran chains defines the ratio of the monomeric
and dimeric adducts. The mainly D1/B1complex bearing negatively charged chains repel each other (Scheme 1, left panel), while with D2/B1 a high frequency cross-linked mesh is formed (Scheme 1, right panel).
The recent progress in the development of new modality protein therapeutics resulted in, among others, very effective fusion protein based drugs. Etanercept is one of these new modality dimeric fusion proteins, with a tumor necrosis factor alpha (TNFa) receptor bound to an Fc portion of an IgG molecule (Scheme 2) and mainly used to treat certain autoimmune diseases (e.g., rheumatoid arthritis, psoriasis, etc.) by inhibiting TNFa-induced pro- inflammatory activity [9]. Etanercept is highly glycosylated, with three N-linked glycosylation sites (two on the TNFaand one on the Fc parts) and thirteen O-linked glycosylation sites in the hinge re- gion [10], making its SDS-CGE analysis challenging.
In this paper we evaluate the effect of the dextran and borate concentration ratio on SDS-protein sieving for the analysis of a series of homologous polypeptides and a highly glycosylated therapeutic fusion protein. Three dimensional Ferguson plots were generated to understand the migration behavior of the solute molecules with 16 gel formulations. 3D selectivity surfaces were utilized for optimal gel composition determination of highly gly- cosylated proteins. Finally, KR plots were applied for molecular weight estimation of the new modality fusion protein.
Scheme 1. Dextran chain - boric acid adducts with monomeric (D1/B1, left) and dimeric (D2/B1, right) stoichiometry. Please note, that in case of D1/B1complexation, the negatively charged borate ions repel the neighbouring chains, while the D2/B1adducts reversibly cross-link them with high frequency.
Scheme 2.Structural representation of the etanercept subunit with two N-linked type glycosylation on the TNFapart and one on the Fc fusion region, as well as 13 O-linked sites in the hinge region.
2. Materials and methods 2.1. Chemicals
Sodium dodecyl sulfate (SDS), boric acid, dextran (2 M), Tris, 2- mercaptoethanol, EDTA.Na2, glycerol, mesityl oxide and HPLC grade water were from Sigma Aldrich (St. Louis, MO, USA). The SDS- MW Analysis Assay kit containing the internal standard (10 kDa), the SDS-MW Size Standard mixture (20e225 kDa), as well as the acidic (0.1 M HCl) and basic (0.1 M NaOH) wash solutions and the SDS-MW sample buffer of 100 mM Tris-HCl, 1% SDS (pH 9.0) was from SCIEX (Framingham, MA). The PNGase F enzyme was made in house. The therapeutic proteins of etarnercept were provided by the Medical School of University of Debrecen (Hungary).
2.2. Gel-buffer and sample preparation
The background electrolytes for the gel - buffer compositions consisted of increasing amounts of boric acid (2.0, 2.7, 3.3 and 4.0%, w/v) adjusted to pH 8.0 with Tris base, then EDTA (2 mM) and glycerol (10%, v/v) were added. Then 2 M dextran was added to obtain 2.0, 5.0, 7.5 and 10% (w/v)final concentrations, resulting in this way 16 different gel compositions. After overnight stirring, 0.2%
(w/v) sodium dodecyl sulfate was added and slowly stirred for an additional hour to prevent foaming and for complete dissolution.
Eighty microliters SDS-MW sample buffer, 2ml 10 kDa internal standard and 5ml 2-mercaptoethanol was mixed with 10ml (16 mg/
ml) of the molecular weight sizing standard. The therapeutic pro- tein sample was prepared in the same way as the MW sizing standard but 5 ml (10 mg/ml) of etanercept was mixed with its respective de-N-glycosylated version (5ml). For N-glycan removal, PNGase F (200mU) was used under the reaction conditions of 50C for 1 h. The samples were denatured by a gradient temperature protocol reported in Ref. [11] to minimize fragmentation artifacts.
2.3. Viscosity measurement
The viscosities of all 16 gel compositions were measured by utilizing the pressure system of the capillary electrophoresis in- strument. Mesityl oxide marker was injected at the inlet side (34 kPa/5 s), which was then pressurized by 138 kPa. The pressure mediated travelling time of the marker was measured at the detection window (UV 254 nm) and the viscosity values were calculated by the HagenePoiseuille equation [12].
2.4. Capillary SDS-Gel electrophoresis and EOF determination
In all capillary gel electrophoresis separation experiments, a PA800 Plus Pharmaceutical Analysis System (SCIEX) was used equipped with an UV absorbance detector. The detection wave- length was 220 nm. The separations were accomplished in 20 cm effective length (30 cm total length), 50 mm ID bare fused silica capillaries conditioned by rinsing with the basic wash solution for 3 min, the acidic wash solution for 1 min, HPLC grade water for 5 min, and the actual dextran-borate gels for 5 min at the beginning of each run. Reversed polarity separation mode was used by applying -15 kV electric potential at 25 C. The samples were electrokinetically injected: 5 kV for 10 s. All runs were made in triplicates and the 32 Karat software, version 10.1 (SCIEX) was used for data acquisition and processing.
The electroosmotic flows in all 16 gel compositions were determined based on the electromigration time of mesityl oxide (50 mM in HPLC-grade water). The separation capillary was conditioned and loaded with the actual gel buffer as described above. The EOF marker was injected by 20 s at 5 kV andþ15 kV
electric potential (normal polarity) was applied at 25C for the measurements as at the neutral pH of the background electrolytes, the EOF was cathodic. All EOF measurements were made in tripli- cates with detection at 254 nm wavelength.
3. Results and discussion
In this work, the migration properties of SDS-protein complexes are investigated in 16 different borate cross-linked dextran gel formulations to support our novel, three dimensional Ferguson plot based approach to explore the migration behavior and selectivity optimization for the solute molecules based on dextran/borate ra- tios. The resulting retardation coefficients were used to get a better understanding of the molecular characteristics of the non-PTM possessing molecular weight standards and the heavily glycosy- lated therapeutic fusion protein of etanercept.
3.1. Theory
The electrophoretic mobility (m) of a poly-ionic biopolymer with a net charge of Q was described by Chrambach [2] as:
m
¼ Q6
p
rh
(1)were,his the viscosity of the sieving matrix andris the radius of the analyte. For different shape solute molecules, the 6prterm can be replaced by the molecular weight (Mw) on various exponents such as Mw1/3as dimensional [13], Mw2/3as surface area [14] and Mw1/2
as radius of gyration equivalent [15], as well as by Mw1/6for cylin- drical shape molecules [16,17]. Considering the above, one can express the electrophoretic mobility of the charged poly-ion by equation(2), wherekrepresents the molecular characteristics:
m
¼ QMwk
h
(2)Unlike for constant charge bearing DNA and RNA molecules, protein analysis by SDS gel electrophoresis requires uniform sur- factant coverage by the average of one SDS molecule per 2 amino acids [18], expecting practically identical surface charge densities.
Any alteration from this ratio may influence electromigration, resulting in profiling and molecular size estimation uncertainty [19], which in most instances can be alleviated by utilizing the Ferguson plot approach [20,21]. The early Ogston model [13]
considered that in sodium dodecyl sulfate polyacrylamide gel electrophoresis (SDS-PAGE), the SDS-protein complexes migrated as un-deformable spherical objects through a porous sieving matrix suggesting a linear logarithmic mobility (m) vs gel concentration (T
%) relationship, referred to as the Ferguson plot, with the slope (KR) representing the retardation coefficient (m0 is the free solution mobility at zero gel concentration).
ln
m
¼lnm
0KRT% (3)A linear relationship was later proposed between the logarith- mic mobilities and the square root of the radius of the migrating analyte molecules by Rodbard, considering that in SDS-PAGE the retardation coefficient (KR) was proportional to the surface area of the spherically coiled molecules [22]. Others suggested that mo- lecular conformation changes may lead to a nonlinear Ferguson type relationship [23]. In other words, non-spherical particles produced nonlinear plots and concomitantly led to gel concentra- tion dependent KR changes, requiring extension of the original Ogston model [13].
Combining equations(2) and (3), one can express the retarda- tion coefficient by using such parameters as viscosity, molecular weight and net charge:
ln Q
Mwk
h
¼lnm
0KRT% (4)Rearranging equation(4)shows that at constant dextran con- centration, the retardation coefficient is a logarithmic function of the molecular weight (k exponent represents molecular charac- teristics), the viscosity and the free solution mobility, while a reciprocal logarithmic function of the molecular net charge.
KRT%¼lnMwk
h m
0Q (5)
KR¼ 1 T%ln
h m
0Q þ k
T%ln Mw (6)
Based on equation(6), by delineating the retardation coefficient (KR) as a function of the logarithmic molecular weight, from the slope of the resulting plot one could readily calculate the molecular characteristics (k), which was earlier reported as k¼1/6 for such cylindrical no PTM possessing objects as SDS-protein complexes [17]. The intersection of the Y axis, on the other hand, holds infor- mation about the effect of matrix viscosity and the net molecular charge. However,kmaybe shape dependent, e.g., in cases of heavily glycosylated or disulfide cross-linked intact proteins. Please note that the KRvalue is also separation parameter dependent, thus such factors as temperature, buffer composition (including pH and ionic strength) and dextran to borate ratio should be kept constant.
3.2. Effect of the dextran/borate ratio on the separation of SDS protein complexes
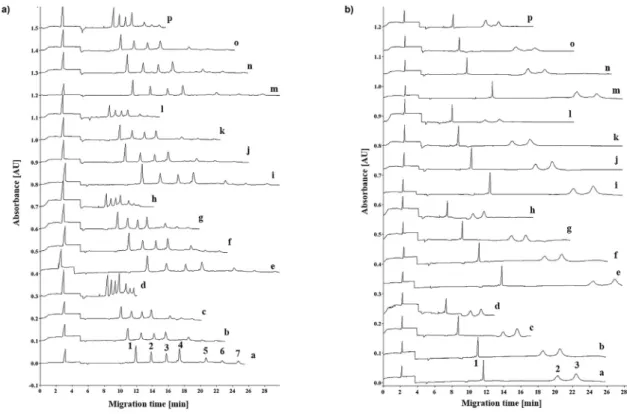
The effect of the dextran and borate concentration ratio was investigated on the separation of SDS proteins in 16 different gel compositions, including 2.0, 5.0, 7.5 and 10% dextran, each with 2.0, 2.7, 3.3 and 4.0% boric acid (Fig. 1). The dextran/borate ratios respectively ranged from 1.0-0.5, 2.5-1.25, 3.75-1.87 and 5.0-2.5 in the specified concentration ranges. The 10 kDa internal standard was co-injected in all runs for relative migration time calculation.
For the Mw standards (Fig. 1A), traces a-d, e-h, i-l and m-p com- pares the electropherograms obtained with the above described 16 gel formulations. In all quartets, the migration times and separation windows decreased with decreasing dextran concentration, but every single sample component were baseline separated from the flanking peaks. With decreasing borate concentration, on the other hand, e.g., a, e, i and m, etc., the separation window non- consistently varied, probably due to the interplay between the increasing counter-current electroosmotic flow affected by the borate concentration mediated ionic strengths and dextran con- centration facilitated viscosity, as discussed later in detail.
The effect of the dextran/borate concentration ratio was also investigated by separating the reduced regular and de-N- glycosylated forms of etanercept, using all 4x4 dextran and boric acid concentrations, as reported above. Fig. 1B compares the resulting separations, and similar to as inFig. 1A, baseline separa- tion of the three components were obtained with all gel compo- sitions. Again, the 10 kDa internal standard was co-injected in all runs. The separation times changed similarly to that of inFig. 1A, however, the 75 kDa etanercept subunit migrated at approximately at the same speed as the 150 kDa Mw standard, while its de-N-
Fig. 1. SDS-CGE separation of the Mw sizing ladder (panel A) as well as the mixture of the reduced regular and de-N-glycosylated etanercept subunits (panel B) in all 16 gel formulations. Traces: ae10%D/4%B; be7.5%D/4%B; ce5%D/4%B; de2%D/4%B; e10%D/3.3%B; fe7.5%D/3.3%B; ge5%D/3.3%B; he2%D/3.3%B; ie10%D/2.7%B; je7.5%D/2.7%B;
ke5%D/2.7%B; le2%D/2.7%B; me10%D/2%B; ne7.5%D/2%B oe5%D/2%B; pe2%D/2%B. Peaks: panel A: 1e10 kDa, 2e20 kDa, 3e35 kDa, 4e50 kDa, 5e100 kDa, 6e150 kDa, 7e225 kDa; panel B: 1e10 kDa, 2ede-N-glycosylated etanercept subunit (~70 kDa), 3eregular etanercept subunit (75 kDa). Conditions: bare fused silica capillary 20 cm (effective length, 30 cm total, 50mm ID); UV detection at 220 nm; E¼500 V/cm reversed polarity (cathode at the injection side); Separation temperature: 25C; Electrokinetic injection: 5 kV for 10 s.
glycosylated counterpart (~70 kDa) as the 100 kDa Mw standard.
This apparent migration time anomaly was expected since the protein sizing ladder (20e225 kDa) comprised of a series of ho- mogeneous polypeptides with very similar electrophoretic prop- erties and no post translational modifications [24], therefore, not always applicable to compare with modified proteins. As shown in Scheme 2, the etanercept subunits were variously glycosylated (NþO glycans on the regular and only O-glycans on the de-N- glycosylated form), resulting in bulkier structures at different levels than that of the no PTM possessing Mw standards. Please also note that the glycosylation part of the molecule, while increasing its Mw, it does not bind the surfactant, decreasing in this way the overall surface charge density and the concomitant electro- migration speed [25].
3.3. Considering the electroosmoticflow (EOF) and sieving matrix viscosity
To investigate the above mentioned assumption about the effect of electroosmoticflow and matrix viscosity,first the EOF mobilities were measured for all 16 dextran-borate gel-buffer formulations and plotted as a 3D graph inFig. 2A. The EOF mobilities exhibited a monotonically decreasing tendency, both with increasing dextran (increasing viscosity) and boric acid (increasing ionic strength) concentrations, showing the minimum value for the highest (10%
dextran/4% boric acid, D/B¼2.5) and the minimum with the lowest (2% dextran/2% boric acid, D/B¼1) dextran/borate containing gels.
These measured electroosmoticflow mobility (mEOF) values were used to adjust the actually measured apparent electrophoretic mobilities (mapp) for all peaks inFig. 1for each gel-buffer systems to obtain their effective (m) mobilities for the downstream 3D Fergu- son plot analysis. The counter current EOF mobilities (reversed polarity at neutral pH) had to be added to the measured electro- phoretic mobilities of the solute molecules to obtain their effective mobilities (m¼mappþmEOF) [26]. The relative migration times for all separations were calculated by dividing the EOF corrected migra- tion times of the peaks by the EOF corrected migration times of the 10 kDa internal standard.
Another interesting observation inFig. 1was that the apparent migration time shifts were not so significant, especially considering the 10x dextran/borate concentration ratio changes from D/B¼0.5 to D/B¼5. As afirst approximation, we considered this effect to be attributed to the interplay between the EOF and the viscosity of the different gel formulations. This latter showed monotonically decreasing tendencies with decreasing dextran and borate
concentrations, as shown inFig. 2B.
3.4. The 3D Ferguson plots
A novel three dimensional (3D) Ferguson plot concept is intro- duced to generate high information content mobility diagrams and shed light on the electromigration behavior of the various shape of SDS protein molecules. The logarithmic EOF corrected relative mobilities were plotted against the dextran concentration at different borate levels for all 16 gel compositions.Fig. 3shows the resulting 3D Ferguson plots for the 50 (A), 100 (B), 150 (C) and 225 (D) kDa protein standards, covering and even extending the range of the molecular weights of the regular and de-N-glycosylated versions of the etanercept subunits of (~70 and 75 kDa, respectively).
As one can observe, the electrophoretic mobilities of the Mw sizing components decreased with increasing dextran concentration at all borate levels. However, while at the low dextran concentration regime (2e5% dextran) the increasing borate concentration resulted in increasing mobilities (D/B¼1 to 0.5, in the range of 2%e4% borate, respectively), the opposite was observed at the higher dextran concentration regime (7.5e10%, D/B¼2.5 to 5 in the same borate concentration range). This suggested that the pore size of the borate cross-linked dextran sieving matrix decreased with decreasing borate concentration at low dextran levels (repelling effect), but increased at high dextran levels (cross-linking effect). The highest mobility, thus assumable the largest pore size, was observed with the D/B¼0.5 gel (2%D/4%B), while the smallest pore size and lowest mobility in the D/B¼2.5 dextran/borate compositions (10%D/4%B).
This was probably caused by the different amounts of D2/B1and D1/ B1 dextran/borate adduct formation (Scheme 1), defined by the actual boric acid concentration in the background electrolyte and the accessibility of the dextran chains. In other words, we consider that this phenomenon was based on the availability of borate molecules vs the number of dextran chains. At low dextran concentrations, the increasing amount of borate towards the D/B¼0.5 (2%D/4%B) may form more D1/B1adducts, leading to chain repelling mediated in- crease of the average pore size due to the elevated number of negatively charged borates on the dextran chains. At high dextran concentrations, on the other hand, the D/B ¼2.5 (10%D/4%B) gel featured lower EOF corrected effective mobility than that of the D/
B¼5 (10%D/2%B) composition, probably due to its smaller pore size.
The bending of the 3D surfaces was more pronounced for both the higher molecular mass Mw standards and the lower borate con- taining gel-buffers.
Fig. 2.Dextran/borate ratio mediated electroosmoticflow (A) and viscosity (B) changes in borate cross-linked dextran gel formulations in the range of 2e10% dextran and 2e4%
boric acid.
Very similar shape and distribution 3D Ferguson surfaces were obtained for the regular (i.e., fully glycosylated,Fig. 4A) and de-N- glycosylated (Fig. 4B) etanercept subunits. While the three N- linked glycans were removed by PNGase F digestion from this latter one, all 13 O-linked glycans were still present at the hinge region of the molecule due to the lack of general purpose O-glycosidases for their specific removal. Here again, at increasing borate concentra- tions the mobility slopes showed decreasing bending characteris- tics. The actual molecular weights of these two fusion protein subunits were very close (75 kDa for the regular subunit and
~70 kDa for its de-N-glycosylated counterpart), thus, the resulting
surfaces were practically parallel, suggesting different free solution mobilities (m0). Considering the logarithmic mobility axis of these diagrams, the relative separation of these two components should greater at the lower gel concentrations [1], as shown below.
3.5. Separation selectivity evaluation
The separation selectivity between the regular and de-N- glycosylated pair of etanercept subunits was plotted inFig. 5A. As emphasized above, these two similar Mw species assumable have different free solution mobilities due to the bulkier shape of the Fig. 3. Three dimensional Ferguson plots for the EOF corrected logarithmic relative electrophoretic mobilities as the function of dextran and borate concentrations for the 50 kDa (A), 100 kDa (B) and 150 kDa (C) and 225 kDa protein Mw standards.
Fig. 4.Three dimensional Ferguson plots for the EOF corrected logarithmic relative electrophoretic mobilities as the function of dextran and borate concentrations for the regular (i.e., glycosylated, Panel A) and de-N-glycosylated (Panel B) etanercept subunits.
fully glycosylated subunit and the consequently decreased SDS/
protein binding ratio because of the multiple glycan moieties on the molecule. In agreement with our earlier report on glycosylated and non-glycosylated monoclonal antibody fragment separation [7], dextran-borate-glycoprotein (D1/B1/Protein) complexation based retardation should also be considered in case of the fully (NþO glycans) and partially (O-glycans) glycosylated etanercept frag- ments. Therefore, as a combined effect of the decreased surface charge density and affinity interaction based retardation with the gel matrix, the highest selectivity value was obtained with the low concentration gel but limited chain repelling type D/B¼1 (2%D/2%
B) formulation. As Fig. 5A also shows, the selectivity values decreased in all other gel formulations, with both increasing dextran and borate concentrations. As mentioned above, the reg- ular etanercept subunit (Scheme 2) possesses three N-glycosylation sites and 13 O-glycosylation sites, all prone to form D1/B1/Protein adduct type dextran-borate-glycoprotein complexes with the sieving matrix chains. It can also be the case, but at a less extent, for the only O-glycosylated subunit, considering the interaction with the very short chain (mostly trimers) O-glycans.Fig. 5B shows the 3D selectivity plot for the 10 kDa internal standard vs de-N- glycosylated etanercept subunit, in which case the highest selec- tivity was attained with the D/B¼5 (10%D/2%B) gel composition, generally decreasing with decreasing dextran and increasing borate concentrations. In this instance, however, the observed selectivity change was the result of the size selectivity between the 10 kDa internal protein standard and 70 kDa de-N-glycosylated etanercept subunit, prevailing the actually weaker dextran-borate- glycoprotein interaction in the lower pore size gels.
The above mentioned dextran-borate-glycoprotein complexa- tion phenomenon was explained in great details in Ref. [7]. This complexation based retardation of the variously glycosylated eta- nercept subunits, on the other hand, explains their very slow electrophoretic mobilities depicted inFig. 1B, i.e., the regular sub- unit (75 kDa) apparently migrated approximately at the same po- sition as of the 2x larger 150 kDa protein standard. Likewise, in a lesser extent due N-glycan removal but still having all small O- linked linked sugars, the migration position of the de-N- glycosylated subunit (~70 kDa) around the 100 kDa standard, a little more than at 1.5x higher molecular weight.
3.6. The KR-plot
Because of the non-linearity of the 3D Ferguson surfaces, the KR
plot should be used for size (Mw) and molecular characteristics (k)
estimations. Based on equation(6), the KRvalues were plotted as the function of the logarithmic molecular weights (Fig. 6) with all cross-linker concentrations studied (2%e4% boric acid). The mo- lecular shape characteristics (k) values were derived from the slopes of the plots. With the use of 4% borate cross-linker con- centration, k was defined as 0.164, suggesting cylindrical molecular shape, in agreement with Ref [17]. However, with decreasing cross- linker concentration, the k value was decreasing, e.g., at 2% borate concentration k¼0.113, suggesting some shape changes of the SDS proteins during their electromigration through the lower cross- linked sieving matrix. From the 3D Ferguson plot inFig. 4, the KR values of the reduced regular and de-N-glycosylated etanercept were defined as 0.35 and 0.33. The corresponding Mw values were derived from the KR plot of the 10% D/4% B gel composition as shown in Fig. 6, and found 77.5 kDa (dotted line) and 68.9 kDa (dashed line) for the regular and de-N-glycosylated etanercept, respectively. Please note that these molecular weights were significantly closer to the literature values of 75 kDa and ~70 kDa, than that of the ones based on the apparent migration time of these fragments inFig. 1B, i.e., ~150 and ~100 kDa. On the other hand, when the 2% borate cross-linked were used, the similarly calculated Fig. 5.Three dimensional selectivity surfaces as the function of dextran and borate concentrations between the regular (i.e., glycosylated, Panel A) and de-N-glycosylated etanercept subunits as well as between the 10 kDa internal protein standard and the de-N-glycosylated etanercept fragment (Panel B).
Fig. 6.KRplot of the retardation coefficient as the function of the logarithmic mo- lecular weight of the protein Mw standards. The dotted and dashed lines show the Mw determination of the regular and de-N-glycosylated etanercept subunits, respectively, for the 4% and 2% gels. Symbols:C- 4.0%,--3.3%,:- 2.7%and X - 2.0% borate con- taining dextran gels.
values were 109 and 93 kDa. This large shift was probably due to the lower k value of 0.113 as mentioned above.
4. Conclusions
Borate cross-linked dextran gels allow size based capillary electrophoretic separation of SDS protein complexes, thus, routinely used in the biopharmaceutical industry for fast purity check and size heterogeneity determination. In this paper, the ef- fect of dextran and borate concentration ratios were examined on the separation of SDS proteins. Sixteen different borate cross-linked dextran gel formulation were studied by sodium dodecyl sulfate capillary gel electrophoresis, using the molecular weight sizing standard and subunits of a fusion protein. At any given borate concentration, the separation times decreased with decreasing dextran concentration, but still allowed baseline separation for every component. At a given dextran concentration, on the other hand, the change in borate concentration had less effect on migration times, probably due to the interplay between EOF and viscosity. Using the 3D Ferguson plot concept, introduced in this paper, one can readily assess the migration behavior of the sepa- rating SDS protein molecules in respect to the effect of dextran and borate ratio. Therefore, this approach helps to choose of the proper dextran/borate concentration ratio to address the separation problem in hand.
The separation selectivity between the regular and de-N- glycosylated pairs of etanercept subunits was plotted as the func- tion of borate and dextran concentrations. Best selectivity was attained with the 2%D/2%B gel composition. Molecular weight estimation of the etanercept subunits was not satisfactory by a simple comparison of the apparent migration times to the protein ladder peaks. This discrepancy was alleviated with the use of the KR
plot of retardation coefficient versus logarithmic molecular weight, based on the Ferguson data. The KR plot provided cross-linker concentration dependent molecular weight estimation with the slopes representing the molecular characteristics (k) for the different formulations.
Funding
Direct funding is not applicable.
Ethical approval
Ethical approval is not applicable.
Informed consent
Informed consent is not applicable.
CRediT authorship contribution statement
Csenge Filep:Writingeoriginal draft, Investigation, Method- ology.Andras Guttman:Supervision, Writingereview&editing.
Declaration of competing interest
The authors declare that they have no known competing financial interests or personal relationships that could have appeared to influence the work reported in this paper.
Acknowledgment
This work was supported by the TKP2020-IKA-07 project financed under the 2020-4.1.1-TKP2020 Thematic Excellence
Programme by the National Research, Development and Innovation Fund of Hungary. The authors also gratefully acknowledge the support of the BIONANO_GINOP-2.3.2-15-2016-00017 project and the V4-Korea Joint Research Program, project National Research, Development and Innovation Office (NKFIH) (NN 127062) grants of the Hungarian Government, the ÚNKP-20-3-II-DE-294 New Na- tional Excellence Program of the Ministry for Innovation and Technology and the EFOP-3.6.3-VEKOP-16-2017-0000 9 project co- financed by EU and the European Social Fund. This is contribution
#186 from the Horvath Csaba Memorial Laboratory of Bio- separation Sciences.
References
[1] A.T. Andrews, Electrophoresis, Theory, Techniques and Biochemical and Clinical Applications, second ed., Claredon Press Oxford, Oxford, England, 1986.
[2] A. Chrambach, The Practice of Quantitative Gel Electrophoresis, VCH, Deerfield Beach, FL, USA, 1985.
[3] L. Geurink, E. Tricht, J. Dudink, B. Pajic, C.E. S€angerevan de Griend, Four-step approach to efficiently develop capillary gel electrophoresis methods for viral vaccine protein analysis, Electrophoresis 42 (2021) 10e18,https://doi.org/
10.1002/elps.202000107.
[4] P.C. Harris, Chemistry and rheology of borate-crosslinkedfluids at tempera- tures to 300F, J. Petrol. Technol. 45 (1993) 264e269.
[5] E. Pezron, A. Ricard, L. Leibler, Rheology of galactomannan-borax gels, J. Polym. Sci., Part B: Polym. Phys. 28 (1990) 2445e2461.
[6] S.W. Sinton, Complexation chemistry of sodium borate with poly(vinyl alcohol) and small diols: a boron-11 NMR study, Macromolecules 20 (1987) 2430e2441,https://doi.org/10.1021/ma00176a018.
[7] C. Filep, A. Guttman, Effect of the monomer cross-linker ratio on the separa- tion selectivity of monoclonal antibody subunits in sodium dodecyl sulfate capillary gel electrophoresis, Anal. Chem. (2021), https://doi.org/10.1021/
acs.analchem.0c04927.
[8] P. Sacco, F. Furlani, S. Paoletti, I. Donati, PH-assisted gelation of lactose- modified chitosan, Biomacromolecules 20 (2019) 3070e3075, https://
doi.org/10.1021/acs.biomac.9b00636.
[9] M.M. Goldenberg, Etanercept, a novel drug for the treatment of patients with severe, active rheumatoid arthritis, Clin. Therapeut. 21 (1999) 75e87,https://
doi.org/10.1016/S0149-2918(00)88269-7.
[10] S. Houel, M. Hilliard, Y.Q. Yu, N. McLoughlin, S.M. Martin, P.M. Rudd, J.P. Williams, W. Chen, N- and O-glycosylation analysis of etanercept using liquid chromatography and quadrupole time-of-flight mass spectrometry equipped with electron-transfer dissociation functionality, Anal. Chem. 86 (2014) 576e584,https://doi.org/10.1021/ac402726h.
[11] M. Szigeti, A. Guttman, Sample preparation scale-up for deep N-glycomic analysis of human serum by capillary electrophoresis and CE-ESI-MS, Mol.
Cell. Proteomics 18 (2019) 2524e2531, https://doi.org/10.1074/
mcp.TIR119.001669.
[12] A. Allmendinger, L.H. Dieu, S. Fischer, R. Mueller, H.C. Mahler, J. Huwyler, High-throughput viscosity measurement using capillary electrophoresis instrumentation and its application to protein formulation, J. Pharmaceut.
Biomed. Anal. 99 (2014) 51e58,https://doi.org/10.1016/j.jpba.2014.07.005.
[13] A.G. Ogston, The spaces in a uniform random suspension offibres, Trans.
Faraday Soc. 54 (1958) 1754e1757.
[14] R.E. Offord, Electrophoretic mobilities of peptides on paper and their use in the determination of amide groups, Nature 211 (1966) 591e593, https://
doi.org/10.1038/211591a0.
[15] E.C. Rickard, M.M. Strohl, R.G. Nielsen, Correlation of electrophoretic mobil- ities from capillary electrophoresis with physicochemical properties of pro- teins and peptides, Anal. Biochem. 197 (1991) 197e207, https://doi.org/
10.1016/0003-2697(91)90379-8.
[16] L. He, B. Niemeyer, A novel correlation for protein diffusion coefficients based on molecular weight and radius of gyration, Biotechnol. Prog. 19 (2003) 544e548,https://doi.org/10.1021/bp0256059.
[17] C. Filep, A. Guttman, The effect of temperature in sodium dodecyl sulfate capillary gel electrophoresis of protein therapeutics, Anal. Chem. 92 (2020) 4023e4028,https://doi.org/10.1021/acs.analchem.9b05566.
[18] K. Shirahama, K. Tsujii, T. Takagi, Free-boundary electrophoresis of sodium dodecyl sulfate-protein polypeptide complexes with special reference to SDS- polyacrylamide gel electrophoresis, J. Biochem. 75 (1974) 309e319,https://
doi.org/10.1093/oxfordjournals.jbchem.a130398.
[19] G. Hunt, W. Nashabeh, Capillary electrophoresis sodium dodecyl sulfate nongel sieving analysis of a therapeutic recombinant monoclonal antibody: a biotechnology perspective, Anal. Chem. 71 (1999) 2390e2397,https://doi.org/
10.1021/ac981209m.
[20] K.A. Ferguson, STARCH-GEL ELECTROPHORESIS–APPLICATION to the classifi- cation OF pituitary proteins and polypeptides, Metabolism 13 (Suppl) (1964) 985e1002,https://doi.org/10.1016/s0026-0495(64)80018-4.
[21] W.E. Werner, D.M. Demorest, J. Stevens, J.E. Wiktorowicz, Size-dependent
separation of proteins denatured in SDS by capillary electrophoresis using a replaceable sieving matrix, Anal. Biochem. 212 (1993) 253e258.
[22] D. Rodbard, A. Chrambach, Unified theory for gel electrophoresis and gel filtration, Proc. Natl. Acad. Sci. U. S. A. 65 (1970) 970e977,https://doi.org/
10.1073/pnas.65.4.970.
[23] J.K. Bryan, Molecular weights of protein multimers from polyacrylamide gel electrophoresis, Anal. Biochem. 78 (1977) 513e519,https://doi.org/10.1016/
0003-2697(77)90111-7.
[24] E.M.D. Millipore, Protein Markers 10-225 kDa, Protein Markers 10-225 KDa.
BIO-69079, 2019. EMD_BIO-69079, http://www.emdmillipore.com/US/en/
product/Perfect-Protein-Markers-10-225-kDa.
[25] R.R. Rustandi, M.W. Washabaugh, Y. Wang, Applications of CE SDS gel in development of biopharmaceutical antibody-based products, Electrophoresis 29 (2008) 3612e3620,https://doi.org/10.1002/elps.200700958.
[26] P.D. Grossman, J.C. Colburn, H.H. Lauer, A semiempirical model for the elec- trophoretic mobilities of peptides in free-solution capillary electrophoresis, Anal. Biochem. 179 (1989) 28e33, https://doi.org/10.1016/0003-2697(89) 90195-4.