Elsevier Editorial System(tm) for Journal of Chromatography A Manuscript Draft
Manuscript Number:
Title: Ultrafast haplotyping of putative microRNA-binding sites in the WFS1 gene by multiplex PCR and capillary gel electrophoresis
Article Type: MSB 2012
Keywords: WFS1 gene; miRNA-binding site; haplotype; SNP; double-tube allele-specific PCR; capillary gel electrophoresis
Corresponding Author: Professor Andras Guttman,
Corresponding Author's Institution: University of Debrecen First Author: Marta Kerekgyarto
Order of Authors: Marta Kerekgyarto; Nora Nemeth; Tamas Kerekes; Zsolt Ronai; Andras Guttman Suggested Reviewers: Julia Khandurina PhD
Senior scientist, Genomatica jkhandurina@genomatica.com Genomic expertises
Huba Kalasz PhD
Professor , United Arab Emirates University huba.huba.kalasz@gmail.com
Separation science Eva Szoko PhD
Professor , Semmelweis University eva.szoko@net.sote.hu
Capillary electrophoresis expertises Opposed Reviewers:
Highlights
• Simultaneous haplotyping of two miRNA-binding sites in the WSF1 is presented.
• A combination allele-specific amplification and capillary electrophoresis was used.
• Ultra-fast size determination of the generated PCR fragments was done by CGE.
• Excellent detection limit of 2 ng/ml was demonstrated.
*Highlights (for review)
1
Ultrafast haplotyping of putative microRNA-binding sites in the WFS1 gene
1
by multiplex PCR and capillary gel electrophoresis
2 3
Márta Kerékgyártóa, Nóra Némethb, Tamás Kerekesc, Zsolt Rónaib and András Guttmana*
4 5
aHorváth Laboratory of Bioseparation Sciences, University of Debrecen, H-4032 Debrecen, 6
Nagyerdei krt. 98, Hungary; bDepartment of Medical Chemistry, Semmelweis University, H- 7
1094 Budapest, Tuzolto u. 37-47, Hungary; cCentre for Clinical Genomics and Personalized 8
Medicine, Medical and Health Science Center, University of Debrecen, H-4032 Debrecen, 9
Nagyerdei krt. 98, Hungary 10
11
* To whom correspondence should be addressed: Phone: +36(52) 414-717/64182; Fax: +36 (52) 12
414-717/55539; E-mail: guttman.andras@hlbs.org 13
14 15
ABSTRACT 16
The transmembrane protein wolframin (WSF1) plays a crucial role in cell integrity in pancreatic 17
beta cells and maintaining ER homeostasis. Genetic variations in the WFS1 gene have been 18
described to be associated with Wolfram syndrome or type 2 diabetes mellitus. In this paper we 19
report on an efficient double-tube allele-specific amplification method in conjunction with 20
ultrafast capillary gel electrophoresis for direct haplotyping analysis of the SNPs in two 21
important miRNA-binding sites (rs1046322 and rs9457) in the WFS1 gene. An automated 22
single-channel capillary gel electrophoresis system was utilized in the method that provided 23
dsDNA fragment analysis in less than 240 sec. The light-emitting diode induced fluorescence 24
(LEDIF) detection system enabled excellent sensitivity for automated haplotyping of a large 25
number of clinical samples. The detection limit was 0.002 ng/µL using field amplified injection 26
from water diluted samples. The dynamic quantitation range was 0.08 - 10.00 ng/µL (R2=0.9997) 27
in buffer diluted samples.
28 29 30
Keywords: WFS1 gene; miRNA-binding site; haplotype; SNP; double-tube allele-specific PCR;
31
capillary gel electrophoresis 32
33
1. Introduction 34
35
Wolframin (WFS1) is a transmembrane protein in the endoplasmic reticulum (ER), which is 36
produced at higher levels in pancreatic beta cells and specific neurons in the central nervous 37
system [1]. It plays an important role in the ER calcium homeostasis [1-3] and in the ER stress 38
response [4]. As an ER stress signaling suppressor it affects the negative regulatory feedback 39
loop of the ER stress signaling network [5], which is strictly controlled in pancreatic beta cells to 40
produce adequate amounts of insulin in case of blood glucose levels fluctuation [6,7]. Moreover 41
*Manuscript
Click here to view linked References
2
it plays an essential role in the cell integrity of pancreatic beta cells and maintains ER 42
homeostasis [8]. When the wolframin gene (WFS1) is inactivated in beta cells of rodents it 43
causes ER stress and death of the beta cells by accelerated apoptosis [9]. Mutations in the WFS1 44
gene are causing the so called Wolfram syndrome [10], which includes young onset non- 45
autoimmune insulin dependent diabetes mellitus, diabetes insipidus, optic atrophy, deafness or 46
other neurological and endocrine abnormalities [11,12]. An increased prevalence of diabetes 47
mellitus in reference to Wolfram syndrome was reported in first-degree relatives of patients [13], 48
suggesting a probable effect of WSF1 mutation heterozygosis. The occurrence of single 49
nucleotide polymorphisms (SNPs) in WFS1 has recently been demonstrated to be associated 50
with type 2 diabetes mellitus in populations of European descents [14-16].
51 52
MicroRNAs are non-coding short ribonucleic acids, which are responsible for the translation 53
regulation of gene expression. The homeostatic protein level is modified due to the interaction 54
between miRNAs and its targets, resulting in possible phenotype changes, such as disease. This 55
modified interaction can be caused by SNPs either in the gene of the miRNA or its target. SNPs 56
are rare in miRNA-coding genes [17] and referred to as miRSNPs. They were shown to be 57
associated with different illnesses, such as various types of cancers [18], autoimmune diseases 58
[19], or neurological disorders [20].
59 60
Multiplex PCR techniques gained recent popularity in assessing genetic variation by 61
simultaneous analysis of two or more DNA regions or genetic variations of interest [21,22].
62
Development of a multiplex PCR reaction involves the design of the relevant primer sets and 63
examination of their various combinations, different reaction components and/or thermal cycling 64
conditions. Multiplexing in this way increases the throughput of the amplification steps 65
especially when capillary gel electrophoresis is utilized with rapid separation and quantitation 66
capability for the analysis of the resulting fragments [23]. Multiplexing on the other hand may 67
lead to unequal amplification, particularly at the larger DNA fragment range, so the above 68
mentioned reaction design is of high importance [24].
69 70
Simultaneous study of multiple polymorphisms, such as haplotyping, is getting more and more 71
attention to analyze the genetic background of complex diseases [25]. Haplotype, the relative 72
chromosomal localization of the alleles of the polymorphic loci, can serve as very effective 73
genetic markers [26]. Haplotype identification can be accomplished by several ways. One of the 74
oldest methods is based on the theory of Mendelian inheritance of families or larger pedigrees;
75
however, this approach has several drawbacks [27,28]. Other methods, such as computer-based 76
haplotype prediction can also be suitable for haplotypes determination, but haplotypes of 77
individual samples cannot be obtained by this approach [28,29]. Direct haplotype determination 78
by allele-specific amplification (ASA), also referred to as molecular haplotyping, is one of the 79
most efficient and reliable methods that is based on appropriate amplification providing the 80
required haplotype information without the need of biological parents’ genotype information 81
[30]. Moreover this technique provides fast and reliable genotyping data of any SNP in a single 82
3
tube polymerase chain reaction (mPCR) followed by electrophoresis analysis [31,32]. This 83
amplification method is based on the use of an allele-specific primer as its 3’-end hybridizes to 84
the SNP site. This is followed by amplification using a DNA-polymerase enzyme, which is 85
lacking 3’-exonuclease activity, thus, amplification can only be carried out in the case the primer 86
completely matches with the template. The technique when two allele-specific primers are used 87
for convenient allelic variant determination in two separate reactions is referred to as double-tube 88
specific-allele amplification [33]. This novel haplotyping technique was introduced earlier to 89
investigate the -616CG and -521CT SNPs in the Dopamine D4 Receptor gene by Szantai et al 90
[24]. The resulting DNA fragments after the amplification process are regularly analyzed by 91
conventional agarose/polyacrylamide slab gel electrophoresis for genotype or haplotype 92
determination. However, these methods are labor intensive and time consuming, also requiring 93
improvements in terms of resolving power and analysis throughput. Recent developments in the 94
field of capillary gel electrophoresis resulted in rapid electrophoresis-based fragment analysis 95
techniques that can readily speed up this process. In addition to its speed, capillary gel 96
electrophoresis offers further advantages over traditional slab gel electrophoresis, such as low 97
reagent consumption, small sample volume requirement and the option of multiplexing [30].
98
CGE combined with light-emitting diode induced fluorescence (LEDIF) detection enables 99
sensitive detection of dsDNA fragments and can be readily applied for automated large scale 100
analyses in clinical settings [34].
101 102
In this paper we report on haplotyping (i.e., simultaneous multiple genotyping) of two adjacent 103
putative miRNA-binding SNPs in the WFS1 gene by combining double-tube allele-specific 104
amplification and rapid capillary gel electrophoresis with LED-induced fluorescent detection to 105
analyze the resulting DNA fragments. The detection limit of the method was as low as 0.002 106
ng/µL using field amplified injection method.
107 108
2. Materials and Methods 109
2.1. Chemicals 110
The HotStar Taq DNA polymerase including the 10 reaction buffer and the Q-solution was 111
used from Qiagen (Valencia, CA, USA) for the allele-specific PCR reaction. The oligonucleotide 112
primers were obtained from Sigma Genosys (Woodlands, TX, USA). For agarose slab gel 113
electrophoresis, the 100 base pair DNA ladder (GeneRuler, Thermo Fisher Scientific, FL, USA) 114
was diluted to a final concentration of 0.5 µg/µL and stored at –20 °C. In CGE separations, the 115
Qsep100 DNA-CE high-resolution gel buffer and Qsep100 DNA-CE running buffer were used 116
(BiOptic, New Taipei City, Taiwan). The DNA alignment marker (20 base pair, 1.442 ng/µL and 117
5000 base pair, 1.852 ng/µL) and the DNA size marker (50–3000 bases, 10.5 ng/µL) were from 118
BiOptic and stored at –20 °C. The WFS1 PCR samples (576 bp, 253.19 ng/µL) were diluted to 119
the appropriate concentrations with MilliQ-grade water (Millipore, Billerica, MA, USA) or 120
dilution buffer (BiOptic) for the detection limit and linearity studies and stored at –20 °C.
121 122
4
2.2. Non-invasive DNA sampling and DNA extraction 123
DNA samples were obtained using non-invasive DNA sampling (buccal swabs) from healthy 124
Hungarian volunteers. The study protocol was approved by the Scientific and Research Ethics 125
Committee of the Medical Research Council of Hungary (ETT TUKEB). DNA samples were 126
purified by standard procedure as described earlier [35,36].
127 128
2.3. Molecular haplotype analysis 129
Direct haplotype determination of the rs1046322 and rs9457 SNPs was carried out by allele- 130
specific amplification. The HotStarTaq polymerase kit (Qiagen) was used for the PCR 131
amplification and each DNA sample was analyzed in two separate reactions. Both reaction 132
mixtures contained approximately 4 ng gDNA template, 200 µM deoxyadenosine triphosphate 133
(dATP), deoxycitidine triphosphate (dCTP), deoxyguanosine triphosphate (dGTP) and 134
deoxythymidine triphosphate (dTTP), 0.5 U HotStar Taq DNA polymerase with 1 reaction 135
buffer and 1 Q-solution, as well as 1 µM of each outer primer (sense: 5’ TCT GTC CAC TCT 136
GAA TAC 3’ and antisense: 5’ CAG GCT CTT CTA AAC ACT 3’). Reaction mixture-I was 137
used to analyze the presence of the rs1046322A and rs9457C alleles, as well as their haplotype, 138
thus it contained the rs1046322A specific sense (5’ GAG CCT GAC CTT TCT GAA 3’) and the 139
rs9457C specific antisense (5’ CCA CTA CCT GCT GGA G 3’) primers. Reaction mixture-II 140
was employed to investigate the other possible variants (rs1046322G-specific sense primer: 5’
141
GAG CCT GAC CTT TCT GAG 3’, rs9457G-specific antisense primer: 5’ CCA CTA CCT 142
GCT GGA C 3’). PCR amplification reactions were carried out in a total volume of 10 µL. The 143
primers were tested by the Oligo 5.0 software (Molecular Biology Insides, Cascade, CO, USA).
144
Thermocycling was initiated at 95 °C for 15 min, this step also served for the activation of the 145
hot-start DNA polymerase. It was followed by 40 cycles of denaturation at 94 °C for 30 s, 146
annealing at 55 °C for 30 s and then extension at 72 °C for 1 min. The last step of the 147
amplification was a final extension at 72 °C for 10 min after that the PCR products were kept at 148
8 °C.
149 150
For the detection limit and linearity studies, the PCR reaction mixture contained approximately 4 151
ng gDNA template, 200 µM of each deoxyribonucleotide triphosphate (dATP, dCTP, dGTP and 152
dTTP), 0.05 U/µL HotStar Taq DNA polymerase with 1 reaction buffer and 1 Q-solution, as 153
well as 1 µM of each primer (sense: 5’ GCC CTT CTC GAG TCT TGC AGC GCC GGA ATA 154
GGC 3’ and antisense: 5’ GCA GAA GCT TAA GTT GTT CGG GAG CAG CTG AAC G 3’).
155
The amplification reaction was carried out in a total volume of 100 µL. The first step was the 156
initial denaturation of the gDNA at 95 °C for 15 min; it was followed by 40 cycles of 157
denaturation (94 °C, 30 sec), annealing (65 °C, 30 sec) and then extension (72 °C, 1 min). The 158
last step of the PCR was a final extension at 72 °C for 10 min after that the sample was kept at 8 159
°C.
160 161 162
5
2.4. PCR- fragment analysis by agarose slab gel electrophoresis 163
The PCR products were first analyzed by agarose slab gel electrophoresis. Agarose powder (final 164
concentration: 2% w/v) was mixed with electrophoresis buffer (1 TAE buffer; 40 mM Tris, 20 165
mM acetic acid, and 1 mM EDTA, pH 8.0) and heated until the agarose completely dissolved.
166
Ethidium bromide was added to the melted gel in a final concentration of 0.5 µg/mL. After 167
solidification at room temperature, 20 ng of PCR products and the 100 bp DNA sizing ladder 168
(100–1000 bp, 0.5 µg/uL) containing DNA loading Dye (6 loading Dye: 10 mM Tris-HCl (pH 169
7.6), 0.03% bromophenol blue, 0.03% xylene cyanol FF, 60% glycerol and 60 mM EDTA) were 170
loaded into the sample wells followed by electrophoresis (100 V for 45 min, BioRad PowerPac 171
300; Hercules, CA, USA). The separated DNA bands were visualized in a UV light box (Bio 172
Rad Gel-Doc XR System).
173 174
2.5 PCR- fragment analysis by capillary gel electrophoresis 175
Rapid capillary gel electrophoresis analysis of the PCR-products were accomplished in a single- 176
channel capillary cartridge Qsep100 DNA-CE unit (BiOptic) with an 11 cm effective length 177
(total length: 15 cm) fused silica capillary (internal diameter: 75 µm). The capillary was washed 178
with 5 mL of 70 °C MilliQ-grade water (Millipore) for 500 s before the first use. Then 5 mL of 179
Qsep100 DNA-CE high-resolution gel buffer was transferred into the gel reservoir and the 180
capillary was purged twice for 1000 s. The gel-buffer system contained ethidium-bromide to 181
accommodate fluorescent detection. Prior to each injection the sieving matrix was replaced in the 182
capillary by means of a 10 s purge step, followed by injection of the DNA alignment marker (4 183
kV for 10 s). After that the separation capillary was immersed into MilliQ-grade water (0 kV for 184
1 sec) as a washing step to avoid any sample cross-contamination. The samples (as well as the 185
DNA size marker and/or PCR-products) were introduced electrokinetically from a 96-well plate 186
(4 kV for 10 s). Separations were carried out at ambient temperature by applying 6 kV electric 187
potential. Data analysis was performed using the Q-Expert software package (BiOptic). All 188
buffers and reagents were filtered through 0.22 µm pore size Acrodisc syringe filters (Millipore, 189
Billerica, MA, USA) and degassed prior to use. Other reagents and chemicals for sample 190
preparation were purchased from Sigma-Aldrich (St. Louis, MO, USA).
191 192
3. Results and Discussion 193
3.1. Direct haplotype determination by allele-specific PCR 194
Haplotype determination of adjacent polymorphic loci is of high importance, especially in case 195
of SNPs with biological significance. The rs9457 and rs1046322 SNPs, located in the WFS1 196
gene 3’ UTR, are assumable miR-SNPs and their in silico data analysis suggested that they may 197
alter the binding of miR-185 and miR-668, respectively. Consequently in case of double 198
heterozygote samples (rs1046322AG and rs9457CG) haplotype determination is essential, since 199
otherwise it is uncertain if the two allelic variants possibly affecting miRNA-binding are located 200
on the same mRNA (“cis”) or can be found on two different chromosomes (“trans”) as 201
delineated in Figure 1.
202
6
An allele-specific PCR based approach was elaborated for the haplotype determination of the 203
two SNPs of interest. The principle of the technique was the simultaneous application of two 204
outer and two allele-specific primers in a multiplex PCR reaction as shown in Figure 2. The 205
allele-specific primers were designed to anneal to the SNP by their 3’ end. Based on 206
chromosomal localization, a sense rs1046322- and antisense rs9457-specific primer were applied 207
in the reaction. One reaction mixture tested the presence of one allele at each loci as well as one 208
haplotype combination, consequently two reaction mixtures were required for genotype and 209
haplotype determination, whereas further two can be applied for conformation (Figure 2). Panel 210
A in Figure 2 depicts the analysis using reaction mixture-I containing the sense rs1046322A- and 211
the antisense rs9457C-specific primers. In case of the presence of an A allele at the rs1046322 212
site, a 488-bp-long fragment was generated by the rs1046322A-specific and the antisense outer 213
primers. Similarly if the sample possessed the C allele at the rs9457 locus, the primer specific for 214
this variant together with the sense outer primer could amplify a 437-bp-long fragment. More 215
importantly, if the rs1046322A and rs9457C alleles are located on the same chromosome, a 384- 216
bp-long product could also be observed as this product is generated by the two allele-specific 217
primers and suggested the presence of the A–C haplotype. The longest, 541-bp outer fragment is 218
a control product synthesized independently of the genotype and haplotype of the sample of 219
interest.
220 221
Reaction mixture-II worked similarly; however, it contained the rs1046322G- and rs9457G- 222
specific primers in combination with the outer oligos as shown Figure 2 Panel B. Thus, a 488-bp- 223
long product could be observed in case of the rs1046322G allele, a 437-bp-long product 224
produced if the rs9457G allele was present, whereas the 384-bp-long product suggested the G–G 225
haplotype. Genotype and haplotype information could be unambiguously determined by these 226
two reactions. For additional validation, two redundant combinations were also applied in a 227
subset of 24 samples (i.e. rs1046322G allele-, rs9457C allele- and thus G–C haplotype specific 228
reaction and rs1046322A allele-, rs9457G allele- and consequently A–G haplotype specific 229
mixture). Results of these analyses confirmed the data obtained by the original setup. Then 95 230
healthy Hungarian individuals were analyzed by the described method and the obtained results 231
were in 98.9% concordance with the genotype data determined earlier by an independent 232
approach employing sequence specific TaqMan probes (data not shown). The single discordant 233
result could be resolved by a repeated genotype and haplotype determination.
234 235
Figure 2 Panel C shows the conventional agarose slab gel electrophoresis based genotype and 236
haplotype determination of the rs9457 and rs1046322 SNPs in case of double heterozygote 237
samples. The 100 bp DNA sizing marker (M) was used with the PCR samples (1 and 2) to assess 238
the size of the double allele-specific amplicons in the case of both haplotypes verification. One 239
of the haplotype (rs104632A-rs9457C) was labeled with A and the other (rs104632G-rs9457G) 240
was indicated with B in Figure 2 Panel C.
241 242
7
3.2. Haplotype determination by capillary gel electrophoresis 243
The final step of the haplotyping protocol was capillary gel electrophoresis based size 244
determination of the dsDNA fragments from the multiplex amplification reaction. Figure 3 245
depicts the capillary gel electrophoresis traces of the PCR fragments generated during haplotype 246
determination. A DNA sizing ladder in the range of 50–3000 bp was used for fragment size 247
assessment in a final concentration of 10.5 ng/µL (upper trace). The analysis of the mPCR 248
samples is shown in the middle and lower traces. The samples were coinjected with the lower 249
and upper alignment markers (M1: 20 bp dsDNA and M2: 5000 bp dsDNA) to attain high 250
fragment sizing accuracy. The middle trace in Figure 3 shows the separation of three dsDNA 251
fragments from the multiplex amplification reaction mixture-1 with calculated sizes of 454, 500 252
and 583 bp fragments, corresponding to 437, 488 and 541 bp of the actual PCR reactions (see 253
variance data in Table 1). The lower trace in Figure 3 depicts the separation of four dsDNA 254
fragments from amplification reaction mixture-2 with calculated sizes of 399, 457, 504 and 591 255
bp fragments (corresponding to the actual fragment sizes of 384, 437, 488 and 541 bp with better 256
than 95% average accuracy) by the rapid CE-LEDIF based method (see variance data in Table 257
1). In Table 1 the size (bp) of each multiplex PCR sample was calculated by Q-Expert software 258
package (BiOptic) with the accuracy range of 2.4–9.2%. Furthermore the concentration of each 259
DNA fragment was calculated based on their peak areas as listed in Table 1.
260 261
3.3. Limit of detection (LOD) and detector linearity 262
Figure 4, Panel A compares the resulting signal from the electropherograms after the injection of 263
different concentration samples from 0.01 ng/ µL to as low as 0.002 ng/µL, this latter being the 264
detection limit. In this instance the dilution of the 576 bp DNA fragment was done in water.
265
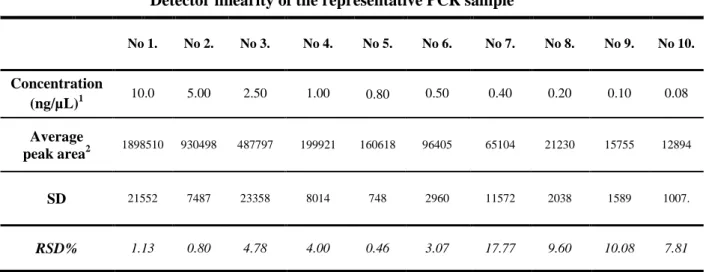
When the detector linearity experiments were conducted with the same water diluted samples, 266
the linear detection range was quite narrow (1.5 orders of magnitude) due to the effect of field 267
amplification. Detection linearity was therefore determined by using a dilution series in sample 268
buffer (BiOptic) in which case a linear detector response was obtained in a large interval of 0.08 269
ng/µL to 10.0 ng/ µL with an R2 = 0.9997, as shown in Figure 4, Panel B and in Table 2. Again, 270
we would like to emphasize that injection from water diluted samples results in much larger 271
sample intake as the buffer co-ions do not compete with the sample molecules, resulting in 272
excellent LOD. Sample concentration measurement on the other hand was more precise from 273
buffer diluted samples as shown in Table 1.
274 275
4. Conclusions 276
Capillary gel electrophoresis is an automated, high-throughput DNA fragment analysis method 277
that can be readily applied for the investigation of a large number of samples. In this paper we 278
introduced a rapid CE-LEDIF based method in conjunction with multiplex PCR amplification for 279
genotyping and haplotyping of two important, adjacent miRNA-binding sites (rs1046322 and 280
rs9457) in the WSF1 gene. The separation performance of the system was demonstrated by 281
ultrafast (<240 sec) and accurate (2.4–9.2%) sizing analysis of multiplex PCR samples, also 282
exhibiting excellent detector linearity (R2=0.9997) from 0.08–10.0 ng/µL concentration. The 283
8
LOD of the system was 0.08 ng/µL for samples in dilution buffer and 0.002 ng/µL for samples in 284
water. In summary, this CGE-LEDIF system is a sensitive and easy to use bio-analytical tool for 285
automated haplotyping of a large number of clinical samples.
286 287
5. Acknowledgements 288
This project was supported by the Hungarian Grant OTKA grants of K81839 and K83766 as 289
well as the János Bolyai Research Scholarship (BO/00089/10/5) of the Hungarian Academy of 290
Sciences. Provision of the capillary gel electrophoresis system by BiOptic, Inc. is also greatly 291
appreciated. The authors have declared no conflicts of interest.
292 293
6. References 294
[1] K. Takeda, H. Inoue, Y. Tanizawa, Y. Matsuzaki, J. Oba, Y. Watanabe, K. Shinoda, Y.
295
Oka, Hum Mol Genet 10 (2001) 477.
296
[2] A.A. Osman, M. Saito, C. Makepeace, M.A. Permutt, P. Schlesinger, M. Mueckler, Journal 297
of Biological Chemistry 278 (2003) 52755.
298
[3] D. Takei, H. Ishihara, S. Yamaguchi, T. Yamada, A. Tamura, H. Katagiri, Y. Maruyama, 299
Y. Oka, Febs Letters 580 (2006) 5635.
300
[4] S.G. Fonseca, M. Fukuma, K.L. Lipson, L.X. Nguyen, J.R. Allen, Y. Oka, F. Urano, 301
Journal of Biological Chemistry 280 (2005) 39609.
302
[5] S.G. Fonseca, S. Ishigaki, C.M. Oslowski, S. Lu, K.L. Lipson, R. Ghosh, E. Hayashi, H.
303
Ishihara, Y. Oka, M.A. Permutt, F. Urano, J Clin Invest 120 (2010) 744.
304
[6] S.G. Fonseca, K.L. Lipson, F. Urano, Antioxid Redox Signal 9 (2007) 2335.
305
[7] K.L. Lipson, S.G. Fonseca, S. Ishigaki, L.X. Nguyen, E. Foss, R. Bortell, A.A. Rossini, F.
306
Urano, Cell Metab 4 (2006) 245.
307
[8] N. Cheurfa, G.M. Brenner, A.F. Reis, D. Dubois-Laforgue, R. Roussel, J. Tichet, O.
308
Lantieri, B. Balkau, F. Fumeron, J. Timsit, M. Marre, G. Velho, Diabetologia 54 (2011) 309
554.
310
[9] A.C. Riggs, E. Bernal-Mizrachi, M. Ohsugi, J. Wasson, S. Fatrai, C. Welling, J. Murray, 311
R.E. Schmidt, P.L. Herrera, M.A. Permutt, Diabetologia 48 (2005) 2313.
312
[10] D.J. Wolfram, H.P. Wagener, Mayo Clinic Proceedings (1938) 715.
313
[11] T.G. Barrett, S.E. Bundey, A.F. Macleod, Lancet 346 (1995) 1458.
314
[12] L. Rigoli, F. Lombardo, C. Di Bella, Clin Genet 79 (2011) 103.
315
[13] F.C. Fraser, T. Gunn, J Med Genet 14 (1977) 190.
316
[14] P.W. Franks, O. Rolandsson, S.L. Debenham, K.A. Fawcett, F. Payne, C. Dina, P. Froguel, 317
K.L. Mohlke, C. Willer, T. Olsson, N.J. Wareham, G. Hallmans, I. Barroso, M.S. Sandhu, 318
Diabetologia 51 (2008) 458.
319
[15] V. Lyssenko, A. Jonsson, P. Almgren, N. Pulizzi, B. Isomaa, T. Tuomi, G. Berglund, D.
320
Altshuler, P. Nilsson, L. Groop, New England Journal of Medicine 359 (2008) 2220.
321
[16] M.S. Sandhu, M.N. Weedon, K.A. Fawcett, J. Wasson, S.L. Debenham, A. Daly, H. Lango, 322
T.M. Frayling, R.J. Neumann, R. Sherva, I. Blech, P.D. Pharoah, C.N. Palmer, C. Kimber, 323
R. Tavendale, A.D. Morris, M.I. McCarthy, M. Walker, G. Hitman, B. Glaser, M.A.
324
Permutt, A.T. Hattersley, N.J. Wareham, I. Barroso, Nature Genetics 39 (2007) 951.
325
[17] M.A. Saunders, H. Liang, W.H. Li, Proceedings of the National Academy of Sciences of 326
the United States of America 104 (2007) 3300.
327
9
[18] L.J. Chin, E. Ratner, S.G. Leng, R.H. Zhai, S. Nallur, I. Babar, R.U. Muller, E. Straka, L.
328
Su, E.A. Burki, R.E. Crowell, R. Patel, T. Kulkarni, R. Homer, D. Zelterman, K.K. Kidd, 329
Y. Zhu, D.C. Christiani, S.A. Belinsky, F.J. Slack, J.B. Weidhaas, Cancer Research 68 330
(2008) 8535.
331
[19] S. Tan, J.M. Guo, Q.L. Huang, X.P. Chen, J. Li-Ling, Q.W. Li, F. Ma, Febs Letters 581 332
(2007) 1081.
333
[20] K.P. Jensen, J. Covault, T.S. Conner, H. Tennen, H.R. Kranzler, H.M. Furneaux, Molecular 334
Psychiatry 14 (2009) 381.
335
[21] M.C. Edwards, R.A. Gibbs, PCR Methods Appl 3 (1994) S65.
336
[22] C.P. Kimpton, P. Gill, A. Walton, A. Urquhart, E.S. Millican, M. Adams, PCR Methods 337
Appl 3 (1993) 13.
338
[23] J.M. Butler, C.M. Ruitberg, P.M. Vallone, Fresenius Journal of Analytical Chemistry 369 339
(2001) 200.
340
[24] E. Szantai, A. Szilagyi, A. Guttman, M. Sasvari-Szekely, Z. Ronai, J Chromatogr A 1053 341
(2004) 241.
342
[25] B. Lewin, Genes VI, Oxford University Press, Oxford ; New York, 1997.
343
[26] E. Szantai, Z. Ronai, M. Sasvari-Szekely, A. Guttman, Anal Biochem 352 (2006) 148.
344
[27] C.L. Barr, Y. Feng, K.G. Wigg, R. Schachar, R. Tannock, W. Roberts, M. Malone, J.L.
345
Kennedy, Am J Med Genet 105 (2001) 84.
346
[28] S.E. Hodge, M. Boehnke, M.A. Spence, Nature Genetics 21 (1999) 360.
347
[29] L. Excoffier, M. Slatkin, Molecular Biology and Evolution 12 (1995) 921.
348
[30] E. Szantai, Z. Ronai, A. Szilagyi, M. Sasvari-Szekely, A. Guttman, J Chromatogr A 1079 349
(2005) 41.
350
[31] Z. Ronai, C. Barta, A. Guttman, K. Lakatos, J. Gervai, M. Staub, M. Sasvari-Szekely, 351
Electrophoresis 22 (2001) 1102.
352
[32] Z. Ronai, E. Szantai, R. Szmola, Z. Nemoda, A. Szekely, J. Gervai, A. Guttman, M.
353
Sasvari-Szekely, American Journal of Medical Genetics Part B-Neuropsychiatric Genetics 354
126B (2004) 74.
355
[33] E. Szantai, A. Guttman, Electrophoresis 27 (2006) 4896.
356
[34] M. Kerekgyarto, T. Kerekes, E. Tsai, V.D. Amirkhanian, A. Guttman, Electrophoresis 33 357
(2012) 2752.
358
[35] Z. Ronai, A. Guttman, Z. Nemoda, M. Staub, H. Kalasz, M. Sasvari-Szekely, 359
Electrophoresis 21 (2000) 2058.
360
[36] M. Sasvari-Szekely, A. Gerstner, Z. Ronai, M. Staub, A. Guttman, Electrophoresis 21 361
(2000) 816.
362 363 364 365 366 367 368 369 370 371 372
10 Figure Captions
373 374
Figure 1. Schematic representation of the putative effect of the two SNPs on miRNA 375
binding. Genotypes and haplotypes can be determined by allele-specific amplification using 376
sense rs1046322- and antisense rs9457-specific primers in different combination in case of 377
double heterozygote samples (Sample 1 and Sample 2). The four thick gray lines indicate the 378
four haplotypes on the same chromosomes: A–C, G–G, A–G and G–C.
379 380
Figure 2. Allele-specific multiplex PCR-based direct haplotype determination of the 381
rs1046322 and rs9457 SNPs in the WSF1 gene. (A) Fragments expected in the presence of the 382
sense rs1046322A- and the antisense rs9457C-specific primers in combination with the outer 383
oligos. The 384-bp-long fragment was generated by rs1046322A and rs9457C primers and 384
demonstrated the presence of the A–C haplotype. (B) PCR products obtained in the presence of 385
the rs1046322G- and rs9457G-specific primers in combination with the outer oligos. The 384- 386
bp-long product demonstrated the presence of the G–G haplotype. (C) Genotype and haplotype 387
readings by agarose slab gel electrophoresis. M: 100 base pair DNA sizing marker; Lanes 1-2:
388
PCR samples: A: 437, 488, 541 bp dsDNA fragments; B: 384, 437, 488, 541 bp dsDNA 389
fragments from the multiplex amplification reaction. Separation conditions: 2% agarose gel in 1 390
× TAE containing 0.5 µg/mL ethidium bromide; U=100V; t=45 min; room temperature.
391 392
Figure 3. Capillary gel electrophoresis based fragment analysis of representative multiplex 393
PCR amplicons. Upper trace: DNA sizing ladder (M: 50 to 3000 bp) co-injected with the lower 394
(M1 = 20 bp) and upper (M2 = 5000 bp) alignment markers; Middle and lower traces:
395
representative PCR fragments of 1 and 2 were the same as in Figure 2, respectively, with the 396
respective alignment markers. Separation conditions: marker and sample injection: 4kV/10sec;
397
separation voltage 6 kV; capillary: 75-µm i.d., total length of 15 cm length (effective separation 398
length: 11 cm); ambient temperature.
399 400
Figure 4. LOD and detection linearity measurements. (A) Determination of the limit of 401
detection (LOD) with a representative PCR fragment (576 bp) serially diluted in water compared 402
to the sizing ladder. (B) Detection linearity study using the of the 576 bp PCR fragment serially 403
diluted in the sample buffer. Separation conditions, sizing ladder and lower and upper alignment 404
markers were the same as in Figure 3.
405 406
Figure 1
Click here to download high resolution image
Figure 2A
Click here to download high resolution image
Figure 2B
Click here to download high resolution image
Figure 2C
Click here to download high resolution image
Figure 3
Click here to download high resolution image
Figure 4A
Click here to download high resolution image
Figure 4B
Click here to download high resolution image
TABLES
Table 1. Base pair accuracy determination and calculated concentrations of the multiplex PCR samples using CGE.
1. PCR sample (Figure 3 middle trace)
2. PCR sample (Figure 3 lower trace) Fragment
(bp)
Measured (bp)
Variance (bp)
Accuracy (%)
Concentration (µg/µL)
Fragment (bp)
Measured (bp)
Variance (bp)
Accuracy (%)
Concentration (µg/µL)
- - - - - 384 399 15 3.9 1.65
437 454 17 3.8 1.34 437 457 20 4.5 0.90
488 500 12 2.4 4.16 488 504 16 3.2 4.04
541 583 42 7.7 2.38 541 591 50 9.2 1.09
Table 2. CGE Detector linearity of measured by injecting the 576 bp PCR sample in the 10.00-0.08 ng/µL concentration range.
Detector linearity of the representative PCR sample
No 1. No 2. No 3. No 4. No 5. No 6. No 7. No 8. No 9. No 10.
Concentration
(ng/µL)1 10.0 5.00 2.50 1.00 0.80 0.50 0.40 0.20 0.10 0.08
Average
peak area2 1898510 930498 487797 199921 160618 96405 65104 21230 15755 12894
SD 21552 7487 23358 8014 748 2960 11572 2038 1589 1007.
RSD% 1.13 0.80 4.78 4.00 0.46 3.07 17.77 9.60 10.08 7.81
1WFS1 PCR samples were diluted with dilution buffer. 2Average peak area was determined from triplicate measurements for each concentration.
Tables