Integrated work fl ow for urinary prostate speci fi c antigen N- glycosylation analysis using sdAb partitioning and downstream capillary electrophoresis separation
Balazs Reider
a, Eszter Gacsi
b, Hajnalka Jankovics
b, Ferenc Vonderviszt
b, Tibor Szarvas
c,e, Andras Guttman
a,d, Gabor Jarvas
a,d,*aTranslational Glycomics Research Group, Research Institute of Biomolecular and Chemical Engineering, Faculty of Engineering, University of Pannonia, Veszprem, Hungary
bBio-Nanosystems Laboratory, Research Institute of Biomolecular and Chemical Engineering, Faculty of Engineering, University of Pannonia, Veszprem, Hungary
cDepartment of Urology, Semmelweis University, Budapest, Hungary
dHorvath Csaba Memorial Laboratory of Bioseparation Sciences, Research Centre for Molecular Medicine, Faculty of Medicine, University of Debrecen, Debrecen, Hungary
eDepartment of Urology, University of Duisburg-Essen, Essen, Germany
h i g h l i g h t s g r a p h i c a l a b s t r a c t
Preconcentration method is pre- sented for prostate specific antigen analysis.
Single domain antibody is utilized for preconcentration.
Glycan analysis workflow is devel- oped for urinary prostate specific antigen.
Capillary electrophoresis based glycan mapping of prostate specific antigen is performed.
a r t i c l e i n f o
Article history:
Received 16 June 2021 Received in revised form 9 July 2021
Accepted 25 July 2021 Available online xxx
a b s t r a c t
Prostate cancer represents the second highest malignancy rate in men in all cancer diagnoses worldwide.
The development and progression of prostate cancer is not completely understood yet at molecular level, but it has been reported that changes in the N-glycosylation of prostate-specific antigen (PSA) occur during tumor genesis. In this paper we report on the development and implementation of a high- throughput capillary electrophoresis based glycan analysis workflow for urinary PSA analysis. The technology utilizes selective, high yield single domain antibody based PSA capture, followed by pre- concentration and capillary electrophoresis coupled with laser-inducedfluorescence detection, resulting
Abbreviations:PCa, Prostate cancer; PSA, Prostate specific antigen; aPSA, anti prostate specific antigen; sdAb, single domain antibody; GU, glucose unit; DP2, maltose; DP15, maltopentadecaose; LB, Luria Broth; Amp, Ampicillin; APTS, 8- aminopyrene-1,3,6-trisulfonic acid; CE, capillary electrophoresis; NAG, N-ace- tylgalactosamine; G, galactose; LoD, limit of detection; CID, collision induced dissociation.
*Corresponding author. Translational Glycomics Research Group, Research Institute of Biomolecular and Chemical Engineering, Faculty of Engineering, Uni- versity of Pannonia, Veszprem, Hungary.
E-mail address:jarvas@lendulet.uni-pannon.hu(G. Jarvas).
Contents lists available atScienceDirect
Analytica Chimica Acta
j o u r n a l h o me p a g e : w w w . e l s e v i e r . c o m/ l o ca t e / a c a
https://doi.org/10.1016/j.aca.2021.338892
0003-2670/©2021 The Author(s). Published by Elsevier B.V. This is an open access article under the CC BY-NC-ND license (http://creativecommons.org/licenses/by-nc-nd/4.0/
).
Please cite this article as: B. Reider, E. Gacsi, H. Jankovicset al., Integrated workflow for urinary prostate specific antigenN-glycosylation analysis using sdAb partitioning and downstream capillary electrophoresis separation, Analytica Chimica Acta, https://doi.org/10.1016/
j.aca.2021.338892
Keywords:
N-linked glycans Prostate cancer Serum biomarkers Urinary biomarkers sdAb
in high resolutionN-glycan profiles. Urinary PSA glycan profiles were compared to a commercially available PSA standard revealing differences in theira2,3- anda2,6-sialylated isomers, proving the excellent selectivity of the suggested workflow. This is important as sialylation classification plays an important role in the differentiation between indolent, significant and aggressive forms of prostate cancer.
©2021 The Author(s). Published by Elsevier B.V. This is an open access article under the CC BY-NC-ND license (http://creativecommons.org/licenses/by-nc-nd/4.0/).
1. Introduction
Prostate cancer (PCa) has the second highest frequency rate in men, with 21 % of all cancer diagnoses worldwide [1]. Currently, the gold standard biomarker for PCa is the serum prostate specific antigen (PSA) level. PSA, also known as human kallikrein 3 (KLK3 or hK3), is an organ-specific glycoprotein, which plays an important role in the liquefaction of semen [2]. It is produced by the prostate epithelial cells and secreted primarily into the prostate but also present in other bodyfluids, like blood and urine. Certain diseases, like PCa or benign prostate hyperplasia and prostate related sur- geries and/or biopsies can cause elevated PSA level in the blood- stream [3]. Serum PSA assays greatly reduced the mortality rate of PCa, but the number of false positive diagnoses steeply increased [1]. To overcome the lack of specificity, the search for better PCa biomarkers has been intensified is the last decades [4]. As in numerous other cancer types, protein glycosylation seemed to be a promising diagnostic target [5]. The link between PCa and changes in PSA glycosylation has been reported in several studies [6e9]. The most common cancer-associated N-glycosylation-related alter- ations were found in sialylation (especiallya2,3-sialylation) [10], fucosylation (mainly core fucosylation, i.e., addition of fucose to the innermost GlcNAc residue in the vicinity of the polypeptide back- bone), O-glycan truncation (presence of shortened O-glycans), extensive branching ofN- andO-glycans (i.e., due to increased ac- tivity of N-acetylglucosaminyltransferase) and the presence of polysialic acid [11e15].
A wide repertoire of bioanalytical tools are available to detect N- glycosylation alterations in human bodyfluid proteins. Numerous lectin-based biosensors have been developed to recognize certain sugar structures (e.g.,a2,6- anda2,3-sialylation) [16] and instru- mental analysis by mass spectroscopy, liquid chromatography, capillary electrophoresis, or their various combinations have also been applied for PSA N-glycosylation analysis [17]. However, in spite of these extensive studies, only a few reported methods were capable to achieve fullN-glycan mapping with the separation of the critical structural elements. In addition, these techniques usually required special reagents or complex instrumentation [9,18]. The biological source of PSA is also critical. Semen, blood, and urine are the most commonly used body fluids for this purpose. Standard, commercially available PSA is obtained from human semen, as it contains PSA in the highest concentration (approximately 1.3 mg/
ml) [19], but its usage in clinical analysis is very limited. Blood is much easier to collect (even though it is a somewhat invasive procedure), therefore, it is frequently applied as a viable sample source. Unfortunately, the PSA concentration in blood is usually very low (<10 ng/ml), which can make extensive qualitative anal- ysis a challenge. Urine contains a higher amount of PSA (~100 ng/ml [20]), but its concentration can change over a wide range. It is important to note that compared to blood and semen, the urine matrix possesses significantly lower amounts of glycoproteins, which could otherwise interfere with glycosylation analysis.
To obtain high sensitivity results of low concentration bio- markers, sample preconcentration is often required. Specific
capture of PSA from biological matrices is also beneficial tofilter out any non-PSA related sugar or protein impurities, which could alter the analysis results. Monoclonal antibodies are commonly used capturing agents [21], but their accessibility can limit their appli- cation. In addition, they are glycoproteins, therefore, their removal from the sample prior to analysis is often necessary to avoid any possible interferences. Single domain antibodies (sdAbs) often dubbed as nanobodies, on the other hand, can alleviate this drawback [22]. They are much smaller in size, can be readily pro- duced in bacteria, thus, do not contain sugar moieties. Also, sdAbs can be expressed with different linker tags (e.g., 6-histidine tag) to facilitate their oriented (higher capture efficiency) immobilization to various stationary surfaces [23].
In this paper, a novel workflow is presented for CE-based comprehensive N-glycan analysis of urinary PSA. The process starts with sample concentration steps followed by selective, high yield sdAb-based PSA capture. Thereafter, the N-glycans were enzymatically released from the enriched PSA, fluorescently labeled by aminopyrene trisulfonic acid and analyzed by CE-LIF. The corresponding N-glycan structures were first identified by their glucose unit (GU) values and verified by exoglycosidase based automated carbohydrate sequencing.
2. Materials and methods 2.1. Chemicals and reagents
Water (HPLC grade), acetic acid (glacial), acetonitrile (MeCN), sodium cyanoborohydride (1 M in THF), sodium chloride, imid- azole, 4-(2-hydroxyethyl)-1-piperazineethanesulfonic acid (HEPES) and DTT (dithiothreitol) were obtained from Sigma Aldrich (St.
Louis, MO, USA). SDS (sodium dodecyl sulfate) and Nonidet P-40 were from VWR (West Chester, PA, USA). The Fast Glycan Labeling and Analysis Kit was from SCIEX (Brea, CA, USA) including the tagging dye of 8-aminopyrene-1,3,6-trisulfonic acid (APTS), mag- netic beads for excess dye removal, HR-NCHO separation gel-buffer system as well as the bracketing standards of maltose (DP2) and maltopentadecaose (DP15). The exoglycosidase enzymes of Siali- dase A (Arthrobacter ureafaciens),b-Galactosidase (Jack bean) and b-N-Acetyl Hexosaminidase (Jack bean) were from Agilent (Hay- ward, CA, USA). The endoglycosidase PNGase F was from Asparia Glycomics, (San Sebastian, Spain). 20 ml volume 10 kDa cut-off spinfilters were from Pall (New York, NY, USA), 500ml ml volume 10 kDa cut-off spinfilters were from VWR. PhyTip Ni-IMAC micro- columns (40ml) were provided by PhyNexus (San Jose, CA). Buffer
‘A’: 100 mM HEPES, 500 mM NaCl, 50 mM imidazole (pH¼8.0) and Buffer ‘B’: 100 mM HEPES, 500 mM NaCl, 500 mM imidazole (pH ¼ 8.0). Denaturation solution: mixture of Nonidet P- 40:DTT:SDS¼6:1:1. Digestion solution: 75munit/ml of PNGase F in 16.7 mM ammonium acetate. Labeling solution: 5.7 mM of APTS in the mixture of H2O:AcOH:THF:NaBH3CN (1 M in THF)¼5:5:8:2.
Magnetic bead based purification solution: the solvent was removed from 200ml of magnetic bead suspension from Fast Glycan Labeling and Analysis Kit on a magnetic stand. Next, the beads were
resuspended in 200ml of water and the solvent was removed again on a magnetic stand, and the beads were resuspended again in 20ml of water.
2.2. Expression and purification for PSA specific sdAb
Two sdAb coding sequences, N7 and C9 [24] were codon opti- mized for E. coli, the genes with flanking 50-NdeI and 30-XhoI cleavage sites were synthetized by Genscript (Piscataway, New Jersey, United States) and cloned into pET23b expression vector (Novagen, Merck, Darmstadt, Germany). Shuffle T7 ExpressE. coli (New England Biolabs, Ipswich, Massachusetts, US) cells were transformed with the plasmids, according to the supplier's protocol (Fig. 1). 5 mL LB/Amp preculture was prepared as reported earlier [25], and 2 mL of the resuspended cells was used to inoculate 1 L LB/
Amp. The cell culture was grown at 37C and then at 30C, 140 rpm in baffled flask until OD600 reached 0.6e1.0 range. Protein expression was induced by the addition of 0.5 mM isopropylb-D-1- thiogalactopyranoside (IPTG) and incubated overnight at 22C. The cells were harvested by centrifugation at 6000g for 30 min, washed with buffer ‘A’. Cells were resuspended on ice in 20 ml buffer‘A’containing EDTA-free Mini Complete protease inhibitor (Roche, Basel, Switzerland) and disrupted by sonication (1030 s, 50 % amplitude). After centrifugation andfiltration the supernatant was loaded onto a Ni(II)-saturated, pre-equilibrated 5 ml HiTrap Chelating (GE Healthcare, Chicago, Illinois, US) column and purified using isocratic elution. The pure protein was eluted at 50 %‘B’buffer and dialyzed. Purity of sdAb was confirmed on 15 % SDS PAGE gels and protein concentration calculated using the following parame- ters given by ProtParam [26]: N7-aPSA-6His, 14.5 kDa, 27,180 cm1M1 and C9-aPSA-6His, 14.3 kDa, 21,555 cm1M1, respectively.
2.3. Biological specimens
Urine samples were collected with the appropriate Ethical Per- missions (approval number: 23580e1/2015/EKU (0180/15)) and Informed Patient Consents in the Semmelweis Hospital (Miskolc,
Hungary). Samples were taken from male and female (blind con- trol) healthy volunteers (seven Caucasian subjects, age average:
28.3, age median 27) and kept at 4C until processing.
2.4. PSA quantitation in urine
PSA quantitation was carried out by standard ELISA assays in an UniCel DxI 800 Access Immunoassay System, kindly provided by the central laboratory of Csolnoky Ferenc Hospital (Veszprem, Hungary). Urine samples were analyzed directly, without any sample preparation.
2.5. PSA capture from urine
300 ml of male urine was cooled to room temperature and it was concentrated to 500ml by 20 ml volume 10 kDa cut-off spinfilters (13,500gfor 30 min at 6C for each consecutive 20 ml concen- tration). The concentrated urine was diluted and centrifuged (13,500gfor 10 min at 6C) twice with 3-3 ml of buffer‘A’then it was transferred to an Eppendorf vial. Thefilter was washed two times with 250 ml buffer ‘A’ each and both were added to the transferred urine. Thefinal, 1 ml mixture was vortexed and divided into to 500-500ml, one for PSA capture and one for control. Two Ni- IMAC microcolumns were washed by 200ml buffer‘A’for 5 min, by connecting the tips to an automated pipette and the buffer was continuously aspirated and dispensed through the tips with the flow rate of 2 ml/min. In the next step, the tips were washed by 50mg/ml C9 sdAb in 100ml buffer‘A’for 10 min. For the control, 100ml buffer‘A’without sdAb was used. Both tips were washed again by 200ml buffer‘A’for 5 min. Then, the tips were rinsed by 500-500ml concentrated urine samples for 10 min. After that, the tips were washed again 3 times with 200ml of buffer‘A’, 5 min each, then washed by 100ml buffer‘B’for 5 min. The elutes were trans- ferred onto 500ml volume 10 kDa cut-off spinfilters and the solvent was centrifuged (13,500g for 10 min at 6 C). The filter was washed twice by 400 ml of water, both times the water was centrifuged (13,500gfor 10 min at 6C). The samples were taken up into 80 ml water (washing the filter twice with 40-40 ml of
Fig. 1.Schematics of the single domain anti-PSA production. Genes of strong PSA binder N7 and C9 sdAb variants were incorporated into the pET23b expression vector and the proteins were produced in SHuffle T7 ExpressE. colicells. SHuffle ensured the proper formation of disulfide bonds, thus appropriate folding of sdAb, resulting in soluble and functional antibody for selective capture of PSA from bodyfluids.
water), transferred into an Eppendorf vial, then they were dried in a SpeedVac under reduced pressure at 70C for 15 min. The dried sample was resolved again in 10ml of water.
2.6. Sample preparation
The sample preparation process was identical for all captured PSA, control and PSA standard (150mg/ml) samples. 2ml of dena- turation solution was added to 10ml sample, and heated up from 30C to 80C in 8 min 20 s and incubated at 80C for an additional 100 s. Then 20ml of digestion solution was added and the sample was heated up from 40C to 60C in 20 min. After that, the APTS labeling solution was added and the reaction mixture was incu- bated at 37 C overnight in an open cap vial to let the solvent evaporate [27]. The dried sample was taken up in 20ml of magnetic bead suspension followed by the addition of 185ml of MeCN and supernatant was removed from the magnetic beads on a magnetic stand. The beads were suspended in 20ml of water, 185ml of MeCN was added and the solvent was removed from the magnetic beads on a magnetic stand again. This step was repeated two additional times (total of 4 washes with the first one adding the beads) as reported in Ref. [28]. Finally, the beads were resuspended in 60ml of water and, on a magnetic stand, 50 ml of the supernatant was transferred into a new vial for CE-LIF analysis.
2.7. Capillary gel electrophoresis
A PA800 Plus Pharmaceutical Analysis System (SCIEX) with laser inducedfluorescence detection (lex¼488 nm/lem¼520 nm) was used for all capillary gel electrophoresis separations employing the HR-NCHO separation gel buffer in 40 cm and 20 cm effective length (50 cm and 30 cm total length, 50mm ID) bare fused silica capillary columns, as specified under the correspondingfigure captions. The applied electricfield strength was 30 kV in reversed polarity mode (cathode at the injection side, anode at the detection side). The separation temperature was set at 30C. A three-step electrokinetic sample injection was applied: 1) 3.0 psi for 5.0 s water pre- injection, 2) 1.0 kV for 1.0 s sample injection and 3) 1.0 kV for 1.0 s bracketing standard (DP2 and DP15). The 32Karat (version 10.1) software package (SCIEX) was used for data acquisition and interpretation.
2.8. Glycan structure identification
Structural elucidation of the separated, asparagine linked PSA glycans wasfirst done by direct comparison of their GU values in relevant database entries (GUcal.hu), and verified by exoglycosi- dase digestion based carbohydrate sequencing [18,29]. Shortly, the releasedN-glycans were consecutively digested by monomer and anomericity specific exoglycosidase enzymes such as Sialidase A,b- Galactosidase andb-N-Acetyl Hexosaminidase. The untreated and all digested pools were then separated by CE-LIF and the structural information was derived from the GU value shifts of the individual peaks as the result of the exoglycosidase treatments [30].
3. Results and discussion
A novel, integrated workflow was established for urinary PSAN- glycosylation analysis utilizing highly selective sdAb-based capture from urine, high throughput preconcentration, enzymatic release ofN-glycans from the captured PSA,fluorescent carbohydrate la- beling, high resolution capillary electrophoresis separation and comprehensive glycan structure elucidation.
3.1. Analysis of the standard PSA N-glycom
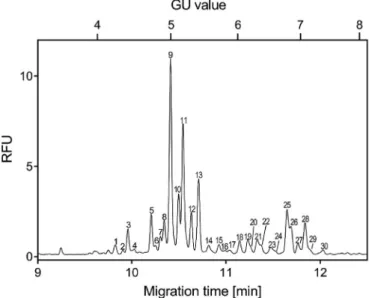
First, the global N-glycosylation profile of a commercial PSA standard was analyzed in order to establish a reference point for the workflow development process. AsFig. 2depicts, high resolu- tion glycan profile was obtained with the 30 most significant peaks annotated. The abbreviated names, structures, migration times and GU values of all identified glycans are listed inTable 1. 15 structures from the PSA standard were only a2,6-sialylated, 9 only a2,3- sialylated and 6 contained both a2,3- and a2,6-sialylation. Core fucosylation was found on 14 glycans, as well as 6 tri-antennary, 2 bisecting and 2 hybrid type structures were identified. The exo- glycosidase based glycan sequencing process is shown in Fig. 3, utilizing Sialidase A,b-Galactosidase andb-N-Acetyl Hexosamini- dase, depicted by the corresponding traces. Sequence information was derived from the GU value shifts of the individual peaks as the result of the consecutive exoglycosidase treatments as described in Ref. [30]. Structures marked with an asterisk are assumable contain N-acetylgalactosamine (NAG) instead of galactose (G) on one of the branches. These structures were identified only by their GU values, because no specific enzyme was available to selectively release NAG. During identification, the peaks denoted by asterisks were compared to structures with galactose on both of their branches.
Peak 37 has 0.5 higher GU value than peak 35 (A2G2) and peak 40 similarly 0.5 GU higher compared to peak 38 (F(6)A2G2). Afterb- Galactosidase digestion peak 35 moves into peak 44 (A2G2/A2) and 38 into 45 (F(6)A2G2/F(6)A2), while peak 37 into 48 (A2G1NAG1/A2NAG1) and 40 into 49 (F(6)A2G1NAG1/F(6) A2NAG1). Due to the digestion process, the GU value decreased 2.3 times more in case of G2 structures compared to their G1NAG1 counterparts. The exact same ratio can be observed in the GU value change after b-N-Acetyl Hexosaminidase digestion between the two variants. The difference implies that while both branches are digested at structures containing G2, only one branch is digested from the G1NAG1 counterparts and probably the NAG containing branch stays intact. Notably, comparing the sialylated G2 structures to their G1NAG1 counterparts (peak 547, 9410, 11412, 13414, 19420, 22423, 25427, 28430) the GU difference is relatively
Fig. 2.Capillary electrophoresis separation of the APTS-labeled PSA standardN-gly- come. Separation conditions: 50 cm total (40 cm effective) length, 50mm i.d. bare fused silica capillary with HR-NCHO gel buffer. Voltage: 30 kV (0.5 min ramp); Temperature:
25C; Injection: 5 psi/5 s water pre-injection followed by 5 kV/2 s sample. Structures corresponding to the numbered peaks are listed inTable 1.
Table 1
Identified glycan structures from PSA standard and glycan sequencing. Structural interpretation follows the suggestions of [32].
Glycan origin Peak No. Migration time (min) GU Glycan name Glycan structure
Native PSA 1 9.82 4.24 A3G(4)3S(6,6,3,6)4
2 9.91 4.35 A3G(4)3S(3,6,3,6)4
3 9.96 4.41 A3G3(6,6,6)S3
4 10.03 4.51 A3G3(6,6,3)S3
5 10.21 4.73 A2G2(6,6)S2
6 10.25 4.79 A1[6]G(4)1(6)S1
7 10.30 4.85 A2G1NAG[6]1(6,6)S2*
8 10.34 4.90 A2G2(3,6)S2
9 10.41 4.99 F(6)A2G2(6,6)S2
10 10.50 5.11 F(6)A2G1NAG[6]1(6,6)S2*
11 10.54 5.18 F(6)A2G2(3,6)S2
12 10.63 5.30 F(6)A2G1NAG[6]1(3,6)S2*
13 10.71 5.41 F(6)A2G2(3,3)S2
14 10.82 5.56 F(6)A2G1NAG[6]1(3,3)S2*
15 10.92 5.71 A3G3(6,6)S2
16 10.99 5.80 F(6)A2[6]G(4)1(6)S1
17 11.04 5.87 F(6)A2[3]G(4)1(6)S1
18 11.15 6.03 M5A1G1(6)S1
19 11.23 6.16 A2G2(6)S1
(continued on next page)
Table 1(continued)
Glycan origin Peak No. Migration time (min) GU Glycan name Glycan structure
20 11.27 6.21 A2G1NAG1(6)S1*
21 11.33 6.31 A3G3(3,3)S2
22 11.37 6.36 M5A1G1(3)S1
23 11.48 6.53 A2G2(3)S1
24 11.53 6.60 A2G1NAG1(3)S1*
25 11.65 6.78 F(6)A2G2(6)S1
26 11.69 6.85 F(6)A2BG2S(6)1
27 11.76 6.96 F(6)A2G1NAG1(6)S1*
28 11.84 7.08 F(6)A2G2(3)S1
29 11.89 7.16 F(6)A2BG2S(3)1
30 12.04 7.39 F(6)A2G1NAG1(3)S1*
Sequencing 31 11.67 6.82 A1G1
32 12.29 7.79 A2[6]G1
33 12.56 8.22 F(6)A1[3]G1
34 13.12 9.11 F(6)A2[3]G1þM5A1G1
35 13.17 9.20 A2G2
36 13.39 9.54 F(6)A2BG1
37 13.49 9.70 A2G1NAG1*
38 13.77 10.14 F(6)A2G2
39 14.01 10.52 F(6)A2BG2
similar in all instances. Also, as one can observe, all of the identified structures on the PSA standard sample were sialylated, empha- sizing the advantage of CE-LIF as a gentle separation technique being able to preserve such sensitive glycan isomers. Orthogonal techniques, like MS often leads to de-sialylation due to in-source degradation [31]. A common concern about the MS analysis is thata2,6-sialylated anda2,3-sialylated glycopeptides have similar or even identical CID fragmentation patterns, which makes linkage specific identification difficult. Furthermore, in many cases, accu- rate structural elucidation by MS/MS is not possible due to the
relatively poor signal intensity. However, the high resolution of the suggested CE-LIF method presented here was capable to readily differentiate the a2,3- and a2,6-sialylated isomers on mono- or multi-sialylated structures, which could be key for cancer diag- nosis. Other PCa related alterations, like the degree of core fuco- sylation or branching could also be traceable, especially after exoglycosidase mediated sequencing. Both, the number of identi- fied glycans as well as the excellent resolution with reliably track- able ratios of the given structures proved the great potential of this workflow as a possible high selectivity PCa diagnostic tool.
Table 1(continued)
Glycan origin Peak No. Migration time (min) GU Glycan name Glycan structure
40 14.06 10.60 F(6)A2G1NAG1*
41 14.28 10.96 A3[6]G3
42 14.52 11.35 A3[3]G3
43 11.02 5.86 A1
44 11.60 6.72 A2
45 12.21 7.67 F(6)A2
46 12.27 7.77 M5A1
47 12.40 7.97 A3
48 12.80 8.61 A2NAG1*
49 13.38 9.53 F(6)A2NAG1*
50 10.33 4.89 M3
51 10.84 5.60 F(6)M3
52 11.66 6.81 M5
53 12.26 7.75 A1NAG1*
54 12.81 8.63 F(6)A1NAG1*
3.2. Expression and purification of the sdAb proteins
Several sdAb single domain antibody sequences were selected earlier by phage display using a variant library prepared from the variable domain of the heavy-chain antibody of dromedary immunized with PSA [24]. The two strongest PSA binder variants, namely N7 (Kd¼0.16 nM) and C9 (Kd¼4.7 nM) were expressed with C-terminal histidine tags to facilitate easy immobilization for affinity based PSA capture from urine.
The cysteine content of the C9 and N7 sdAb variants makes proper folding less effective in standardE. colistrains. Additionally, two cysteines of N7 sdAb are located in the variable regions and supposedly form a stabilizing disulfide bond on the surface of the molecule. For this reason, we used Shuffle T7 Express cells for protein expression, which is an engineeredE. coliB strain capable to promote disulfide bond formation in the cytoplasm [33,34]. As a result of our optimized production protocol, the typical yield for the sdAb variants was 8e12 mg/L culture.
3.3. PSA capture procedure
Scouting experiments suggested that the limit of detection (LoD) was approximately 500 ng of PSA standard in 10ml sample for the CE-LIF analysis of releasedN-glycans. Taking the LoD value into consideration for selecting the optimal biological sample source, blood was excluded due to its very low PSA concentration. Standard PSA-ELISA tests of urine samples from healthy volunteers resulted in an average concentration of 60 ng/ml (slightly lower comparing to literature data [20]) with a maximum of 120 ng/ml and a mini- mum of 30 ng/ml. Results varied on a large scale between the samples from different patients as well as from the same patient
but different sampling dates. The PSA-ELISA method was developed for testing blood PSA level, thus a female urine sample was also processed as negative control, resulting in 0 ng/ml PSA. Female urine was also spiked with PSA standard for positive control, resulting in the added concentration. Control results suggested that the urine matrix did not affect the accuracy of PSA-ELISA tests.
Considering the lowest concentration, a minimum requirement was 150 ml of urine to reliably obtain sufficient quantity of PSA for capture and analysis.
To immobilize the sdAbs, Ni-IMAC microcolumns were chosen (Fig. 4/1a) as they showed strong affinity for the histidine tags of the nanobodies. In order to effectively introduce all of the biological matrix to the column, the volume of urine had to be reduced to 1 ml (i.e., to fit in a 1000 mL affinity columns). Simple heating based evaporation of the water content of the samples was problematic as the higher temperature could lead to possible loss of sensitive sialic residues and precipitation. Therefore, 10 kDa cut-off valuefilters were utilized (Fig. 4/1b), which retained PSA effectively, while letting through the solvent and small contaminants (e.g., sugars).
Changing the urinary matrix to buffer was beneficial in multiple levels. It contributed to avoid any possible undesirable effect on the sdAb capture due to the variable urinary pH as well as introduced imidazole as an agent to prevent non-specific bindings of some of the remaining (>10 kDa) urine components.
The capture capabilities of both sdAB variants of C9 and N7 were tested. Despite of the different equilibrium binding constants, they resulted in equally high yields in terms of signal intensity in CE-LIF analysis, when their binding capacities were tested in preliminary experiments by PSA standard capture from buffer solution (data not shown). Ourfinal choice was the C9 variant, as it provided slightly higher production yields. Various methods were also tested during the elution step (Fig. 4/3) (denaturation, addition of EDTA, etc.) and the addition 500 mM imidazole solution proved to be the best to remove the nanobody-antigen complex from the column. Based on the common knowledge thatE. colidoes not have the machinery to glycosylate proteins, we considered the resulting sdAbs not glyco- sylated, i.e., its removal from the sample was not necessary. How- ever, changing the buffer for water was required after the elution (Fig. 4/4) as the high salt concentration interfered with the removal of excess labeling dye later in the sample preparation workflow.
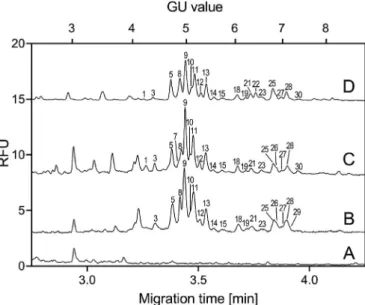
The initial test of the capture method was done with a the PSA standard, spiked into buffer‘A’solution. The glycan profile of the captured PSA corresponded to the PSA standard profile (Fig. 5. D).
To evaluate the matrix effect of urine, PSA standard was also spiked into female urine and captured, resulting similar yields in analytical signal compared to the spiked buffer, as well as, similar glycan profile (Fig. 5. C) as of the PSA standard, suggesting that the sdAb capturing ability was not affected negatively by the matrix. The results of concentrated and captured male urine were also corre- sponding with both spiked test mixtures (Fig. 5. B). To verify that all the resulted glycans originated from urinary or spiked PSA, intact female urine was used as a control (Fig. 5. A), in which case no PSA related peaks were detected. NineteenN-glycan structures were identified from the captured male urinary PSA and their peak area distribution was found to be almost identical to the corresponding PSA standard pool. Please note, 20 cm effective length capillary was utilized for the separation of the captured urinary PSA glycans as we aimed to develop a fast, high-throughput method, which can be readily adapted into clinical laboratory settings, even in a multi- capillary format to increase throughput. No desialylated glycans were found, proving that both the analytical part and the selective capture procedure were sufficiently mild enough to preserve sen- sitive sugar structures, e.g., sialic acids. As with the PSA standard, the a2,3- and a2,6-sialylated isomers were separated on both mono- and multi-sialylated structures, as well as, the core Fig. 3.Exoglycosidase based carbohydrate sequencing of theN-glycome of the PSA
standard. (A) untreated PSA standard; (B) after Sialidase A, (C) after Sialidase Aþb- Galactosidase and (D) after Sialidase Aþb-Galactosidaseþb-N-Acetyl Hexosamini- dase digestion. Separation conditions were the same as inFig. 2. Structures corre- sponding to the numbered peaks are listed inTable 1.
fucosylated or bisecting structures.
4. Conclusions
In this paper a new workflow was introduced to isolate PSA from urine samples by sdAbs immobilized IMAC-Ni microcolumns. The sdAb was produced in-house and were engineered with a special linker tag to help their anchoring to the stationary phase. The usage of sdAbs over mAbs may facilitate extension of the application in future clinical tests as their production even at larger quantities is
possible with lower costs. The selective capturing procedure contributed both to remove other glycoprotein contaminants from the biological matrix and pre-concentrating the PSA content, resulting in higher detection signal. The CE-LIF analysis of the released glycans from urinary PSA resulted in 19 structures out of the 30 obtained from a PSA standard. Each identified glycan structure originated from the native PSA was sialylated, suggesting that the mild conditions of both the capture and labeling/analysis procedure preserved the labile sugar residues, especially the sialic acids and core fucosylation. Due to the high resolving power of the CE-LIF system, both the fucosylated and non-fucosylated structures as well as thea2,3- anda2,6-sialylated isomers were separated.
Since the most common cancer related alterations are reportedly associated with these structural changes, it is key for any diagnostic application to reliably detect the alterations of these residues.
Furthermore, as individual structures were identified with high resolution, more complex variations could be discovered, which occurs in certain glycans only. Our results showed that the devel- oped workflow was suitable for comprehensiveN-glycan analysis of urinary PSA and could be a basis for future endeavors aiming to detect the alterations in PSA glycosylation caused by certain dis- eases like prostate cancer or benign prostatic hyperplasia.
CRediT authorship contribution statement
Balazs Reider:Investigation, Data curation, Writingeoriginal draft.Eszter Gacsi:Investigation.Hajnalka Jankovics: Investiga- tion. Ferenc Vonderviszt: Investigation. Tibor Szarvas:Supervi- sion.Andras Guttman:Supervision, Writingereview&editing.
Gabor Jarvas: Supervision, Visualization, Writing e review &
editing.
Declaration of competing interest
The authors declare that they have no known competing financial interests or personal relationships that could have appeared to influence the work reported in this paper.
Fig. 4.Urinary PSA analysis workflow. 1a) Immobilization of sdAb to Ni-IMAC column; 1b) Concentration of urine via spinfilters; 2) PSA capture from urinary matrix; 3) Elution of antibody-PSA complex; 4) Desalting and concentration; 5) Denaturation of PSA; 6)N-glycan release by PNGase F digestion; 7) Fluorescent glycan labeling; 8) CE-LIF analysis.
Fig. 5. Capillary electrophoresis separation of the sdAb captured PSAN-glycome pools.
A) intact female urine control, B) male urinary PSAN-glycome, C) PSA standard spiked into female urine, D) PSA standard spiked into buffer‘A’. Separation conditions: 30 cm total (20 cm effective) length, 50mm i.d. bare fused silica capillary with HR-NCHO gel buffer. Voltage: 30 kV (0.5 min ramp); Temperature: 25C; Injection: 5 psi/5 s water pre-injection followed by 2 kV/2 s sample. Structures corresponding to peaks are listed inTable 1.
Acknowledgements
The authors gratefully acknowledge the support from the Na- tional Research, Development and Innovation Office (2018e2.1.17- TET-KR-2018-00010) grants of the Hungarian Government. This work was also supported by the UNKP-20-5 New National Excel- lence Program Hungarian Ministry of Human Capacities and the Janos Bolyai Research Scholarship of the Hungarian Academy of Sciences. This work was supported by the TKP2020-IKA-07 project financed under the 2020e4.1.1-TKP2020 Thematic Excellence Pro- gramme by the National Research, Development and Innovation Fund of Hungary. The stimulating discussion with Sandor Nagy, MD (Ferenc Csolnoky General Hospital) on medical aspects of prostate cancer is also highly appreciated. Finally, we appreciate the generous help of Noemi Kovacs regarding nanobody production.
This is contribution #185 of the Horvath Csaba Memorial Labora- tory of Bioseparation Sciences.
References
[1] S.V. Carlsson, A.J. Vickers, Screening for prostate cancer, Med. Clin. (2020), https://doi.org/10.1016/j.mcna.2020.08.007.
[2] D.A. Armbruster, Prostate-specific antigen: biochemistry, analytical methods, and clinical application, Clin, Inside Chem. (1993),https://doi.org/10.1093/
clinchem/39.2.181.
[3] P.F. Pinsky, B.S. Kramer, E.D. Crawford, R.L. Grubb, D.A. Urban, G.L. Andriole, D. Chia, D.L. Levin, J.K. Gohagan, Prostate volume and prostate-specific antigen levels in men enrolled in a large screening trial, Urology (2006),https://
doi.org/10.1016/j.urology.2006.02.026.
[4] X. Filella, E. Fernandez-Galan, R.F. Bonifacio, L. Foj, Emerging biomarkers in the diagnosis of prostate cancer, Pharmgenomics. Pers. Med 11 (2018) 83e94, https://doi.org/10.2147/PGPM.S136026.
[5] B. Adamczyk, T. Tharmalingam, P.M. Rudd, Glycans as cancer biomarkers, biochim. Biophys. Acta - gen, Subjectivity 1820 (2012) 1347e1353,https://
doi.org/10.1016/j.bbagen.2011.12.001.
[6] S. Gilgunn, P.J. Conroy, R. Saldova, P.M. Rudd, R.J. O'Kennedy, Aberrant PSA glycosylation - a sweet predictor of prostate cancer, Nat. Rev. Urol. (2013), https://doi.org/10.1038/nrurol.2012.258.
[7] J. Munkley, I.G. Mills, D.J. Elliott, The role of glycans in the development and progression of prostate cancer, Nat. Rev. Urol. (2016),https://doi.org/10.1038/
nrurol.2016.65.
[8] J. Tkac, T. Bertok, M. Hires, E. Jane, L. Lorencova, P. Kasak, Glycomics of prostate cancer: updates, Expert Rev. Proteomics (2019), https://doi.org/10.1080/
14789450.2019.1549993.
[9] J. Tkac, V. Gajdosova, S. Hroncekova, T. Bertok, M. Hires, E. Jane, L. Lorencova, P. Kasak, Prostate-specific antigen glycoprofiling as diagnostic and prognostic biomarker of prostate cancer, Interface Focus (2019),https://doi.org/10.1098/
rsfs.2018.0077.
[10] R. Saldova, Y. Fan, J.M. Fitzpatrick, R.W.G. Watson, P.M. Rudd, Core fucosyla- tion anda2-3 sialylation in serum N-glycome is significantly increased in prostate cancer comparing to benign prostate hyperplasia, Glycobiology (2011),https://doi.org/10.1093/glycob/cwq147.
[11] J. Tkac, V. Gajdosova, S. Hroncekova, T. Bertok, M. Hires, E. Jane, L. Lorencova, P. Kasak, Prostate-specific antigen glycoprofiling as diagnostic and prognostic biomarker of prostate cancer, Interface Focus 9 (2019), https://doi.org/
10.1098/rsfs.2018.0077.
[12] M. Ferens-Sieczkowska, B. Kowalska, E.M. Kratz, Seminal plasma glycopro- teins in male infertility and prostate diseases: is there a chance for glyco- biomarkers? Biomarkers (2013) https://doi.org/10.3109/
1354750X.2012.719035.
[13] P, M. dos Santos Silva, P.B.S. Albuquerque, W.F. de Oliveira, L.C.B.B. Coelho, M.T. dos Santos Correia, glycosylation products in prostate diseases, Clin.
Chim, Acta (2019),https://doi.org/10.1016/j.cca.2019.08.003.
[14] Z. Kyselova, Y. Mechref, M.M. Al Bataineh, L.E. Dobrolecki, R.J. Hickey, J. Vinson, C.J. Sweeney, M.V. Novotny, Alterations in the serum glycome due to metastatic prostate cancer, J. Proteome Res. (2007),https://doi.org/10.1021/
pr060664t.
[15] S. Gilgunn, K. Murphy, H. St€ockmann, P.J. Conroy, T. Brendan Murphy, R. William Watson, R.J. O’kennedy, P.M. Rudd, R. Saldova, Glycosylation in indolent, significant and aggressive prostate cancer by automated high-
throughput n-glycan profiling, Int, J. Mol. Sci. (2020), https://doi.org/
10.3390/ijms21239233.
[16] D. Pihíkova, P. Kasak, J. Tkac, Glycoprofiling of cancer biomarkers: label-free electrochemical lectin-based biosensors, Open Chem. 13 (2015) 636e655, https://doi.org/10.1515/chem-2015-0082.
[17] B. Reider, G. Jarvas, J. Krenkova, A. Guttman, Separation based characterization methods for the N-glycosylation analysis of prostate-specific antigen, J.
Pharm. Biomed, Anal 113797 (2020), https://doi.org/10.1016/
j.jpba.2020.113797.
[18] G.S.M. Kammeijer, J. Nouta, J.J.M.C.H. De La Rosette, T.M. De Reijke, M. Wuhrer, An in-depth glycosylation assay for urinary prostate-specific antigen, anal, Inside Chem. (2018),https://doi.org/10.1021/acs.analchem.7b04281.
[19] C.M. Lynne, T.C. Aballa, T.J. Wang, H.G. Rittenhouse, S.M. Ferrell, N.L. Brackett, Serum and semen prostate specific antigen concentrations are different in young spinal cord injured men compared to normal controls, J. Urol. 162 (1999) 89e91,https://doi.org/10.1097/00005392-199907000-00022.
[20] S. Bolduc, L. Lacombe, A. Naud, M. Gregoire, Y. Fradet, R.R. Tremblay, Urinary PSA: a potential useful marker when serum PSA is between 2.5 ng/ml and 10 ng/ml,, J. Can. Urol. Assoc. 1 (2007) 377e381, https://doi.org/10.5489/
cuaj.444.
[21] S.K. Vashist, J.H.T. Luong, Antibody immobilization and surface functionali- zation chemistries for immunodiagnostics, in: Handb. Immunoass. Technol.
Approaches, Performances, Appl, Elsevier, 2018, pp. 19e46,https://doi.org/
10.1016/B978-0-12-811762-0.00002-5.
[22] M. Arbabi-Ghahroudi, Camelid single-domain antibodies: historical perspec- tive and future outlook, Front. Immunol. 8 (2017) 1589, https://doi.org/
10.3389/fimmu.2017.01589.
[23] J. Krenkova, A. Szekrenyes, Z. Keresztessy, F. Foret, A. Guttman, Oriented immobilization of peptide-N-glycosidase F on a monolithic support for glycosylation analysis, J. Chromatogr. A 1322 (2013) 54e61,https://doi.org/
10.1016/j.chroma.2013.10.087.
[24] D. Saerens, J. Kinne, E. Bosmans, U. Wernery, S. Muyldermans, K. Conrath, Single domain antibodies derived from dromedary lymph node and periph- eral blood lymphocytes sensing conformational variants of prostate-specific antigen, J. Biol. Chem. (2004),https://doi.org/10.1074/jbc.M409292200.
[25] B. Meszaros, Z. Kovacs, E. Gebri, H. Jankovics, F. Vonderviszt, A. Kiss, A. Simon, S. Botka, T. Hortobagyi, A. Guttman, N-glycomic analysis of Z(IgA1) partitioned serum and Salivary immunoglobulin A by capillary electrophoresis, Curr. Mol.
Med. 20 (2021) 781e788, https://doi.org/10.2174/
1566524020666200413114151.
[26] E. Gasteiger, C. Hoogland, A. Gattiker, S. Duvaud, M.R. Wilkins, R.D. Appel, A. Bairoch, Protein Identification, Analysis, Tools on the ExPASy Server, in:
Proteomics Protoc. Handb, 2005, 571,https://doi.org/10.1385/1-59259-890-0.
[27] B. Reider, M. Szigeti, A. Guttman, Evaporativefluorophore labeling of carbo- hydrates via reductive amination, Talanta 185 (2018),https://doi.org/10.1016/
j.talanta.2018.03.101.
[28] M. Szigeti, A. Guttman, in: High-Throughput N-Glycan Analysis with Rapid Magnetic Bead-Based Sample Preparation, 2017, pp. 265e272,https://doi.org/
10.1007/978-1-4939-6493-2_19.
[29] B. Meszaros, G. Jarvas, A. Farkas, M. Szigeti, Z. Kovacs, R. Kun, M. Szabo, E. Csanky, A. Guttman, Comparative analysis of the human serum N-glycome in lung cancer, COPD and their comorbidity using capillary electrophoresis, J. Chromatogr. B Anal. Technol. Biomed. Life Sci (2020), https://doi.org/
10.1016/j.jchromb.2019.121913.
[30] M. Szigeti, A. Guttman, Automated N-glycosylation sequencing of bio- pharmaceuticals by capillary electrophoresis, Sci, For. Rep. 7 (2017),https://
doi.org/10.1038/s41598-017-11493-6.
[31] G.S.M. Kammeijer, B.C. Jansen, I. Kohler, A.A.M. Heemskerk, O.A. Mayboroda, P.J. Hensbergen, J. Schappler, M. Wuhrer, Sialic acid linkage differentiation of glycopeptides using capillary electrophoresis - electrospray ionization - mass spectrometry, Sci. Rep. (2017),https://doi.org/10.1038/s41598-017-03838-y.
[32] A. Varki, R.D. Cummings, M. Aebi, N.H. Packer, P.H. Seeberger, J.D. Esko, P. Stanley, G. Hart, A. Darvill, T. Kinoshita, J.J. Prestegard, R.L. Schnaar, H.H. Freeze, J.D. Marth, C.R. Bertozzi, M.E. Etzler, M. Frank, J.F. Vliegenthart, T. Lütteke, S. Perez, E. Bolton, P. Rudd, J. Paulson, M. Kanehisa, P. Toukach, K.F. Aoki-Kinoshita, A. Dell, H. Narimatsu, W. York, N. Taniguchi, S. Kornfeld, Symbol nomenclature for graphical representations of glycans, Glycobiology 25 (2015) 1323e1324,https://doi.org/10.1093/glycob/cwv091.
[33] P.H. Bessette, F. Åslund, J. Beckwith, G. Georgiou, Efficient folding of proteins with multiple disulfide bonds in the Escherichia coli cytoplasm, Proc. Natl.
Acad. Sci. U. S. A (1999),https://doi.org/10.1073/pnas.96.24.13703.
[34] R. Levy, R. Weiss, G. Chen, B.L. Iverson, G. Georgiou, Production of correctly folded fab antibody fragment in the cytoplasm of Escherichia coli trxB gor mutants via the coexpression of molecular chaperones, Protein Expr, Purif (2001),https://doi.org/10.1006/prep.2001.1520.