The E ff ect of Temperature in Sodium Dodecyl Sulfate Capillary Gel Electrophoresis of Protein Therapeutics
Csenge Filep and András Guttman*
Cite This:Anal. Chem.2020, 92, 4023−4028 Read Online
ACCESS
Metrics & More Article RecommendationsABSTRACT: The temperature-dependent migration of molecular weight protein size standards and several biotherapeutic proteins were studied in sodium dodecyl sulfate capillary gel electrophoresis (SDS-CGE) in the interval from 15 to 60 °C using borate cross- linked dextran sieving matrix. Arrhenius plots were generated to calculate the respective activation energy values for the various solute molecules. SDS-CGE analysis of the biotherapeutic protein test mixture revealed no correlation between the activation energy requirement of the different species and their molecular weights, emphasizing the importance of separation temperature optimization to obtain high resolution between the solute molecules of interest. In contrast, the molecular weight protein size ladder ranging from 10 to 225 kDa, built from the same polypeptide blocks with no post- translational and other modifications, showed predictable activation
energy requirement. The electrophoretic mobility of the SDS−protein complexes was found to be the function of the reciprocal sixth root of the molecular weight (Mw−1/6), implying cylindrical conformation.
■
INTRODUCTIONBecause of recent rapid developments in the biopharmaceutical industry, new generation therapeutic proteins have become more and more widely available.1 With replacement of traditional small molecule drugs with therapeutic proteins, such as mono- or multispecific antibodies, fusion proteins, nanobodies, etc., optimized treatment can be established against a plethora of diseases such as hematological and solid tumors as well as autoimmune and inflammatory ailments, just to list a few important ones.2 Checking the purity of these therapeutic proteins and detecting any structural ambiguities during the manufacturing process is very important for the biopharmaceutical field and also required by regulatory agencies.
Sodium dodecyl sulfate capillary gel electrophoresis (SDS- CGE) is one of the most frequently used separation techniques for fast purity check and characterization in release and stability studies of therapeutic proteins in the biopharmaceut- ical industry.3 Modern capillary electrophoresis instruments offer full automation and rapid analysis time in comparison to manual SDS polyacrylamide slab gel electrophoresis (SDS- PAGE), while still utilizing the same sample preparation protocol of heat denaturation in the presence of a reducing agent and the surfactant, resulting in the SDS micelles covering the hydrophobic backbone of the polypeptide chain.4Proteins bind SDS at a 1 g per 1.4 g ratio that gives the SDS−protein complexes approximately identical charge to mass or, more
precisely, charge to hydrodynamic volume ratio,5 requiring a sieving matrix to obtain their size-based separation. Important to note that, for example, glycosylation, a frequently occurring hydrophilic post translational modification, on one hand increases the hydrodynamic volume of the complex, but since the hydrophilic glycan moiety does not bind SDS, the overall charge is decreased. The effect of these two important factors, that is, increased size and suppressed charge, decreases the resulting electrophoretic mobility, possibly leading to molecular mass overestimation.6,7 The resolution of the technique is dependent on the sieving matrix composition used and the separation conditions applied. The current industry standard sieving matrix for SDS-CGE is borate cross- linked dextran3,8−10 that provides excellent separation capabilities for proteins in the molecular weight (MW) range from 10 kDa up to a few hundred kilodaltons.
Received: December 9, 2019 Accepted: February 5, 2020 Published: February 5, 2020
Article pubs.acs.org/ac
Downloaded via UNIV OF EXETER on July 17, 2020 at 15:09:34 (UTC). See https://pubs.acs.org/sharingguidelines for options on how to legitimately share published articles.
■
THEORYThe electrophoretic mobility (μ) of a polyion such as an SDS- protein complex during gel electrophoresis separation can be given as11,12
Q r μ 6
= π η
(1) whereQis the net charge of polyion, ηis the viscosity of the separation matrix, and ris the radius of the solute molecule.
For spherical objects, Offord suggested to replace the termrby the cubic root of the molecular weight as dimensional equivalent or byMw2/3as surface area equivalent.11Ricard et al. recommended the use of Mw1/2 as radius of gyration equivalent.13Others suggested a rodlike cylindrical model with the square root ofMw1/3.14This latter was in agreement with the so-called “necklace” model4 of the SDS micelle covered polypeptide chains. In addition, the repulsion effect of the strong negative charges of the SDS molecules surrounding the protein should also be considered to hinder folding, that is, supporting the cylindrical model.
The viscosity of the sieving matrix is a function of the absolute temperature (T) and can be defined by the modified Arrhenius equation15,16
AeE RTa/
η = (2)
whereAis a pre-exponential factor,Eais the activation energy, andRis the universal gas constant. By combiningeqs 1and2, and summing up all the constants in constA, the electrophoretic mobility of the SDS-protein complex can be given as
Q
r e
const 6
E RT
A a/
μ= π×
× −
(3)
Therefore, under isothermal separation conditions (i.e., constant temperature), theμversus 1/rplots should be linear with temperature-dependent slopes. However, when isobaric conditions are applied (i.e., constant MW), the logarithmic electrophoretic mobility can be plotted as a function of the reciprocal absolute temperature (ln μ vs 1/T), and the activation energies for the respective molecules can be calculated from the slopes.
Considering the above, separation temperature is an important parameter influencing performance, which can be optimized based on the activation energy concept to achieve the highest resolution of the solute molecules of interest in hand.17In other words, since the electromigration property of any solute molecule, including the SDS−protein complexes, is an activated process, each and every molecule has a different activation energy requirement to pass through the separation matrix.17−19The activation energy (Ea) necessary for a solute molecule to migrate through the sieving matrix under the applied electricfield can be calculated fromeq 3, as mentioned above.
■
EXPERIMENTAL SECTIONChemicals.In all experiments the SDS-MW Analysis Assay kit (Sciex, Brea, CA) was used including the SDS-MW Gel Buffer, the Sample Buffer, the 10 kDa protein standard, and the SDS-MW Size Standard mixture (10 to 225 kDa). High- performance liquid chromatography (HPLC) grade water and 2-mercaptoethanol was obtained from Sigma-Aldrich (St Louis, MO). The antibody therapeutics omalizumab (Xolair) and the nanobody (against prostate specific antigen (PSA)) were kindly provided by University of Debrecen (Debrecen, Hungary) and University of Pannonia (Veszprem, Hungary), respectively.
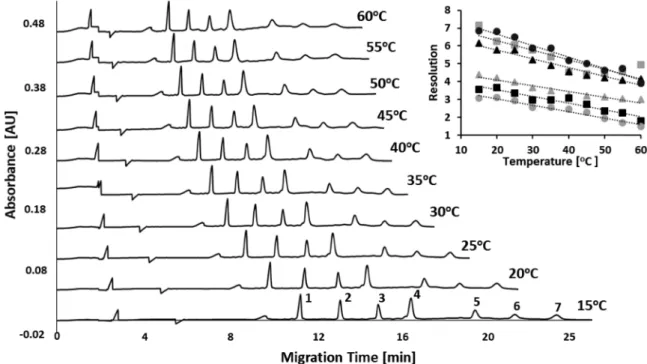
Figure 1.SDS-CGE separations of the molecular weight size standard mixture at temperatures ranging from 15 to 60°C. Peaks: 1−10, 2−20, 3− 35, 4−50, 5−100, 6−150, 7−225 kDa. (inset) The resolution values between the peaks as the function of the separation temperature (symbols for resolution between peaks: (gray■) 1−2, (▲) 2−3, (gray▲) 3−4, (●) 4−5, (■) 5−6, (gray●) 6−7). Conditions: 20 cm effective separation length (30 cm total), SDS-MW Gel Buffer, 20 kV applied electric potential (reversed polarity), injection: 10 kV for 20 s. Sample concentration:
1.57 mg/mL.
Sample Preparation.The biopharma protein test mixture was prepared by mixing 2 μL of 5 mg/mL 10 kDa protein standard, 20μL of 0.8 mg/mL nanobody (PSA specific), and 3 μL of 10 mg/mL omalizumab. Seventy microliters of sample buffer (100 mM Tris-HCl, pH 9.0) containing 1% SDS and 5 μL of 2-mercaptoethanol was added to the biopharma protein test mixture solution. The molecular weight sizing standard was prepared by mixing 10 μL of 16 mg/mL SDS-MW Size Standard and 2μL of internal standard (10 kDa), diluted with 85μL of sample buffer and the addition of 5 μL of reducing agent (2-mercaptoethanol). The denaturation step was accomplished by incubation in a 100 °C water bath for 3 min followed by cooling the samples to room temperature before being used for SDS-CGE analysis.
Capillary SDS-Gel Electrophoresis. A PA800 Plus Pharmaceutical Analysis System (Sciex) was used in UV absorbance detection mode (214 nm) for all SDS-CGE separations employing the SDS-MW Gel Buffer in 20 cm effective length (30 cm total lengths), 50 μm ID bare fused silica capillaries. The applied electric potential was 20 kV in reversed polarity mode (cathode at the injection side). The samples were electrokinetically injected by 10 kV for 20 s and separated at 15, 20, 25, 30, 35, 40, 45, 50, 55, and 60°C. The separation temperature was controlled by the liquid-cooling system of the instrument with ±0.1 °C precision. The separation capillary was conditioned at the beginning of each separation by rinsing with 0.1 M NaOH for 3 min, 0.1 M HCl for 1 min, HPLC grade water for 5 min, and the SDS-MW gel buffer for 5 min. All runs were made in triplicates. For data acquisition and analysis, the 32Karat (version 10.1) software package (Sciex) and the PeakFit (version 4.12) software were used.
■
RESULTS AND DISCUSSIONThe temperature-dependent electromigration of SDS-protein complexes including the molecular weight size standards and a biotherapeutic protein test mixture was studied in sodium dodecyl sulfate capillary gel electrophoresis at the temperature range of 15−60 °C using a borate cross-linked dextran separation matrix.
Temperature-Dependent Electromigration of the MW Size Standards. Figure 1 compares the SDS-CGE
separations of the protein molecular weight standard mixture ranging from 10 to 225 kDa at capillary temperatures between 15 and 60 °C in 5°C steps. It is important to note that the increasing molecular weight size standards have been assembled from the same polypeptide building blocks with no post-translational and other modifications.20 Therefore, they differed from each other only by the number of the connected building blocks resulting in very similar molecular characteristics.
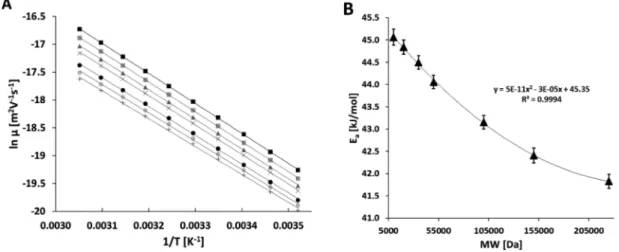
Considering eq 3 at isobaric conditions, the natural logarithms of the electrophoretic mobilities for the individual components of the protein molecular weight size mixture were plotted as the function of the reciprocal absolute separation temperature between 15 and 60°C (288−333 K) as shown in Figure 2A (Arrhenius plots). The mobilities were adjusted with the temperature-dependent viscosity change of the gel-buffer system (4%/Δ5 °C).21 The activation energy values were calculated from the slopes of the Arrhenius plots (Figure 2A) and delineated inFigure 2B as the function of the molecular weight of the individual protein molecules in the sample Figure 2.(A) Arrhenius plots of the natural logarithmic electrophoretic mobility vs reciprocal absolute temperature for the protein size standard mixture (averager2> 0.999) under isobaric conditions. Symbols: (■) 10, (gray■) 20, (gray▲) 35, (×) 50, (●) 100, (gray●) 150, (+) 225 kDa proteins. (B) The activation energy values were derived from the slopes in (A) and plotted as the function of the molecular weight. The brackets show the corresponding standard deviation (SD) values of triplicate runs.
Figure 3. Electrophoretic mobility values as the function of the molecular weight of the solute molecules on the −1/6th power.
Symbols: (△) 15, (○) 20, (□) 25, (gray▲) 30, (gray■) 35, (+) 40, (×) 45, (●) 50, (▲) 55 , (■) 60°C. Ther2values of all lines were at least 0.999.
Analytical Chemistry pubs.acs.org/ac Article
mixture. As one can observe, the activation energies of the individual proteins in the molecular weight size mixture showed convex decreasing characteristics with increasing molecular weight in a predictable exponentially declining function ofy= 5×10−11x2−3×10−05x+ 45.35 (r2= 0.999).
We suggest that this well-defined change was the result of the very similar molecular characteristics of the individual molecular weight size standards, that is, possessing the same polypeptide building blocks with no post-translational and other modifications. In addition, to the predictable activation energy requirement of the individual members of the molecular weight size standards at different temperatures, the resolution among the consecutive peaks in the entire size range changed similarly (inset inFigure 1), probably also due to the similar molecular characteristics of the sample components. It is important to note that increasing diffusion must have also played a role in the drop of resolution with elevating temperatures.
In regard to the role of the activation energy requirement, based on the groundbreaking work of the Dovichi group on a similar phenomenon in dsDNA fragment separation,22 we suggest that the gel matrix must have been distorted to allow passage of the heavily charged large SDS−protein complexes.
Albeit, here we considered that the convex type decrease in the activation energy values with increasing molecular weight may have been influenced by the lifetime of a borate cross-linked dextran matrix formation, which is reportedly in the low millisecond range.9 This makes the cross-linking between the dextran chains continuously break and reconstruct and, concomitantly, easily restoring the sieving matrix structure after distortion by the passing large polyions.
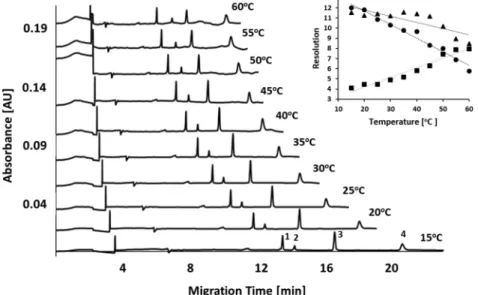
To better understand the migration behavior of the SDS− protein complexes via this continuously breaking/reconstruct- ing dextran-borate gel in narrow bore capillary columns, the electrophoretic mobility values were plotted under isotherm separation conditions following eq 3, using the possible Mw Figure 4.SDS-CGE separations of a therapeutic protein test mixture at different temperatures between 15 and 60°C. Peaks: (1) 10 kDa protein standard, (2) nanobody (PSA specific,Mw14.26 kDa), (3) omalizumab light chain (Mw23.89 kDa), (4) omalizumab heavy chain (Mw49.37 kDa).
(inset) The resolution values between the peaks as the function of the separation temperature (symbols for resolution between peaks: (■) 1−2, (●) 2−3, (▲) 3−4). Conditions were the same as inFigure 1.
Figure 5.(A) Arrhenius plots of the natural logarithmic electrophoretic mobility vs reciprocal absolute temperature for the biotherapeutic protein text mixture (averager2= 0.999). Symbols: (▲)10 kDa protein, (gray■) nanobody (14.26 kDa), (●) omalizumab light chain (23.89 kDa), (gray
×) omalizumab heavy chain (49.37 kDa). (B) The activation energy values were derived from the slopes of (A) and plotted as the function of the molecular weight. The brackets show the corresponding SD values of triplicate runs.
equivalents of the molecular radius. Plotting the surface equivalents of the molecular radius suggested by Offord,11the averager2values of the resulting mobility versus Mw−1/3 and Mw−2/3 plots were 0.994 and 0.953, respectively, in the temperature range examined. With the radius of gyration approach13 using the mobility versus Mw−1/2 plots, the resulting average r2 value was 0.978. Finally, as Figure 3 shows, the electrophoretic mobility values of the SDS−protein complexes were plotted as the function of the square root of Mw−1/3, with the assumption of possible cylindrical shapes for the molecules (necklace model4). This approach resulted in an averager2value of 0.999. On the basis of this almost perfect linear relationship, we concluded that, under isotherm conditions, the electrophoretic mobilities of the SDS−protein complexes were the reciprocal sixth root function of the molecular weight (Mw−1/6).
Therefore, we suggest the following equation to describe the mobility of the SDS−protein complexes in borate cross-linked dextran gels.
Q M e
constA w1/6 E RTa/
μ= × × − × − (4)
Temperature-Dependent Migration of the Biother- apeutic Test Mixture. Figure 4 compares the temperature- dependent separation of the 10.00 kDa protein standard, the prostate specific antigen nanobody (14.26 kDa), as well as the light (23.89 kDa) and heavy (49.37 kDa) chains of the therapeutic monoclonal antibody (omalizumab).
Similar to the above, the Arrhenius plots were delineated (Figure 5A), and the activation energy values were calculated.
Figure 5B shows the activation energy values as the function of the molecular weights of the solute molecules. Unlike inFigure 2B, here no tendency was observed in the distribution of the data points. These individual molecules were very different in their polypeptide sequences and post-translational modifica- tions, requiring very different and nonpredictable activation energies for their electromigration through the gel matrix emphasizing the importance of investigating the separation temperature in SDS-SGE for separation optimization.
In contrast to the separation of theMWsize standard shown inFigure 1, the resolution between the therapeutic protein text mixture peaks variably changed with the increasing temper- ature, as the inset inFigure 4depicts. The resolution between the 10 kDa protein and the PSA specific nanobody practically doubled with elevated temperature. The opposite happened between the nanobody and the light chain of the antibody therapeutics, where the resolution dropped to more than half at 60°C than what it was at 15°C. The resolution between the light and heavy chains of the monoclonal antibody drug decreased∼30% with elevating temperature. Please note that, in addition to the individual activation energy requirement of the electromigrating molecules, diffusion change mediated band broadening must have also contributed to the resolution change at different temperatures.
■
CONCLUSIONSodium dodecyl sulfate capillary gel electrophoresis is a routinely used method in the analysis of therapeutic proteins during the process development workflow including product characterization, stability testing, and lot release. While SDS- CGE offers the required separation and quantification of the light chain, heavy chain, and nonglycosylated heavy chain of traditional monoclonal antibodies, new modality protein
pharmaceuticals are much more complex molecules than those of conventional mAbs and, thus, may require more sophisticated separation optimization. In this paper the effect of separation temperature on the resolution of SDS−protein complexes was investigated utilizing the activation energy concept. First a molecular weight protein test mixture was analyzed to understand the basic principles of temperature- dependent migration of the SDS−protein complexes. The concept was then applied to the separation of a biopharma- ceutical protein test mixture with the goal to optimize the separation temperature and obtain the highest resolution between the solute molecules of interest. To shed light on the migration behavior in SDS-CGE with borate cross-linked dextran gels, isotherm separation conditions were utilized, and a linear relationship was found between the electrophoretic mobility and the Mw−1/6 of the SDS−protein complexes suggesting cylindrical molecular shape during their electro- migration.
■
AUTHOR INFORMATION Corresponding AuthorAndrás Guttman−Horváth Csaba Laboratory of Bioseparation Sciences, Research Center for Molecular Medicine, Faculty of Medicine, Doctoral School of Molecular Medicine, University of Debrecen, Debrecen, Hungary; Translation Glycomics Group, Research Institute of Biomolecular and Chemical Engineering, University of Pannonia, Veszprem, Hungary;́ orcid.org/
0000-0002-7838-082X; Email:guttman@mik.uni- pannon.hu
Author
Csenge Filep−Horváth Csaba Laboratory of Bioseparation Sciences, Research Center for Molecular Medicine, Faculty of Medicine, Doctoral School of Molecular Medicine, University of Debrecen, Debrecen, Hungary
Complete contact information is available at:
https://pubs.acs.org/10.1021/acs.analchem.9b05566
Notes
The authors declare no competingfinancial interest.
■
ACKNOWLEDGMENTSThe authors gratefully acknowledge the support of the BIONANO_GINOP-2.3.2-15-2016-00017 project and the V4-Korea Joint Research Program, project National Research, Development and Innovation Office (NKFIH) (NN 127062) grants of the Hungarian Government. This is contribution# 162 from the Horváth Csaba Memorial Laboratory of Bioseparation Sciences.
■
ABBREVIATIONS:CGE capillary gel electrophoresis SDS sodium dodecyl sulfate Rs resolution
Ea activation energy PSA prostate specific antigen IgG immunoglobulin G Mw molecular weight SD standard deviation
■
(1) Walsh, G.REFERENCESNat. Biotechnol.2018,36, 1136.(2) Strohl, W. R.Protein Cell2018,9, 86−120.
Analytical Chemistry pubs.acs.org/ac Article
(3) Sanger-van de Griend, C. E. Electrophoresis 2019, 40, 2361−
2374.
(4) Shirahama, K.; Tsujii, K.; Takagi, T.J. Biochem.1974,75, 309−
319.
(5) Reynolds, J. A.; Tanford, C.Proc. Natl. Acad. Sci. U. S. A.1970, 66, 1002−1007.
(6) Guttman, A.; Nolan, J.Anal. Biochem.1994,221, 285−289.
(7) Rustandi, R. R.; Washabaugh, M. W.; Wang, Y.Electrophoresis 2008,29, 3612−3620.
(8) Liu, Y.; Reddy, P.; Ratnayjake, C. K.; Koh, E. V. Methods and compositions for capillary electrophoresis (CE). U.S. Patent 7,381,317, June 3, 2008.
(9) Harris, P. C.JPT, J. Pet. Technol.1993,45, 264−269.
(10) Pezron, E.; Ricard, A.; Leibler, L.J. Polym. Sci., Part B: Polym.
Phys.1990,28, 2445−2461.
(11) Offord, R. E.Nature1966,211, 591−593.
(12) Chrambach, A. The practice of quantitative gel electrophoresis;
VCH: Deerfield Beach, FL, 1985.
(13) Rickard, E. C.; Strohl, M. M.; Nielsen, R. G.Anal. Biochem.
1991,197, 197−207.
(14) He, L.; Niemeyer, B.Biotechnology progress2003,19, 544−548.
(15) Arrhenius, S.Z. Phys. Chem.1889,4, 226−248.
(16) Eyring, H.; Polanyi, M.Z. Phys. Chem. Abt. B1931,12, 279−
311.
(17) Guttman, A.; Kerekgyarto, M.; Jarvas, G.Anal. Chem.2015,87, 11630−11634.
(18) Cottet, H.; Gareil, P.Electrophoresis2001,22, 684−691.
(19) Lu, H.; Arriaga, E.; Da, Y.; Figeys, D.; Dovichi, N. J. J.
Chromatogr A1994,680, 503−510.
(20) Perfect Protein Markers, 10−225 kDa, 69079 EMD Millipore.
http://www.emdmillipore.com/US/en/product/Perfect-Protein- Markers-10-225-kDa,EMD_BIO-69079(accessed Dec 4, 2019).
(21) Demorest, D.; Dubrow, R.J. Chromatogr.1991,559, 43−56.
(22) Fang, Y.; Zhang, J. Z.; Hou, J. Y.; Lu, H.; Dovichi, N. J.
Electrophoresis1996,17, 1436−1442.