Global and Planetary Change 195 (2020) 103366
Available online 2 November 2020
0921-8181/© 2020 The Authors. Published by Elsevier B.V. This is an open access article under the CC BY license (http://creativecommons.org/licenses/by/4.0/).
Research article
Assessing anoxia, recovery and carbonate production setback in a hemipelagic Tethyan basin during the Toarcian Oceanic Anoxic Event (Western Carpathians)
Tam as Müller ´
a,b,*, Szabina Karancz
c,d, Emanuela Mattioli
e,f, Rastislav Milovský
a, J ´ ozsef P ´ alfy
g,h, Jan Schl ogl ¨
i, Tomasz Segit
j, Vladimír ˇ Simo
a, Adam Toma ˇ sových
aaEarth Science Institute, Slovak Academy of Sciences, Dúbravska cesta 9, 84005 Bratislava, Slovakia
bIsotope Climatology and Environmental Research Centre, Institute for Nuclear Research, Bem t´er 18/C, H-4026 Debrecen, Hungary
cDepartment of Ocean Systems, Royal Netherlands Institute for Sea Research (NIOZ), Landsdiep 4, 1797 SZ ’t Horntje, Texel, the Netherlands
dDepartment of Earth Sciences, Faculty of Geosciences, Utrecht University, Princetonlaan 8A, 3584, CB, Utrecht, the Netherlands
eENSL, CNRS, LGL-TPE, Univ Lyon1, Univ Lyon, F-69622 Villeurbanne, France
fInstitut Universitaire de France (IUF), France
gDepartment of Geology, E¨otv¨os Lorand University, P´ ´azm´any P´eter s´et´any 1/C, Budapest H-1117, Hungary
hMTA-MTM-ELTE Research Group for Paleontology, POB 137, H-1431 Budapest, Hungary
iDepartment of Geology and Paleontology, Faculty of Natural Sciences, Comenius University in Bratislava, Mlynsk´a dolina-G, Ilkoviˇcova 6, Bratislava 842 15, Slovakia
jInstitute of Geology, University of Warsaw, Zwirki i Wigury 93, Warszawa 02-089, Poland ˙
A R T I C L E I N F O Keywords:
Toarcian OAE Calcification crisis Carbon isotope stratigraphy Tethyan margin
Bioturbation
A B S T R A C T
The chemostratigraphic record of the Toarcian Oceanic Anoxic Event (T-OAE) is generally well documented in epicontinental basins; however, the duration of anoxia and recovery remains poorly constrained in the Tethys Ocean owing to limited stratigraphic resolution of oceanic sections with hiatuses. In this paper, we describe a relatively continuous hemipelagic record in the Central Western Carpathians of Slovakia (Skladan´a Skala sec- tion), which contains the Pliensbachian/Toarcian boundary, the T-OAE, and the subsequent recovery phase. In our section, the Pliensbachian Spinatum Zone is represented by a ~ 7 m thick alternation of spotted, spiculitic marly limestones and limestones of the Allg¨au Formation that contain moderately diverse trace fossils including abundant Zoophycos, Lamellaeichnus and Teichichnus. In the uppermost part of the Spinatum Zone, a ~ 0.8‰ decline in δ13Ccarb values marks the carbon isotope excursion (CIE) at the Pliensbachian/Toarcian boundary. This isotope anomaly is overlain by a ~ 3 m-thick interval of spotted marly limestones and marls, which contains a positive CIE that represents the base of the T-OAE. The T-OAE interval comprises a 60 cm-thick pyritic black shale interval that lacks bioturbation and shows a negative CIE (δ13Corg values drop by 4–5‰), coincident with an increase in TOC values (from 0.3% to 2–3%), and a drop in CaCO3 values (from 50 to 80% to 3–7%). The black shale is overlain by ~8 m thick marls with rare intercalations of marly limestones, which show ammonites of the Exaratum Subzone in the lowermost part (~1 m) succeeded by Serpentinum Zone beds. This unit exhibits a second positive CIE (δ13Corg increases by 2.5‰ and δ13Ccarb increases by 1.5‰), significantly more negative δ18O values relative to the pre-T-OAE interval, and a low diversity of trace fossils dominated by Chondrites and extremely thin Zoophycos. Sponge spicules re-appear in the uppermost 6.5 m-thick interval of the section formed by the alternation of spotted marls and limestones, with ammonites of the Falciferum Subzone in the lower part and of the Bifrons Zone in the uppermost parts; however, diversity of trace fossils remains low. Based on these findings, we argue that the 60 cm-thick pyritic black shale that represents the T-OAE is a strongly condensed succession because it includes the onset of the negative CIE and the subsequent rebound, and thereby encom- passes the full duration of the anoxic event. Anoxia in basins open to the oceanic Tethys thus coincided not only with reduced carbonate production but also with reduced siliciclastic supply, generating very thin black shale deposits. In contrast to current-swept swells where black shales associated with hardgrounds are thin or missing owing to winnowing, carbonate starvation was induced by a calcification crisis coincident with the T-OAE and siliciclastic starvation was probably induced by rapid sea-level rise. Although bottom waters were not anoxic in
* Corresponding author at: Earth Science Institute, Slovak Academy of Sciences, Dúbravska cesta 9, 84005 Bratislava, Slovakia.
E-mail address: beregond02@gmail.com (T. Müller).
Contents lists available at ScienceDirect
Global and Planetary Change
journal homepage: www.elsevier.com/locate/gloplacha
https://doi.org/10.1016/j.gloplacha.2020.103366
Received 20 November 2019; Received in revised form 27 October 2020; Accepted 27 October 2020
the aftermath of T-OAE, bioturbation remained restricted during the Falciferum Subzone in basinal settings, indicating that environmental stress induced by limited ventilation and/or high bottom-water temperatures were persistent. The reduced diversity of trace fossils and the re-appearance of sponge spicules close to the lower/
middle Toarcian boundary indicate that the ecological recovery in basins open to the oceanic Tethys was delayed, a pattern similar to the epicontinental seas that experienced anoxia.
1. Introduction
Two major carbon cycle perturbations related to CO2 emissions from the Karoo-Ferrar large igneous province and/or thermal metamorphosis of coal sediments in the Karoo Basin (e.g. McElwain et al., 2005; Svensen et al., 2007) are detected at the Pliensbachian-Toarcian boundary (Pl- To) (Littler et al., 2010) and during the Toarcian Oceanic Anoxic Event (T-OAE, Jenkyns, 1988; Jenkyns Event in Müller et al., 2017). These anomalies were associated with a second order mass extinction and faunal turnover in the composition of benthic and pelagic ecosystems, anoxia, global warming, and ocean acidification (P´alfy and Smith, 2000;
Macchioni and Cecca, 2002; Bailey et al., 2003; Hesselbo et al., 2007;
Caswell et al., 2009; Mattioli et al., 2009; Suan et al., 2010; Trecalli et al., 2012; Reolid et al., 2012a, 2012b; Müller et al., 2020). It has been also observed that the global extent of anoxia during the T-OAE led to widespread burial of organic carbon and consequently to deposition of organic-rich black shales in both marine and lacustrine settings (Wignall et al., 2005; Xu et al., 2017; Suan et al., 2018). The carbon cycle per- turbations are expressed by a short-term negative carbon isotope excursion (CIE) at the Pl-To (Hesselbo et al., 2007; Littler et al., 2010;
Bodin et al., 2016), followed by a broad positive excursion during the early Toarcian which was interrupted by a remarkably large (~ 5‰) negative CIE at the onset of the T-OAE (e.g. Hesselbo et al., 2007;
Hermoso et al., 2012; Müller et al., 2017). This pattern has been detected both in bulk and biogenic carbonates and in marine and terrestrial organic matter around the globe (e.g. Gr¨ocke et al., 2011; Al- Suwaidi et al., 2016; Izumi et al., 2018), but primarily in Peri-Tethyan epicontinental seas (e.g. Kemp et al., 2005; G´omez et al., 2008; Her- moso et al., 2009; Suan et al., 2008a; Hesselbo and Pie´nkowski, 2011).
During the T-OAE, both the NW European epicontinental basins (R¨ohl et al., 2001; McArthur et al., 2008; Thibault et al., 2018) and ocean-facing Tethyan shelves bordering the NW European platform were affected by widespread anoxia (Wignall et al., 2005; Suan et al., 2018; Müller et al., 2017; Ruebsam et al., 2018). The benthic recovery was more rapid and occurred in the wake of the T-OAE during the Serpentinum Zone on shelves that were not or only weakly affected by anoxia (e.g. in the Iberian Range, in the Lusitania Basin and in the Sahara Atlas; Gahr, 2005; Reolid et al., 2012a; Miguez-Salas et al., 2017;
Piazza et al., 2019). In contrast, the benthic recovery was delayed up to the onset of the next ammonite zone, i.e., it occurred during the Bifrons Zone, on epicontinental shelves that experienced long-term anoxia (García-Joral and Goy, 2009; García-Joral et al., 2011; Danise et al., 2015; Martindale and Aberhan, 2017). However, the dynamics of the T- OAE and the ecosystem recovery in deeper Tethyan oceanic environ- ments not directly attached to the European shelf remain poorly docu- mented or unknown. These environments were differentiated during the Pliensbachian and Toarcian into current-swept structural highs with condensed sedimentation (nodular limestones and hardgrounds) and more sheltered basins with less condensed marly hemipelagic deposits (Fig. 1). Chemostratigraphic analyses of sections proximal to oceanic domain documented high variation in the expression of the T-OAE owing to differences in water depth and sedimentation rate (Jenkyns et al., 1991; Sabatino et al., 2009; Arabas et al., 2017; Fantasia et al., 2019). Chemostratigraphic analyses across the T-OAE in Tethyan hemipelagic-pelagic basins either (1) documented long-term anoxia in the strongly restricted Úrkút and B¨achental basins (with Mn-rich sedi- ments and unique basin-specific diagenetic conditions, Vet¨o et al., 1997;
Neumeister et al., 2015; Polg´ari et al., 2016) or (2) inferred that anoxic
conditions were short-living or negligible (e.g., in the Betic Cordiller- aRodríguez-Tovar and Uchman, 2010). Deeper bathyal open-oceanic environments, less sensitive to water stratification in contrast to semi- enclosed epicontinental basins, may represent refugia for benthic groups under major environmental disturbances (Smith and Stockley, 2005; V¨oros, 2005; Thuy et al., 2012). For example, Baeza-Carratal¨ ´a et al. (2017) suggested that a deep pelagic trough on the South-Iberian palaeomargin (External Subbetic) represented a refugium for some brachiopod lineages. However, understanding the nature and distribu- tion of these refugia during the T-OAE remains limited as the extent and duration of anoxia and the extent of bottom-water warming (i.e., factors that affected ecosystem dynamics and extinctions of benthic fauna during the T-OAE in shelf environments; García-Joral et al., 2011;
G´omez and Goy, 2011; Baeza-Carratal´a, 2013; Them et al., 2018; Ull- mann et al., 2020) in these deeper oceanic environments is poorly understood.
For example, on the basis of bioturbation intensity and trace fossil diversity, Rodríguez-Tovar and Uchman (2010) and Rodriguez-Tovar and Reolid (2013) suggested that the duration of bottom-water oxygen depletion was rather short and that benthic communities (with bur- rowers and foraminifers) recovered quickly in the aftermath of the T- OAE during the Serpentinum Zone at the Fuente Vidriera section in the Betic Cordillera. A similar pattern in the recovery of trace-fossil as- semblages was observed in other hemipelagic sections in the Betic Cordillera (Reolid et al., 2014; Gallego-Torres et al., 2015). However, these findings of short-term or insignificant anoxia in hemipelagic oceanic basins and the estimates of rapid recovery can be biased by a reduced sedimentation rate during the T-OAE, and to a certain extent, by post-anoxic bioturbation (Danise et al., 2019). Both benthic and pelagic carbonate production was significantly reduced during the T-OAE (Mattioli et al., 2009; Trecalli et al., 2012; Ettinger et al., 2020; Krencker et al., 2020) and rapid sea-level rise associated with the T-OAE could induce starvation of siliciclastics in distal settings (Pittet et al., 2014).
Therefore, investigations of sedimentological, paleoecological and che- mostratigraphic patterns in continuous sections spanning the upper Pliensbachian-lower Toarcian are needed to assess the completeness and resolution of the T-OAE in deeper basinal settings of the Tethys Ocean.
Here, we analyze the Pliensbachian-Toarcian sediments in the Central Western Carpathians and document that organic-rich laminated sedi- ments and the Toarcian negative CIE are preserved just within ~60 cm thick condensed unit. In contrast to hemipelagic sections in the Betic Cordillera, benthic recovery was delayed throughout the Serpentinum Zone, similarly as in epicontinental seas.
2. Paleogeographic and stratigraphic setting
The Skladana Skala section is located in an abandoned quarry on the ´ northern margin of the Veˇlk´a Fatra Mountains of Slovakia (49◦7′15.66′′
N; 19◦13′27.98′′E), part of the Fatric Superunit (Kríˇzna Nappe) of the Central Western Carpathians (CWC). Paleogeographically, the CWC represents an eastern analog of the Austroalpine system during the Mesozoic. The Fatric Superunit, equivalent to the middle Austroalpine units in the Northern Calcareous Alps (H¨ausler et al., 1993), was bordered to the north by the shallower, more uplifted Tatric Superunit and passed to the south to the Veporic Unit (also partly equivalent to the middle Austroalpine units) and Hronic and Silicic units (equivalents to the upper Austroalpine units). During the Hettangian, the Central Western Carpathians were still attached to the passive European margin
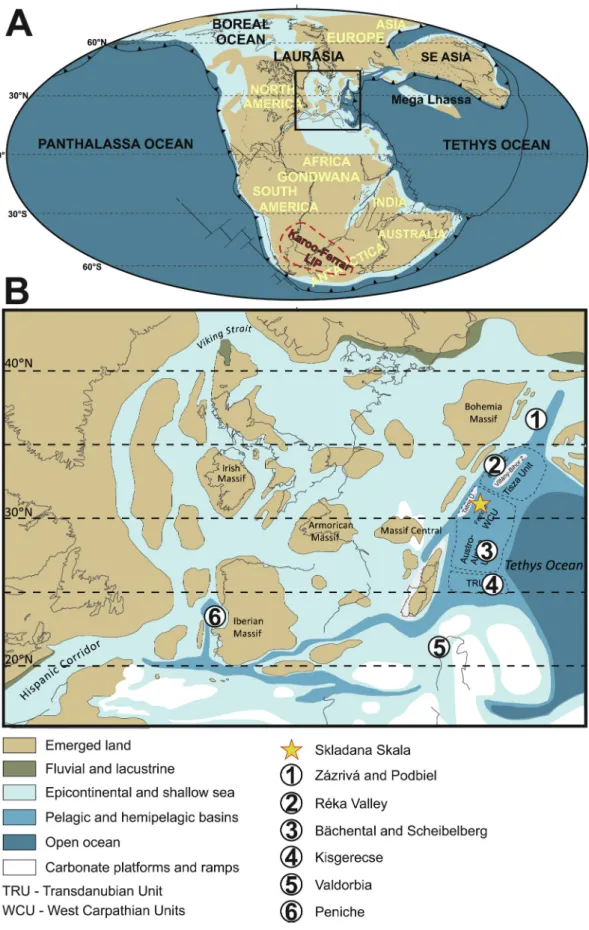
Fig. 1. A: Continent configuration and paleogeographic map of the Toarcian, indicating also the location and areal extent of the Karoo-Ferrar LIP (after Montero- Serrano et al., 2015). B: Paleogeographic map of the NW Tethys (modified from Thierry, 2000), and the positions of the NW Tethyan tectonic units (TRU: Trans- danubian Unit, Austro-Alpine Units, WCU: Western Carpathian Units and Tisza Unit; supposed areas marked with dashed line). Modified from H¨ausler et al. (1993) and Haas (2012). Numbered sites are the ones selected for comparison and chemostratigraphic correlation (see Fig. 9).
of the NW Tethys (Fig. 1).
The Kopieniec Formation was deposited on a shallow, mixed carbonate-siliciclastic ramp during the Hettangian in most depositional environments of the Fatric Superunit. Similarly to other regions of the Alpine Tethys (Krainer et al., 1994; Krainer and Mostler, 1997; Jim´enez et al., 1996), the Fatric Superunit was differentiated into swells and basins during the Sinemurian, with the deposition of crinoidal and oncoidal limestones on the shallowest swells, nodular and spiculitic limestones on swells and slopes, and spotted limestones and marls in grabens (Koˇsa, 1998; Gradzinski et al., 2004; ´ Jach, 2005). The Sinemurian-Toarcian in basins in the Fatric Superunit are represented by spotted limestones and marls (Fleckenkalk and Fleckenmergel) of the Allg¨au Formation (Rakús, 1963, 1964; Gradzinski et al., 2004) (also ´ referred to as Janovky Formation by Ga´zdzicki et al., 1979 or as the Sołtysia Marl Formation by Lefeld et al., 1985). In the southern and central parts of the Veˇlk´a Fatra Mountains, this formation pinches out and is replaced by red nodular limestones of the Adnet Formation (Miˇsík and Rakús, 1964). Towards the north, the Allg¨au Formation is also exposed in the northern parts of the Mal´a Fatra Mountains and in the West Tatra Mountains, where it can horizontally pass into spiculitic and crinoidal limestones, indicating proximity of another swell (Jach, 2002;
Iwa´nczuk et al., 2013).
At Skladan´a Skala, upper Sinemurian-middle Toarcian deposits of the Allg¨au Formation, from the Oxynotum Zone up to the Bifrons Zone, are exposed (Rakús, 1964, 1984). Rakús (1984) subdivided the succes- sion into three units, including the lower, ~70 m-thick unit of marly limestones that contain late Sinemurian ammonites (Oxynoticeras oxy- notum and Echioceras raricostatum), the middle, ~225 m-thick unit formed by alternation of limestones and marly limestones with late Pliensbachian ammonites in its upper part (Amaltheus stokesi and Pleu- roceras spinatum), and the upper, ~70 m-thick unit that is characterized by the prevalence of marls with lower and middle Toarcian ammonites.
Our work is focused on the upper part of the middle unit and on the
upper unit. ˇSimo and Tomaˇsových (2013) described trace fossils from the upper part of the lower unit and from the middle unit in this section.
3. Materials and methods
Two sections that were sampled at the Skladan´a Skala locality expose upper Pliensbachian-lower Toarcian strata. About ~25.4 m were logged in the western part of the quarry (S1) and 3.4 m (S2) on the eastern side of the quarry (Fig. 2). The T-OAE is preserved in a segment that overlies Bed 63 and it is better exposed at S2 than at S1 where this interval is affected by tectonic dislocations (low angle normal fault) (Fig. S1), therefore S2 was chosen as a complementary section. The two sections were correlated on the basis of ammonites of the Exaratum Subzone that occur immediately above Bed 64 and chemostratigraphy (Fig. S1). The sampling interval was 10 cm for geochemical and ~ 30 cm for nanno- fossil samples. 285 samples were collected for bulk rock analyses of CaCO3, total organic carbon content (TOC), organic carbon isotopes (δ13Corg) and carbonate carbon (δ13Ccarb) and oxygen (δ18Ocarb) iso- topes. Samples for analyses of microfacies in thin sections and for ana- lyses of trace-fossil assemblages in polished cross-sections were collected at regular, ~20 cm intervals.
Nannofossil assemblages were analyzed in 48 samples. The bulk sediment samples first were cleaned with a brush and then carefully sampled with a carbide pen under a binocular microscope to collect
~100 mg of micritic material, avoiding altered parts for carbonate car- bon and oxygen isotope analyzes. Aliquots of the material were pul- verized and homogenized (~10–60 g) in a rock mill in order to process them for organic carbon isotope, TOC and total carbonate analyzes.
Stable isotope, TOC and total carbonate analyzes were performed at the Earth Science Institute of the Slovak Academy of Sciences in Banska Bystrica.
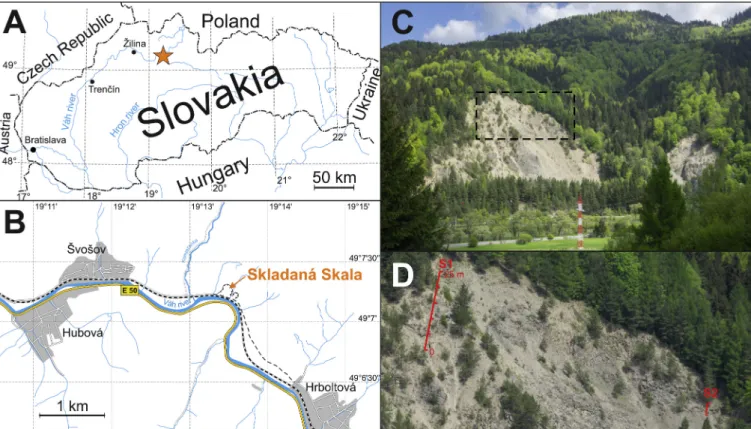
Fig. 2. A: Location of the Skladan´a Skala section in in Slovakia (orange star). B: Magnified map of the section’s locality and surroundings. C: The abandoned Skadan´a Skala quarry (Veˇlk´a Fatra Mountains) where the upper Pliensbachian-lower Toarcian successions with the T-OAE are exposed. D: Closer view of the locations of S1 and S2 sections.
3.1. Geochemical analyses
The carbon and oxygen stable isotope ratios of carbonates were measured using a Gasbench III preparation device coupled to isotope- ratio spectrometer (IRMS) MAT 253 (both Thermo Fisher Scientific).
Powdered samples of bulk sediments were loaded into 5 ml borosilicate glass vials (Labco), sealed by caps with rubber septa and flushed with helium to remove atmospheric gases. Subsequent acid digestion (McCrea, 1950) took place at 40 ◦C overnight. The evolved CO2 gas was analyzed in continuous-flow mode in helium as carrier gas. In each run, three reference gas peaks were followed by four pulses of sample CO2. Raw isotope ratios were calibrated using international reference mate- rial NBS18 with δ13C = − 5.014‰, δ18O = − 23.2‰ and two working standards with δ13C = +2.48‰, δ18O = − 2.40‰ and δ13C = − 9.30‰, δ18O = −15.30‰, respectively. Typical precision of measurement is 0.1‰ for carbon and 0.2‰ for oxygen. Isotope values are reported as permil vs. V-PDB, all the isotope values are reported as permil vs. V-PDB.
Stable carbon isotopes of organic matter were measured on the IRMS MAT253, coupled to elemental analyzer Flash2000 HT Plus (Thermo).
Organic residues after digestion in hydrochloric acid of about 60–100 micrograms were wrapped into tin cups and combusted at 1000 ◦C in quartz tube packed with chromium oxide, electrolytic copper and silvered cobaltous/cobaltic oxide. Purified CO2 gas was further sepa- rated from other gases on capillary GC column (Poraplot Q, Agilent) and lead into IRMS (MAT253) in continuous flow mode in a stream of he- lium. Raw isotope ratios measured against CO2 reference gas were calibrated to V-PDB scale using two international reference materials (USGS24 carbon, USGS41 glutamic acid) and two working standards (IVA urea, SUERC carbon) with δ13C values − 16.05, +37.76, − 39.79,
− 25.60, respectively. All the values are reported in permil V-PDB, typical external precision measured on standards is 0.1‰. Bulk rock samples show nine strong outliers in δ18Ocarb and one outlier in δ13Ccarb
that are strongly negative and exceed the average by more than two standard deviations (Fig. S2). These nine samples tend to have low concentrations of CaCO3 (four samples in the black shale Bed 64 have depleted values from − 9.7 to − 11.4‰, coinciding with 0–7.2% CaCO3
content) were excluded from analyses. Excluding these samples, δ18Ocarb
and δ13Ccarb values do not show any positive correlation as would be predicted under meteoric diagenesis (Marshall, 1992); in fact, the cor- relation is significantly negative (Pearson r = −0.52, p <0.001).
The TIC/TOC (total inorganic carbon/total organic carbon) ratios were measured on elemental analyzer Str¨ohlein C-MAT 5500. Pulver- ized samples were split into two aliquots of which one was digested in HCl, ca. 50 mg of both were combusted in temperature range 50–1000 ◦C, evolved CO2 was measured by infrared detector and carbon content calculated. The TIC/TOC concentrations were calibrated using pure CaCO3 and accuracy was verified using set of international stan- dards GM, BM, K1, K2, K3 with TIC/TOC 0.07/0.08, 0.40/0.10, 1.88/
0.47, 11.92/0.78, and 1.60/3.70, respectively. Precision of measure- ment in the weight range of our samples is 0.08 wt%.
3.2. Nannofossil preparation
Smear slides for the analysis of calcareous nannofossils from the interval comprised between the base of the section up to 14.43 m were prepared according the technique described by Bown (1998) at the Universit´e de Lyon. Samples from the upper part of the section were investigated at the Eotv¨ os Lor¨ and University (Budapest) following the ´ same procedure. Smear-slides were prepared from the powdered rock following the technique described by Beaufort (1991) and modified by Geisen et al. (1999). Two grams of material were mixed with a small amount of water and ultrasonicated. The suspended sample was diluted with further 20 ml water and transferred onto the cover slide in a settling device. The water was removed after 2 h of settling time and the air- dried cover slides were mounted on slides as in the standard technique (Bown, 1998). Slides were studied under a polarized optical microscope
at a 1000×magnification. Three traverses of each slide were scanned under a LEICA DM750P microscope (32 mm with a diameter of optical field of view of 200 μm) and all the nannofossils encountered were counted. The smear-slides prepared from the upper part of the section were analyzed under an Olympus BX51 microscope. Assemblage composition and abundance of nannofossils were studied in sixty fields of view per sample.
4. Results
4.1. Lithostratigraphic succession, microfacies and ichnofacies
A ~ 25 m thick composite succession (Figs. 3, S1) (the section S1 is 23.8 m-thick and the section S2 is 3.4 m-thick) exposes the upper Pliensbachian-Toarcian transition and the lowermost Toarcian. It belong to the Allg¨au Formation and is subdivided into four Units: (1) Unit 1 is formed by ~7 m-thick (beds − 3 to 44 at S1) alternation of 10–40 cm thick, grey marly limestone and limestone beds, with sporadic
~1–10 cm-thick marly intercalations. Limestones and marly limestones are formed by poorly sorted spiculitic wackestones (Fig. 5), with well- preserved or degraded tubes of the agglutinated foraminifer Bathy- siphon formed by sponge spicules. Marls are characterized by calcisiltic packstones with worn crinoids. This unit is characterized by a moderately-diverse ichnofauna, with abundant Zoophycos (with the burrow diameter up to 5 mm), Chondrites, Lamellaeichnus, Teichichnus, Palaeophycus, Teichichnus, Planolites and Bathysiphon (Fig. 5).
(2) In the 4.7 m-thick Unit 2 (Beds 44–63), the thickness of marly limestone beds is reduced to ~10–20 cm and the thickness of marly intercalations increases upwards, up to an 80 cm-thick marl in Bed 61.
Limestones still comprise spiculitic wackestones and packstones in the lower part (Fig. 5), whereas radiolarian-spiculitic wackestones and packstones in marly limestone beds 52–62 (similarly as in Unit 1, marly intercalations are formed by microbioclastic crinoidal packstones). Both marly limestones and marls are dominated by Zoophycos and Chondrites;
Lamellaeichnus, Teichichnus, and Bathysiphon are also frequent (Fig. 5).
(3) A ~ 60 cm thick, black and finely laminated organic-rich shale (Bed 64) rich in pyrite in the upper 30 cm is well exposed at S2. This layer does not contain any visible trace fossils. (4) Above the black shake, a ~ 8.7 m-thick interval is generally composed of grey-brownish, monotonous fissile marls or marly limestones. Several 5–10 cm-thick marly limestone beds with abundant ammonites occur in the lowermost part of this Unit. The fissile marls and marly limestones are character- ized by a poorly-diverse ichnofacies formed by Chondrites and by simple, concordantly oriented, 1–2 mm-thick planar and several cm-long bur- rows of Zoophycos (Fig. 5). Planolites and Paleophycus are less frequent.
High abundance of thin burrows and their concordant orientation generate a characteristic, relatively regular fabric formed by mm-scale alternation of light-grey sediment bands and dark-grey burrows. The microfacies are represented by mudstones and wackestones with dispersed worn crinoidal fragments, benthic foraminifers, ostracods, and molluscan fragments. (5) A ~ 6.5 m-thick interval is characterized by the re-appearance of marly limestone beds (Beds 72–89), by low diversity of trace fossils with four taxa, including Zoophycos, Chondrites, Planolites and Palaeophycus, and by re-appearance of persistent radio- larians in thin sections. Sponge spicules also re-appear in Bed 72 although their abundance is mostly low. However, in contrast to the units below the black shale bed (Unit 3), units 1 and 2, Lamellaeichnus and Bathysiphon are missing and density and diversity of trace fossils remains low (Fig. 5). Limestone beds are composed of radiolarian wackestones and packstones in beds 72–87 (Fig. 5). Isolated specimens of Bositra buchi occur in Bed 75 and in overlying beds.
4.2. Ammonites
Numerous Amaltheus sp. and rare Leptaleoceras sp. pointing to the late Margaritatus Zone (Gibbosus Subzone) occur in outcrops below the
measured S1 and S2 sections. Scarce fragments of Pleuroceras in Bed 4 and rare Emaciaticeras in beds 23 and 28 (section S1) indicate that Unit 1 belongs at least partly to the uppermost Spinatum Zone (Fig. 3).
Although the Tenuicostatum Zone of the lower Toarcian is not docu- mented by in situ ammonites, a single specimen of Dactylioceras (Eodactylites) mirabile indicative of the lower part of the Tenuicostatum Zone was found in the debris, suggesting that this zone is preserved within Unit 2 between the last occurrence of the late Pliensbachian ammonites in Bed 28 and the earliest ammonites of the Exaratum Sub- zone at the base of Unit 4 (Fig. 3). The lowermost 1 m of the Unit 4 (section S2) is characterized by abundant ammonites, with Harpoceras serpentinum, Eleganticeras exaratum, E. elegans, Dactylioceras (Ortho- dactylites) semicelatum, and D. (O.) semiannulatum. The co-occurrence of
E. exaratum and E. elegans, along with H. serpentinum in the beds 65–69 indicates that this interval belongs to the middle/upper parts of the Exaratum Subzone (sensu Howarth, 1992a, 1992b) or respectively the upper part of the Elegantulum Subzone (Strangewaysi Horizon, see Elmi et al., 1997). The marly interval just above the Bed 69 (section S2) yielded a fragment of Harpoceras sp. with weakly developed lateral spiral groove and falcate ribs. Fragment of Harpoceras cf. falciferum, index species of the Falciferum Subzone, was collected in the lower part of the thick marly interval between beds 71 and 72. (section S2).
Following taxa were all collected from section S1. The Bed 72 (i.e., the base of Unit 5) is rich in ammonite fragments, mostly of Harpoceras ex gr.
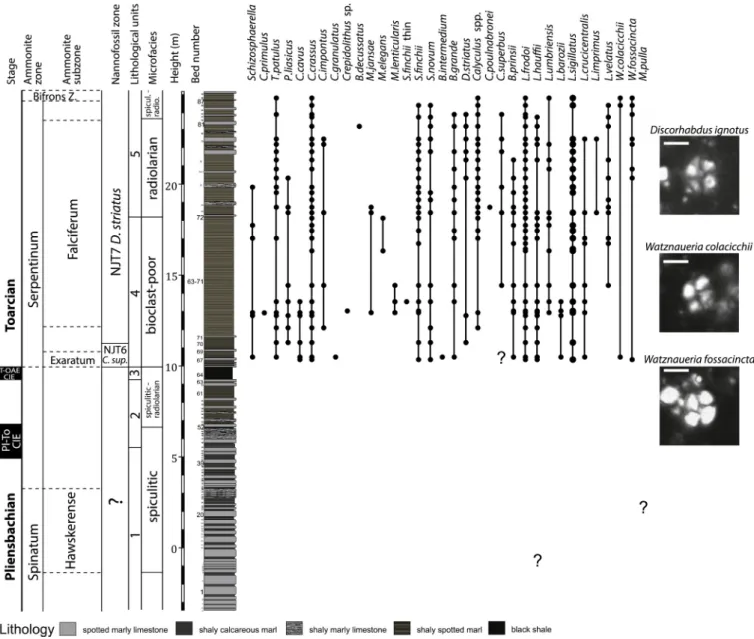
mediterraneum and scarce Hildaites cf. murleyi. A single specimen of Cingolites cf. clavatus was found in a thin limestone bed situated 50 cm Fig. 3. Composite log, lithology, microfacies, lithological units and biostratigraphic distribution of ammonite taxa in the Skladan´a skala section. Ammonites: A.
Pleuroceras sp., Emaciaticeras ex gr. ferridum, C. Dactylioceras (Eodactylites) mirabile, D. Eleganticeras elegans, E. E. exaratum, F. Dactylioceras (Orthodactylites) semi- annulatum, G. Nodicoeloceras cf. crassoides, H. Harpoceras serpentinum, I. Harpoceras mediterraneum, J. Hildaites cf. murleyi. Scale bar for ammonites: 10 mm.
above Bed 75 and several fragments of Hildaites were found in Beds 81 and 83. All these taxa still indicate the Falciferum Subzone of the Ser- pentinum Zone. Bed 87 contains fragments of Hildoceras pointing already to the Bifrons Zone of the middle Toarcian. Occurrence of Dactylioceras gr. commune was documented ~3.7 m above Bed 85 (after a soil covered interval). The first occurrence of Dactylioceras gr.
commune was found ~3.7 m above Bed 85 (covered interval).
4.3. Calcareous nannofossil
Calcareous nannofossils are extremely rare or not age-diagnostic in the samples studied from the upper Pliensbachian-lowermost Toarcian units 1–2 and in the black shale interval. Nannofossils appear in the interval just above the black shale interval corresponding to the T-OAE and are present, although with low abundances, up to the top of the section (upper part of lower Toarcian and the Bifrons Zone). This in- crease in abundance of calcareous nannoplankton in wake of the T-OAE is a common trend in many localities from the North margin of the Tethys (Bucefalo-Palliani et al., 2002; Mattioli et al., 2009; Suan et al., 2018).
The earliest event encountered is the first occurrence of the genus
Watznaueria at 10.3 m (right above the black shale unit, Bed 64) with the species W. fossacincta, shortly followed by the first occurrence of W. colacicchii (Fig. 4). The first occurrence of Discorhabdus striatus is recorded 1.3 m above the top of the black shale. This is the marker species of the NJT7 Discorhabdus striatus Zone (Bown, 1998; Mattioli and Erba, 1999; Ferreira et al., 2019). Thus, even in the absence of C. superbus, which first occurs later in the section, the below interval is assigned to the NJT6 Zone. The base of NJT7 zone corresponds to the upper part of the Falciferum Subzone and coincides with the return to pre-excursion values of the δ13C after the CIE corresponding to the T- OAE (Ferreira et al., 2019).
4.4. CaCO3 content and TOC
With the exception of the black shale in Unit 3, the small-scale stratigraphic variability in CaCO3 content is driven by decimeter-scale alternation of limestones and marls, with median values in limestones attaining 58–73% and in marls attaining 34–45%. At the scale of the five stratigraphic units, median TOC gradually increases from 0.22% in Unit 1 (Spinatum Zone) to 0.32% in Unit 2, markedly increases in the black shale to 1.6% (with 3.3% at maximum), and drops to 0.37% and 0.31%
Fig. 4. Composite log, lithology, microfacies, lithological units and biostratigraphic distribution of nannofossil taxa in the Skladan´a skala section. Scale bar for nannofossils: 5 μm.
in Units 4 (Exaratum Subzone) and 5 (Falciferum Subzone and Bifrons Zone), respectively (Fig. 7 and Table S1). Median CaCO3 gradually de- clines from 56% in Unit 1 to 49% in Unit 2, markedly declines to 7% in the laminated black shale (Unit 3), and rebounds to 46% and 38% in Units 4 and 5, respectively. With the exception of the black shale in Unit 3, the overall stratigraphic decline in CaCO3 and the increase in TOC are primarily driven by an increasing proportion of clay and declining proportion of limestones, rather than by changes in concentrations of CaCO3 and TOC within marls or within limestone beds. However, CaCO3
still declines significantly within the marls upsection, from ~45% in Unit 1 to ~35% in Unit 5 (Mann-Kendall trend test, p =0.002). In contrast, CaCO3 concentrations within the limestones do not change
upsection (Mann-Kendall trend test, p =0.11).
4.5. Carbon and oxygen isotopes
The bivariate relationship between δ18Ocarb, δ13Ccarb and δ13Corg
shows that samples fall into two main groups according to their strati- graphic position. The samples from the pre-T-OAE units 1–2 are char- acterized by more positive δ18Ocarb and more negative δ13Ccarb and δ13Corg, whereas the samples from the post-T-OAE units are character- ized by more negative δ18Ocarb and more positive δ13Ccarb and δ13Corg
(Fig. 8 and Table S1). With the exception of the black shale where the carbonate phase is subordinate and does not allow reliable Fig. 5.Stratigraphic changes in microfacies composition, with spiculitic wackestones and packstones with Bathysiphon in the Spinatum Zone (A-C, Unit 1) shifting to of spiculitic-radiolarian microfacies in beds 52–63 (D-G, Unit 2). Bioclast-poor mudstones and wackestones occur in Unit 4 (beds 65–71) immediately above the black shale (T-OAE). Radiolarian mudstones and wackestones in the upper part of the Serpentinum Zone in Unit 5 (H-L). Scale bars: 0.2 mm.
measurements, δ13Ccarb and δ13Corg show similar trends that can be subdivided into four phases: Phase 1. Stable values in δ13Ccarb and δ13Corg in Unit 1, with δ13Corg fluctuating around − 27.6‰ and δ13Corg
around 1–1.5‰, without any clear trend. The decimeter-scale variability in δ13Corg shows high-frequency fluctuations by ~2‰. This variability is associated with a gradual decline in δ18Ocarb, declining on average from
~ − 3.1‰ to ~ − 4‰, with a relatively large scatter between − 2.3‰ - -4.9‰ (Fig. 7 and Table S1). Phase 2. A clear negative excursion in δ13Ccarb by ~0.8‰ (minimum =0.4‰) and a minor excursion in δ13Corg
can be observed between 4.9 and 7.1 m in beds 40–54, at the boundary between Units 1 and 2. The location of this excursion between the last occurrences of ammonites from the Spinatum Zone and the first appearance of ammonites of the Exaratum Subzone (about 4 m below the main negative CIE, phase 4 below) indicates that it corresponds to the Pliensbachian/Toarcian transition interval (Fig. 7). The δ13Corg re- cord shows a mild excursion by 0.5‰ that is not as strong as reported at other sites (Littler et al., 2010; Bodin et al., 2016). The δ18Ocarb further declines by ~1‰ at ~5.9–8 m above the Pliensbachian/Toarcian tran- sition interval (Beds 54–59). Phase 3. This is the first phase of the pos- itive CIE in Unit 2, with δ13Ccarb increasing from 0.5‰ to 1.5‰ and δ13Corg increasing from − 28‰ to − 26‰ up to Bed 61. Phase 4. A sharp negative CIE in organic matter of ~5‰ between ~9.2 and ~ 11.3 m is detected in the black shale (Unit 3), reaching a minimum of − 30.9‰ at
~9.8 m in the upper, pyrite-rich part of Bed 64 (Fig. 7). δ18Ocarb values sharply decline by 1.5‰ between the pre-T-OAE beds and post-T-OAE
beds within the Exaratum Subzone (Beds 65–68), with the minimum of − 5.7‰.
Phase 5. This second phase of the positive CIE, dated to the NJT7 nannofossil zone, shows a gradual increase from 1.5‰ up to 2.5‰ in δ13Ccarb, and from − 27‰ up to 25‰ in δ13Corg, with the highest values in the upper parts of Unit 4 at ~15 m, followed by a gradual reversal towards more negative values in Unit 5. A short negative excursion in δ13Ccarb by ~1.8‰ interrupts the general declining trend in the upper Falciferum Subzone at 20.5–22.3 m (Fig. 7). The δ18Ocarb record displays a mild positive trend upsection with gradually decreasing values by
~1‰ to the top. This trend is interrupted by a ~ 1.5‰ negative excur- sion between 20.5 and 22.3 m, at the same level where the δ13Ccarb
shows a negative anomaly (Fig. 7).
5. Discussion
5.1. Preservation of the isotopic signal
The isotopic signals obtained from the samples of the Skladan´a Skala section are well-preserved with the exception of samples from the black shale (Bed 64). Nevertheless, thin calcite veins might appear in some beds, they were carefully avoided during the sample preparation, furthermore thin-section observations do not indicate any alteration of the micrite to microsparite (with the exception of μm-scale overgrowths on nannofossils) or to coarser late-diagenetic cements. Although Fig. 6. Trace-fossil assemblages in polished cross-sections showing the transition from pre-extinction ichnofacies with diverse trace fossils in units 1 and 2 (A-C) to the post-extinction ichnofacies in Unit 4 (D-F) and in Unit 5 (G-I). A. Limestone bed 21 with Lamellaeichnus, Zoophycos, Chondrites and Planolites. B. Limestone bed 37 with abundant Teichichnus. C. Fissile marly limestone bed 49 with abundant Lamellaeichnus. D. Marly bed with Chondrites and thin burrows of Zoophycos, 167 cm above the top of bed 67. E. Marly bed with abundant Chondrites, 165 cm above the top of bed 67. F. Marly limestone bed 69 with abundant Planolites. G. Limestone bed 74 with abundant Chondrites and Planolites. H. Limestone bed 79 with abundant Planolites. I. Limestone bed 85 with abundant Zoophycos, Planolites, and Chondrites. Labels: Z-Zoophycos, C-Chondrites, P-Planolites, Pa-Palaeophycus, L-Lamellaeichnus, T-Teichichnus. Vertical scale bar: 5 mm.
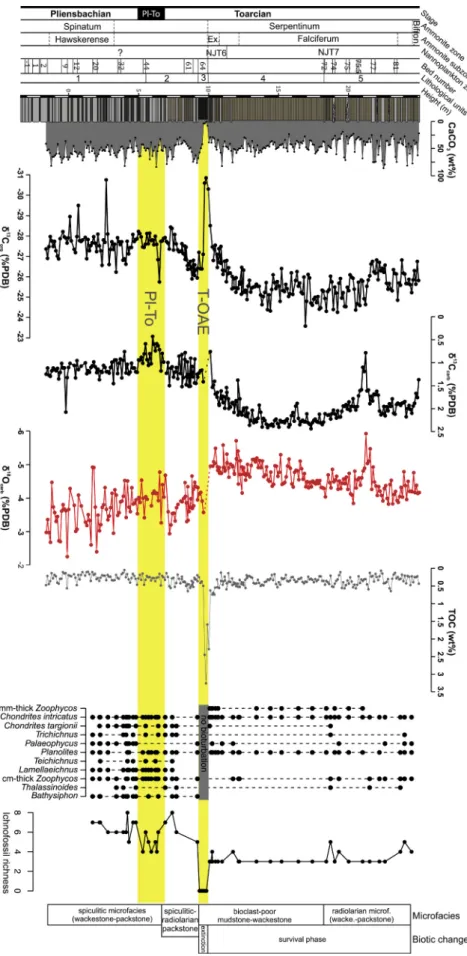
Fig. 7. High resolution CaCO3, δ13Corg, δ13Ccarb, δ18Ocarb
and TOC data from the upper Pliensbachian–lower Toarcian succession at Skladan´a Skala. Data points of δ13Ccarb and δ18Ocarb from the T-OAE level were excluded from the record because primary carbonate is negligible and the negative δ13Ccarb and δ18Ocarb values reflect microscopic calcite veins.
Right side: distribution of trace fossils and microfacies changes indicate that the recovery in taxonomic richness of trace fossils was delayed during the Serpentinum Zone. The loss of bioturbation in Bed 64 coinciding with the negative CIE and very small concentrations of CaCO3 marks the extinction phase, followed by very limited bioturbation in the Exaratum and Falciferum subzones.
δ18Ocarb from the black shale level are very negative (below − 9‰), this level contains very little amount of carbonate (0–7 wt%) and contains only very thin (<1 mm) calcite veins that likely determined the highly negative δ18Ocarb. Therefore, δ13Ccarb and δ18Ocarb data from this level were excluded from interpretation. Meteoric diagenesis tends to shift δ13Ccarb and δ18Ocarb to negative values (Marshall, 1992), but the bivariate relation between δ13Ccarb and δ18Ocarb does not show any positive correlation (excluding ten outliers specified in Methods, Pear- son r = − 0.52, p <0.001, Fig. S2). The only exception is the anomaly in the Unit 5 with highly negative δ18Ocarb, probably reflecting local diagenetic overprint. The general stratigraphic correspondence between negative and positive phases in δ13Ccarb and δ13Corg indicates that stratigraphic trends in δ13C of both components are not biased by diagenetic effects. The five isotopic phases based on positive and
negative δ13C anomalies do not have any counterparts in the record of δ18Ocarb, and absolute values in δ18Ocarb are likely biased by lithification towards more negative values as is typical of bulk-sample measure- ments, but the abrupt and persistent shift towards negative values be- tween units 1–2 on one hand and units 4–5 on the other hand is not associated with any major facies or diagenetic change, and can reflect a shift towards warmer bottom-water temperatures during the T-OAE as observed in other well-preserved sections.
5.2. Pliensbachian/Toarcian boundary negative CIE and the first phase of positive CIE
A distinct negative excursion in δ13Ccarb by ~0.8‰ between 4.9 and 7.1 m (Fig. 7) is located ~2–4 m above the last occurrence of ammonites Fig. 8.Major stratigraphic difference in stable isotopic composition of carbonates and organic matter at the boundary between the Tenuicostatum Zone and the Exaratum Subzone (corresponding to the boundary between the units 2 and 3) applies not only to δ13Ccarb and δ13Corg but also to δ18Ocarb. In contrast, the difference does not propagate to differences in TOC (with the exception of the black shale unit). Carbon isotopes and CaCO3 in the upper parts show a reversal to some degree but do not fully recover to pre-T-OAE values.
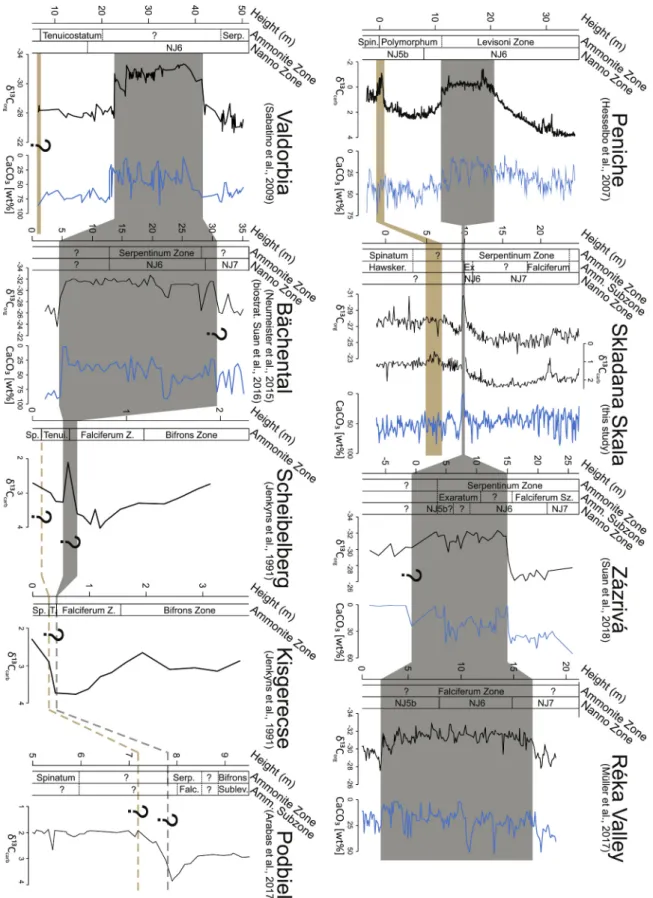
Fig. 9. Carbon isotope chemostratigraphic correlation of Skladan´a Skala with the Peniche GSSP section from the Lusitanian basin (Hesselbo et al., 2007) and with few of the key NW Tethyan sections used in this study: Z´azriv´a from Pieniny Klippen Belt (Suan et al., 2018); R´eka Valley from Mecsek Zone of the Tisza Unit (Müller et al., 2017); Valdorbia from Umbria-Marche (Sabatino et al., 2009), B¨achental and Scheibelberg, Northern Calcareous Alps (Neumeister et al., 2015; Suan et al., 2016; Jenkyns et al., 1991), Kisgerecse, Transdanubian Unit (Jenkyns et al., 1991); Podbien, Pieniny Klippen Belt (Arabas et al., 2017). Grey band is marking the correlation of the T-OAE and brown one the Pl-To negative CIE. Question marks are indicating uncertain levels in correlation. CaCO3 data from sections where it was available is presented (blue lines). (For interpretation of the references to colour in this figure legend, the reader is referred to the web version of this article.)
of the Spinatum Zone in bed 28. The chemostratigraphic record of the Pl- To negative carbon excursion observed in other regions indicates that the anomaly starts already in the uppermost Pliensbachian (Fig. 7, see also Littler et al., 2010; Trecalli et al., 2012; Bodin et al., 2010, 2016;
Ait-Itto et al., 2017; Menini et al., 2019; Ferreira et al., 2019), suggesting that the Pliensbachian/Toarcian boundary transition interval is located at 4.9–7.1 m based on the δ13Ccarb curve (Fig. 7). This prominent CIE of the Pliensbachian/Toarcian boundary has been reported from different regions from bulk, belemnite and brachiopod carbonate and also from bulk organic matter and fossil wood, usually showing a negative shift in a range of 2–4‰.
The negative CIE at the Pliensbachian/Toarcian boundary probably marks the onset of release of greenhouse gases through volcanism of the Karoo-Ferrar LIP (precursor activities before the main phase coinciding with the T-OAE) or by methane-hydrate release (Jenkyns and Clayton, 1997; Hesselbo et al., 2007; Suan et al., 2010; Littler et al., 2010; Bodin et al., 2016; Ait-Itto et al., 2017; Menini et al., 2019), and is thus dynamically linked with the T-OAE. Although this excursion marks the onset of elevated benthic extinctions at provincial or global scales (Harries and Little, 1999; Caruthers et al., 2013), it did not seem to markedly affect hemipelagic settings in the Tethys Ocean. The diversity of trace fossils and the ichnofabric in Unit 2 remains similar or slightly declines relative to Unit 1, although the assemblage becomes more dominated by Zoophycos. This interval also coincides with a relatively abrupt appearance of abundant radiolarians, forming spiculitic- radiolarian packstones in beds 52–62, but this microfacies shift prob- ably reflects the rapid sea-level rise close to the Pliensbachian/Toarcian boundary as also observed in other Tethyan basins (Hardenbol et al., 1998; Pittet et al., 2014), leading to the deepening of the depositional environment. The lack of strong response can be partly explained by dysoxic bottom-water conditions that characterized the deposition of spotted marls and limestones with thin fully-mixed layer above the redoxcline and inefficient mixing organic-rich sediment below it, typical of semi-enclosed hemipelagic basins with limited ventilation (ˇSimo and Tomaˇsových, 2013; Reolid and Reolid, 2020). Spotted marls and lime- stones are typically dominated by remains of siliceous sponges and by agglutinated foraminifers (Bathysiphon), and carbonate producers such as mollusks, brachiopods or echinoderms are very rare (ˇSimo and Tomaˇsových, 2013).
The duration of the Pliensbachian/Toarcian negative CIE is esti- mated to be ~120–240 kyr (Bodin et al., 2016; Ait-Itto et al., 2018;
Boulila et al., 2019). Therefore, the small magnitude of the 0.8‰ negative excursion at the Pliensbachian/Toarcian boundary can be subdued owing to regional factors resulting in smaller carbon isotope fractionation or by reduced net sedimentation rate (Bodin et al., 2016;
Ait-Itto et al., 2018; Boulila et al., 2019). The δ13Corg record at Skladan´a Skala shows an even milder excursion relative to the excursion in δ13Ccarb (Fig. 7), resembling the record without any sharp excursion in δ13Corg at the Amellago section in the Central High Atlas in Morocco (Bodin et al., 2016). The subtle nature of the δ13Corg excursion can be related to enhanced contribution of terrestrial organic matter (van de Schootbrugge et al., 2013; Suan et al., 2016). However, Unit 2 shows a trends towards positive values, that is reflected by both δ13Corg and δ13Ccarb, corresponding to the first phase of the long-term positive CIE.
5.3. Early Toarcian negative CIE excursion
The onset of the negative CIE associated with the T-OAE is defined as the first significant drop in δ13C in the upper part of the Tenuicostatum Zone and the rebound is defined as the inflection point to more positive values in the Serpentinum Zone in NW European sections (Fig. 7, Hes- selbo et al., 2007; Bodin et al., 2016). The δ13Corg values at Skladan´a Skala show both an onset and rebound of negative values between 9 and 10.3 m. The prominent negative excursion by ~5‰, and the most negative values (− 30 to − 31‰) are limited to 40 cm-thick uppermost, laminated and pyrite-rich part of the black shale (Bed 64) (Fig. 7).
Ammonites of the Exaratum subzone occur in beds that immediately overlie the black shale, confirming that the negative excursion in δ13Corg corresponds to the T-OAE. The magnitude of the δ13Corg negative CIE (~5‰) and the most negative values (− 30 to − 31‰) (Fig. 7) at Skladan´a Skala are equivalent to the magnitude of CIE observed in other Tethyan and NW European epicontinental settings (Sabatino et al., 2009; Neumeister et al., 2015; Suan et al., 2015; Müller et al., 2017;
Ruebsam et al., 2018; Xu et al., 2018). Similarly as in other regions, the main negative CIE is associated not only with the absence of burrowing benthic fauna but also with the significant reduction in carbonate input, showing that the defaunation (i.e., extinction phase) and the collapse of carbonate production is also expressed in the stratigraphic record of hemipelagic basins in the Central Western Carpathians.
5.4. Second phase of positive CIE excursion
Both the δ13Corg and δ13Ccarb curves show a broad positive CIE in the lower Toarcian at Skladan´a Skala, which is interrupted by the negative CIE of the T-OAE (Fig. 7). The second phase of the positive CIE, starting immediately above the black shale, spans the Eaxaratum Subzone and the NJT6 in the lowermost part, and the Falciferum and the NJT7 in the middle and upper parts, in line with other records in various Tethyan localities (Ferreira et al., 2019). This character of the lower Toarcian carbon isotope record indicates widespread, enhanced organic matter production and burial resulting in the depletion of 12C in the global carbon pool during the Tenuicostatum and Falciferum zones, terminat- ing close to the beginning of the Bifrons Zone (Jenkyns et al., 1991;
Jenkyns et al., 2002; Hermoso et al., 2013). The full preservation of the positive CIE at Skladan´a Skala indicates that sedimentation rates were higher relative to the T-OAE interval, and the effects of local factors (that modulated the expression of the negative excursion at the Pliensba- chian/Toarcian boundary) did not confound the expression of the global cycle. Trace-fossil assemblages are effectively limited to four ichnotaxa in units 4 and 5 (i.e., they correspond to survival phase as pre-extinction diversity levels are higher), represented primarily by Chondrites and by thin Zoophycos, and by less frequent Planolites and Paleophycus (Fig. 6).
Bioclast-poor microfacies in Unit 4, with worn crinoidal fragments, foraminifers, ostracods and mollusks and without sponge spicules and radiolarians, indicates that the decline in trace-fossil diversity in the wake of the T-OAE is not simply reflecting an increase in water depth (that would predict a direct replacement of spiculitic-radiolarian microfacies by radiolarian microfacies). Therefore, environmental stress, possibly driven by oxygen depletion and by persistently-higher bottom-water temperature, i.e., the two factors that contributed to the T-OAE extinction (Baeza-Carratal´a et al., 2015; Dunhill et al., 2018; Rita et al., 2019; Ros-Franch et al., 2019), probably contributed to the delayed recovery in hemipelagic basins of the Central Western Carpathians.
5.5. Reduced input of siliciclastics during the T-OAE
A comparison of the Skladan´a Skala sections with other NW Tethyan (oceanic) and epicontinental basins (e.g., Lusitanian Basin) reveals two specific features (Fig. 9). First, the biostratigraphic data and chemo- stratigraphic correlation of the negative and positive CIEs with other regions indicate that the stratigraphic extent of the T-OAE (Unit 3) is extremely limited in comparison to thickness preserved on epiconti- nental shelves. At epicontinental shelves that were paleogeographically close to the Central Western Carpathians (Sections 1–2 in Fig. 1B), anoxic sediments exhibiting the negative CIE are significantly thicker.
Black shales dated to the Exaratum Subzone exhibit the negative CIE over >10 m in the Pieniny Klippen Belt at Zazriv´a (Suan et al., 2018).
The entire record of T-OAE with the negative CIE is formed by a ~ 13 m- thick, laminated black shale unit in the R´eka Valley in the Mecsek (Müller et al., 2017) (Fig. 9). These locations were not yet segregated from the European passive margin by other basins and were located
closer to the source of river-borne siliciclastic input. Second, the observation that most of the negative CIE almost fully corresponds to the laminated black shale and that this CIE does not encompass bioturbated sediments indicates strong condensation rather than representing only short-term anoxia. The appearance of D. striatus just 1.3 m above the top of the black shale, marking the NJT7 zone correlative of the upper part of the Falciferum Subzone (Bown, 1998; Mattioli and Erba, 1999; Perilli, 2000; Ferreira et al., 2019), indicates that net sedimentation rate was still very low during the alternation of marls and marly limestones (with ammonites of the Exaratum Subzone) just above the black shale. The thickness of Unit 3 is also limited relative to the first and second phase of the long-term positive CIE, represented by ~4.5 m in the lower part (the duration of Tenuicostatum – or Polymorphum - Zone is difficult to constrain, ~0.3–0.8 Myr long; Suan et al., 2008b; Huang and Hesselbo, 2014; Boulila and Hinnov, 2017) and by ~15 m in the upper part (subtracting the duration of the T-OAE, the late Serpentinum Zone can have the duration of ~1 Myr, Boulila et al., 2014). The duration of the entire negative CIE is estimated as ~300–900 kyr on the basis of as- tronomical calibrations (Suan et al., 2008b; Boulila et al., 2014; Huang and Hesselbo, 2014), this time interval is just preserved in few deci- meters at Skladan´a Skala. The large magnitude of the CIE indicates that the anomaly is not averaged out by condensation of pre-CIE and CIE deposits or by condensation of CIE and post-CIE deposits, respectively.
The slow sedimentation rate was thus not associated with a significant temporal change in the isotopic composition of organic matter deposited on the seafloor. The condensation of the black shale and of the overlying bioturbated sediments of the Exaratum Subzone and of the lower part of the Falciferum Subzone probably includes diastems or short-term hia- tuses but they did not leave any geochemical or mineralogical signal as there is no evidence of firmgrounds or hardgrounds.
The condensation of the T-OAE in sections of red nodular limestones that were deposited on pelagic swells (Scheibelberg and Kisgerecse, Jenkyns et al., 1991, and Podbiel, Arabas et al., 2017) is not surprising owing to the effects of currents and bypassing. However, the negative CIE in Tethyan oceanic sections shows signs of condensation also in basinal settings. For example, δ13Corg record of the B¨achental section in the Northern Calcareous Alps displays a sudden negative shift in the lower Toarcian, marking the onset of the T-OAE (Neumeister et al., 2015), also indicating some degree of condensation at the onset of the negative CIE. The overall condensation during the T-OAE is thus not only driven by (1) the collapse of the hemipelagic carbonate factory but also by (2) starvation of siliciclastic supply. The latter (2) is probably associated with marine transgression concurrent with global warming at the onset of the negative CIE (Pittet et al., 2014; Ruebsam et al., 2019).
Even when the T-OAE was in turn characterized by enhanced conti- nental weathering that led to higher clay accumulation rate on epicon- tinental shelves (Dera et al., 2009; Hermoso and Pellenard, 2014), this effect was probably insufficient to compensate for retrogradation of siliciclastic sediments in oceanic environments. To summarize, the findings of thin T-OAE laminated deposits in hemipelagic basins do not indicate that deeper oceanic habitats represented refugia that were affected by anoxia only for a brief duration.
5.6. Carbonate production setback in NW Tethyan shelf
Sediments at Skladan´a Skala are composed of micritic hemipelagic limestones and marls with variable contribution of clay and micro- crystalline diagenetic silica, without any silty or coarser siliciclastic fractions (other than clay) that would imply significant terrestrial in- fluence. The initial decline in CaCO3 within Unit 2, also associated with the increasing proportion of marls, co-varies with the first phase of the CIE. The significant drop in CaCO3 to 0–7% coinciding with the negative CIE and an increase in TOC in the black shale demonstrates that the carbonate factory suffered a significant setback during the T-OAE, similarly as in other Tethyan regions. Although the deposition of marls with 30–40% of CaCO3 returned still during the Exaratum Subzone, in
the aftermath of the T-OAE, the deposition of limestone beds with >60%
of CaCO3 was renewed during the late Serpentinum Zone only. A drop in CaCO3 associated with the T-OAE negative CIE has been identified at numerous locations in NW European epicontinental basins, in Tethyan basins and in carbonate platforms as well, and probably reflects a major calcification crisis (Suan et al., 2008a; Sabatino et al., 2009; L´eonide et al., 2012; Suan et al., 2018; Brame et al., 2019). Multiple mutually not exclusive scenarios can explain this calcification crisis, including changes in carbonate saturation level of seawater due to increased emission of CO2, temperature rise, and/or eutrophication due to accel- eration of hydrological cycle and changes in surface water salinity (Mattioli et al., 2009; Trecalli et al., 2012; Hermoso et al., 2012; Müller et al., 2020). Our record is showing that the calcification crisis severely affected the carbonate factory that was the major source of hemipelagic micritic sediments in a basinal setting in the Central Western Carpa- thians. In a broader context, the decline in carbonate sedimentation has affected large parts of the NW Tethyan shelf. Chemostratigraphic cor- relation of key NW Tethyan localities, together with available CaCO3 records indicates that carbonate production decline is similarly closely associated with the onset of the negative excursion in Valdorbia, R´eka Valley, and B¨achental (Fig. 9). The condensed nature of the T-OAE at pelagic swells can be partly accounted for by winnowing and sediment bypassing, but the independent evidence for decline in carbonate export in basinal sections indicates that the lack of carbonate sediments also contributes to condensation at Scheibelberg, Kisgerecse, and Podbiel (Fig. 9).
5.7. Delayed recovery
The recovery pattern of benthic communities after the T-OAE differed between epicontinental seas with widespread anoxia and basins less affected or unaffected by anoxic conditions. On one hand, benthic communities in the Lusitanian and Iberian basins or in Algeria recovered relatively quickly, still during the Serpentinum Zone (Gahr, 2005; Gar- cía-Joral et al., 2011; Reolid et al., 2012a, 2012b). In contrast, the Peritethyan or Panthalassan shelf environments were affected by anoxia for longer periods, and the diversity of benthic communities with bra- chiopods, mollusks, and trace producers was typically delayed into the middle Toarcian, i.e., it occurred during the Bifrons Zone (García-Joral et al., 2011; Martindale and Aberhan, 2017; Caswell and Frid, 2017;
Caswell and Dawn, 2019). The slower recovery in those basins can be explained by longer duration of anoxia coupled with the lack of facili- tative effects of opportunistic burrowers that can bioirrigate the sedi- ment and increase nutrient recycling. This delayed recovery contrasts with more rapid recoveries that characterized less enclosed shelf and oceanic basins or shallower habitats less exposed to persistent or repeated anoxia (Woodfine et al., 2008; Caswell and Coe, 2012). The loss of trace fossils in the T-OAE black shale and the poorly-diverse ichnofacies (either limited to monotypic Chondrites levels or to levels with very thin Zoophycos) in the overlying post-extinction strata indicate that although bottom-water conditions were not anoxic in the wake of the T-OAE in the Central Western Carpathians, some degree of oxygen depletion persisted for a significant duration (i.e., Serpentinum Zone) in hemipelagic basins in the. The duration of this survival phase can be also affected by persistence of higher bottom-water temperatures as δ18Ocarb
in units 4–5 are significantly more negative than δ18Ocarb in units 1–2.
Although the overall replacement of spiculitic microfacies by spiculitic-radiolarian microfacies between units 1 and 2 and the domi- nance of radiolarian microfacies in Unit 5 may be explained by an in- crease in water depth (that occurred both during the Pliensbachian/
Toarcian boundary and during early Toarcian) and by reduced flux of particulate organic matter required by filter-feeders such as sponges, this explanation does not explain the unique post-extinction pattern observed just above the black shale. First, the presence of bioclast-poor mudstones and wackestones without radiolarians and sponge spicules in Unit 4 shows that the paleoecological trends in microfacies and