Research Article
Geochemical evolution of the lithospheric mantle beneath the Styrian Basin (Western Pannonian Basin)
László El ő d Aradi
a, Enik ő Bali
b, Levente Patkó
a,c,1, Károly Hidas
d,2, István János Kovács
e, Alberto Zanetti
f, Carlos J. Garrido
d, Csaba Szabó
a,e,⁎
aLithosphere Fluid Research Laboratory, Department of Petrology and Geochemistry, Institute of Geography and Earth Sciences, Eötvös Loránd University, Budapest 1117, Hungary
bNordic Volcanological Center, Institute of Earth Sciences, University of Iceland, Sturlugata 7, 101 Reykjavík, Iceland
cInstitute for Nuclear Research, Isotope Climatology and Environmental Research Centre, Debrecen, Hungary
dInstituto Andaluz de Ciencias de la Tierra (IACT), Consejo Superior de Investigaciones Científicas (CSIC)-Universidad de Granada, 18100 Armilla, Granada, Spain
eResearch Centre for Astronomy and Earth Sciences (CSFK), Geodetic and Geophysical Institute, Sopron 9400, Hungary
fInstitute of Geosciences and Earth Resources, National Research Council of Italy (CNR-IGG), I-27100 Pavia, Italy
a b s t r a c t a r t i c l e i n f o
Article history:
Received 15 April 2020
Received in revised form 6 October 2020 Accepted 10 October 2020
Available online 14 October 2020
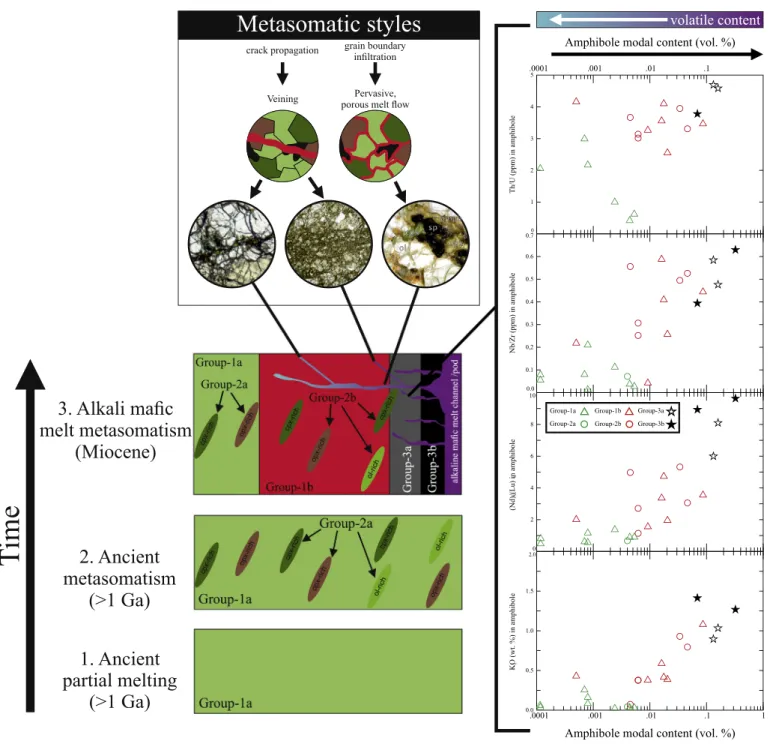
The Styrian Basin is located at the westernmost part of the Carpathian-Pannonian region, in the transition zone between the Pannonian Basin and the Eastern Alps. The lithospheric mantle beneath the Styrian Basin (SB) was sampled by Plio-Pleistocene alkali basalts, which brought mantle xenoliths to the surface. Mantle xenoliths from the SB are mostly coarse granular, amphibole-bearing spinel lherzolites with microstructures indicating ex- tensive annealing. Three geochemical events were recorded in the SB xenoliths. The initial, ancient partial melt- ing event was followed by an old metasomatism, which formed lithological heterogeneities (e.g. websterite, dunite) occurring as veins, bands and layers. The most recent geochemical event recorded in the SB xenoliths is the migration of a hydrous alkaline melt originating from a nephelinitic melt source. This melt migrated from the asthenosphere, forming melt channels in the lithospheric mantle. Close to the channels, the metaso- matic agent caused extensive amphibole and sparse phlogopite formation. This particular pargasite-phlogopite equilibrium mineral assemblage in the spinel facies was not described before in the literature based on our knowledge. The reaction caused significant enrichment in basaltic elements (such as Ti, Fe), K, light rare earth el- ements and incompatible trace elements such as Zr and Hf. Further from the channels, the metasomatic melt be- came enriched in volatiles (mainly H2O and CO2) andfluid mobile elements (e.g. U, Pb, Cl and P), but depleted in basaltic elements, K and LREE, which resulted in modal decrease of amphiboles. Previous studies suggested a dehydrating subducted slab beneath the Styrian Basin, however geochemicalfingerprints of subducted slab de- rivedfluids were recognized only in one xenolith. Mantle portions with different geochemical characteristics de- veloped in the lithosphere laterally, however metasomaticfingerprints were erased later due to annealing and chemical re-equilibration at ambient mantle conditions. The Neogene evolution of the lithosphere overwrote the previous state of the upper mantle beneath the region, thus the signs of the most recent metasomatism by nephelinitic melts could have been only preserved due to this extensive annealing event.
© 2020 The Authors. Published by Elsevier B.V. This is an open access article under the CC BY-NC-ND license (http://
creativecommons.org/licenses/by-nc-nd/4.0/).
1. Introduction
To better understand the Neogene lithospheric evolution of the Carpathian-Pannonian region (CPR) numerous studies were performed on upper mantle xenoliths derived from volcanicfields (Fig. 1A) includ- ing the central parts (Bakony Balaton Highland and Little Hungarian Plain: e.g.Bali et al., 2007;Berkesi et al., 2012;Downes et al., 1992;
Embey-Isztin et al., 2001;Hidas et al., 2010; Szabó et al., 1995), and the northern (Nógrád-Gömör: e.g.Liptai et al., 2017and references therein), and eastern margins (Perşani Mountains) (e.g.Chalot-Prat and Boullier, 1997;Falus et al., 2008;Vaselli et al., 1995).
⁎ Corresponding author at: Lithosphere Fluid Research Laboratory, Department of Petrology and Geochemistry, Institute of Geography and Earth Sciences, Eötvös Loránd University, Budapest 1117, Hungary.
E-mail addresses:aradi.laszloelod@ttk.elte.hu(L.E. Aradi),eniko@hi.is(E. Bali), levente.patko@ttk.elte.hu(L. Patkó),k.hidas@igme.es(K. Hidas),
kovacs.istvan.janos@csfk.mta.hu(I.J. Kovács),zanetti@crystal.unipv.it(A. Zanetti), carlos.garrido@csic.es(C.J. Garrido),cszabo@elte.hu(C. Szabó).
1Currently: Research Centre for Astronomy and Earth Sciences (CSFK), Geodetic and Geophysical Institute, Sopron 9400, Hungary.
2Currently: Departamento de Investigación y Prospectiva Geocientífica, Instituto Geológico y Minero de España, Tres Cantos, Madrid, Spain;k.hidas@igme.es
https://doi.org/10.1016/j.lithos.2020.105831
0024-4937/© 2020 The Authors. Published by Elsevier B.V. This is an open access article under the CC BY-NC-ND license (http://creativecommons.org/licenses/by-nc-nd/4.0/).
Contents lists available atScienceDirect
Lithos
j o u r n a l h o m e p a g e :w w w . e l s e v i e r . c o m / l o c a t e / l i t h o s
Upper mantle derived xenoliths from the Styrian Basin (SB) were mentioned early (e.g.Heritsch, 1908) (Fig. 1B). Most papers focused on the best-known and studied localities in Kapfenstein and Tobaj (e.g.Coltorti et al., 2007;Dobosi et al., 1999, 2010;Kurat et al., 1980;
Vaselli et al., 1996), despite the fact that numerous pyroclastic deposits and lavaflows contain upper-mantle derived rock fragments (e.g.Bojar et al., 2013;Fig. 1B). From the deposit located in Slovenia (Grad) only petrographic data are published (Hinterlechner-Ravnik and Mišič, 1986). According to these studies, the lithospheric mantle beneath the SB is rather uniform both texturally and geochemically, thus it was used widely as a proxy for a primitive, undeformed subcontinental lithospheric mantle (SCLM). Coarse-grained, protogranular and porphy- roclastic texture dominate the xenoliths that exhibit fertile geochemical characters. The studies also infer minor modal and cryptic metasoma- tism caused by CO2-H2O-rich mafic alkaline melts, based on the trace el- ement geochemistry of clinopyroxenes and amphiboles (Coltorti et al., 2007;Dobosi et al., 1999, 2010;Vaselli et al., 1996). However, a recent petrographic and deformational study integrated with the structural hydroxyl content of nominally anhydrous minerals (NAMs) from new SB xenolith localities (Aradi et al., 2017) suggests that the lithospheric mantle is not homogeneous and is structurally complex under the SB.
According toAradi et al. (2017), the SCLM beneath the SB could have interacted with hydrousfluids resulting in extensive recrystallization and formation of hydrous minerals, which constrained the geochemical evolution of the Styrian Basin SCLM.
The goal of this study is to provide a detailed petrographic and geo- chemical database of upper mantle xenoliths of the SB. We report on samples from ten new localities, which were not studied previously.
Our comprehensive geochemical dataset, combined with the previously published textural and microstructural data, and structural hydroxyl
content, helps to reveal the evolution of the lithospheric mantle beneath the western edge of the Miocene Pannonian Basin. Due to the geody- namic situation of the Styrian Basin (i.e. in between the Alps and the central part of the Pannonian basin), this paper provides essential in- sight into physical and chemical processes of the lithospheric mantle, which could preservefingerprints of different subduction phases and magmatic events during the Cenozoic. Additionally, a particular pargasite-phlogopite mineral assemblage is described, which testifies enrichment of the SCLM in both H2O and K2O in the spinel peridotite facies.
2. Geological background
The Carpathian-Pannonian region (CPR) is a young Miocene Medi- terranean style extensional back-arc basin (e.g.Horváth et al., 2015), which is surrounded by the Bohemian Massif, the East European and Moesian Platform, the Dinarides, and the Alps, and the Carpathians (Fig. 1A, e.g.Csontos and Vörös, 2004;Fodor et al., 1999). It is composed of two major tectonic blocks: the ALCAPA (ALps-CArphathian PAnnonian) and the Tisza-Dacia, which are separated by the Mid- Hungarian Fault Zone (e.g. Bada and Horváth, 2001; Csontos and Vörös, 2004). The Styrian Basin is the westernmost sub-basin of the CPR (Ebner and Sachsenhofer, 1995), situated in the transitional zone between the Eastern Alps and the central part of the Pannonian Basin (Fig. 1A). The evolution of the SB is closely related to CPR geodynamics.
The SB was developed above an Alpine lithospheric wedge (ALCAPA), which was displaced (from the late Oligocene to Early Miocene) east- wards ~450 km (e.g. Ebner and Sachsenhofer, 1995;Kázmér and Kovács, 1985;Ratschbacher et al., 1991). During the extrusion the lith- osphere of the ALCAPA stretched and thinned, mainly in the central part
Fig. 1.A: Simplified tectonic map of the Carpathian-Pannonian region (CPR) and its surroundings (Harangi, 2001b;Szabó et al., 1992). Mantle xenolith-bearing alkaline basalts are present in the following volcanicfields: Styrian Basin Volcanic Field (SBVF); Little Hungarian Plain Volcanic Field (LHPVF); Bakony-Balaton Highland Volcanic Field (BBHVF);
Nógrád-Gömör Volcanic Field (NGVF); Persani Mountains Volcanic Field (PMVF). The inset shows the location of the CPR in Europe. B: Simplified geological map of the Styrian Basin modified afterBojar et al. (2013).
2
(4–8 times in the central part,Huismans et al., 2001;Fig. 1A), but also affected the basin at the margins (e.g.Bada and Horváth, 2001), al- though less intensively (1.4–1.6 in the SB;Huismans et al., 2001). A SW oriented asthenospheric flow is suspected as the cause of the extrusion of the ALCAPA (Kovács et al., 2012), besides the collapse of the Alpine orogeny (Ratschbacher et al., 1991). The lithosphere- asthenosphere boundary (LAB) is at ~100 km depth, according to Horváth et al. (2006), and shows a small gradual thickening to the NW (Fig. 1B). More recent geophysical study byBianchi et al. (2014) suggests significantly shallower LAB beneath the basin (60–80 km).
The thickness of the crust is 27–30 km (Fig. 1B,Horváth et al., 2006). Ac- cording to seismic tomographic models (e.g. Dando et al., 2011;
Mitterbauer et al., 2011), evidence for a WSW-ENE oriented fast downwelling structure is observed in the upper mantle beneath the Styrian Basin. This anomaly could be related to the remnant of the de- tached Penninic slab (Mitterbauer et al., 2011;Qorbani et al., 2015) yielding an excellent study area for lithosphere evolution.
In Early to Middle Miocene times andesite to shoshonite magmas erupted in the south-eastern part of the Styrian Basin due to the ongo- ing extension and lithosphere thinning, which initiated melting in the metasomatized lithospheric mantle (Ebner and Sachsenhofer, 1995;
Harangi, 2001a;Harangi et al., 1995). Based on the geochemistry of these volcanic rocks, a metasomatic event in the mantle could have hap- pened above a subducted slab, probably during the Late Eocene subduc- tion of the Penninic slab (Aradi et al., 2017;Harangi et al., 1995).
From the Late Miocene, the Pannonian Basin is in a compressional tectonic region, which leads to a tectonic inversion up until recent times (Fodor et al., 1999;Horváth et al., 2006). Due to this event, rapid and significant uplift affected the Styrian Basin (Ebner and Sachsenhofer, 1995). During this compressional phase from Miocene to Pleistocene times, the SB was the area of alkali basalt volcanic activity (Ali et al., 2013;Embey-Isztin et al., 1993;Heritsch, 1967). These post- extensional alkali basalts transported spinel peridotites and pyroxenites from the SCLM to the surface (e.g.Szabó et al., 2004). The alkali basalt volcanism was active from between 7.5 and 1.7 Ma with two significant episodes at 5.5–5 and 3–2.5 Ma (Fig. 1B;Balogh et al., 1994;Bojar et al., 2013;Pécskay et al., 2006). Their melts were generated by small volume
(2–3%) decompression melting probably initiated by an upward as- thenosphericflow (Embey-Isztin et al., 1993;Harangi et al., 2015).
3. Sampling and analytical methods
Alkali basaltic volcanism can be found all across the Styrian Basin (Fig. 1B), where basaltic lavaflows, tuffs andsyn-eruptively reworked volcanoclastic deposits contain mantle xenoliths (e.g.Bojar et al., 2013 and references therein;Jugovics, 1915). We sampled 16 localities (Aradi et al., 2017) and collected >150 upper mantle xenoliths. From the localities of Limbach, Altenmarkt, Unterweissenbach and Grad, there were no xenoliths found to be suitable for a detailed petrographic and geochemical studies, mainly due to their size (<2 cm) or strong al- teration. We selected 35 fresh xenoliths for detailed petrographic and geochemical study (Fig. 2,Table 1). These xenoliths are 3–30 cm in di- ameter. Only the xenoliths from Stein bei Fürstenfeld (SBF,Fig. 1B) are hosted in basalt lava, all the others are found in pyroclasts and other reworked volcaniclastic rocks. Often a thin (1–10 mm) glassy basalt rind covers xenoliths. Most xenolith are rectangular or slightly rounded in shape. We prepared 150–600μm thick double polished sections from all selected xenoliths. These sections were used to carry out all petro- graphic and chemical analyses.
The major element analyses of the rock forming minerals were car- ried out using a CAMECA SX50 electron microprobe in Padua at CNR Institute for Geosciences and Earth Resources (IGG) and using a CAMECA SX100 electron microprobe at the DionýzŠtúr State Geolog- ical Institute, Bratislava. Both instruments operated with routine con- ditions of 15–20 kV accelerating voltage and 10–20 nA beam current.
Counting times were 10 s at the peak and 5 s at the background for major elements and 20–40 s at peak and 10 s at the background for minor elements. Beam diameter varied between 3 and 10μm. The de- tection limits of measured elements range from 0.02 to 0.1 wt%, and statistical errors from 0.02 to 0.1 wt% (1σ). The oxide weight percent- ages were gained from X-ray counts by using PAP correction program (Pouchou and Pichoir, 1991). Calibration on the SX50 was carried out based on the following standards: Si (jadeite), Ti (ilmenite), Al (pla- gioclase), Fe (ilmenite), Mn (rhodonite), Ni (nickel), Cr (chromite), Mg (olivine), Na (jadeite), K (sanidine). For the SX100, the following reference materials were used: Si (orthoclase), Ti (TiO2), Al (Al2O3), Fe (fayalite), Mn (rhodonite), Cr (chromite), Ni (nickel), Zn (willem- ite), V (vanadium), Ca (wollastonite), Mg (MgO), Na (albite), K (ortoclase), F (LiF), Cl (NaCl).
Trace element analyses of ortho-, clinopyroxene, amphibole and mica were performed by LA-ICP-MS at Institute of Geosciences and Earth Resources, C.N.R., Pavia, Italy, using a Perkin Elmer ELAN DRC- e quadrupole mass spectrometer coupled with a Q-switched Nd:YAG laser source Brilliant (Quantel, Les Ulis, France). The laser was oper- ated at a repetition rate of 10 Hz, with a pulse energy of ~35 mJ.
Helium was used as carrier gas and was mixed with Ar downstream of the ablation cell. Spot diameter was adjusted in the range of 40–100μm. Data reduction was performed offline using the GLITTER software. Precision and accuracy of the trace element concentrations were assessed through repeated analysis of the BCR2-g standard to be better than ±7% and ± 10%, respectively, at the ppm concentration level (for further details seeMiller et al., 2012). NIST SRM 610 syn- thetic glass standard was used as external standard and CaO was used as internal standard for clinopyroxene and amphibole, whereas SiO2was used for orthopyroxene and phlogopite.
Complementary measurements on the heterogeneous clinopyro- xenes were carried out at the Andalchron analytical facilities of the IACT (CSIC, Armilla, Granada, Spain) using of Photon Machines Excimer 193 nm wavelength Laser (G2-Analyte Excite) technique attached to an Agilent 8800 ICP-MS/MS. The laser acquisition parameters were: ~12 J/
cm2energy density, 10 Hz repetition rate and 40–100μm spot size. The primary calibration standard was the NIST612 synthetic glass (Pearce et al., 1997). The internal standard was CaO for the clinopyroxenes.
Fig. 2.Modal compositions of the studied Styrian Basin xenoliths in the system of Streckeisen (1976). Data of previous studies of Styrian Basin (SB) xenoliths is from Richter (1971), Kurat et al. (1980) and (1991) and Vaselli et al. (1996).
Composition of the average European subcontinental lithospheric mantle (SCLM) is based onDownes (1999).
For quality control, we analyzed the BIR-1G and BHVO-2G reference glasses (Jochum et al., 2005) as secondary standards. Data processing was carried out using Iolite 2.5 software (Paton et al., 2011). Data com- parison between the clinopyroxenes measured at both institutions can be found in Supplementary Text 1.
Micro-Raman spectroscopic analysis was done to determine the composition of apatite at the Research and Industrial Relations Center of the Faculty of Science, Eötvös University, Budapest, using a HORIBA Labram HR800 spectrometer with Nd:YAG laser (λ= 532 nm). The de- tails of the used analytical methods are described in more details in Sup- plementary Text 1.
4. Petrography
The detailed petrographic features for most of our Styrian Basin xe- noliths are reported inAradi et al. (2017). Here, we summarize the typ- ical petrographic characteristics of the xenoliths and provide more details about features connected to mineral reactions at mantle condi- tions and textures associated with metasomatic processes. We divided the xenoliths into three groups based on their lithology and texture.
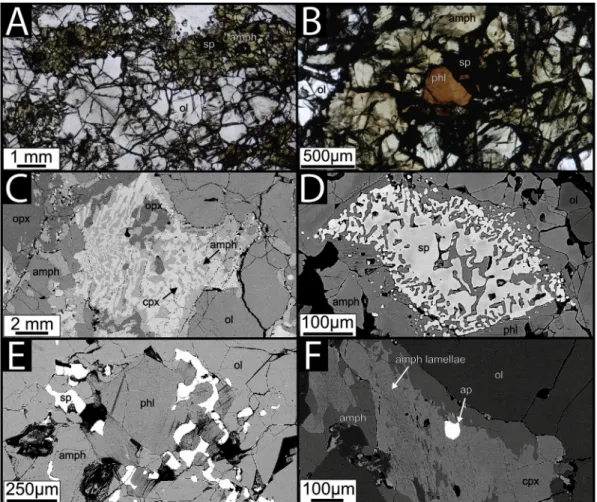
Group-1 xenoliths have coarse grained (average grain size between 1500 and 3000 μm) protogranular and porphyroclastic textures (Fig. 3A,Aradi et al., 2017). Based on their modal compositions, most of them are amphibole-bearing lherzolites (30 out of 35;Fig. 2). Amphi- bole usually appears as a rim on clinopyroxenes and spinels (Fig. 3B).
Group-2 xenoliths show the same petrographic textures as Group-1 xenoliths, however they display lithological heterogeneities in the forms of veins, monomineralic layers or bands (e.g.Fig. 3C and D).
Veins vary in thickness from 0.2–0.5 mm (Fig. 3C) up to 1–5 mm (Fig. 3D). Bands have diffuse border with the wall rock and occur for ex- ample as 2.5 cm thick dunite (Fig. 3D). Group-2 lherzolite RGB1456 (Fig. S1) has a sheared, amphibole-bearing zone, described in detail in Supplementary Text 2.
Group-3 xenoliths make up four amphibole-rich (> 5 vol%) perido- tites, in which phlogopite was also identified. Phlogopite was previously found in a hornblendite from Kapfenstein (Kurat et al., 1980) and in clinopyroxenite from Tobaj (Richter, 1971). Phlogopite is always in- cluded in amphibole (Fig. 4B, D and E), forming single crystalflakes or small clusters with grain size ranging between 100 and 500 μm (Fig. 4E). In the core of phlogopites vermicular spinels were found Table 1.
Summary table of the main petrographic and geochemical properties of the studied Styrian Basin xenoliths. Degree of melting is calculated based onHellebrand et al., 2001. Negative values were omitted (n.d.) Abbreviations: ol–olivine; opx–orthopyroxene; cpx–clinopyroxene; spl–spinel; amp–amphibole; phl–phlogopite; ap–apatite; lhz–lherzolite; hzb– harzburgite; wht–wehrlite; wbs–websterite; prot - protogranular; porph–porphyroclastic; fg eq -fine grained equigranular; Fo - forsterite content of olivine. Equilibrium temperature calculations were based onBrey and Köhler, 1990; TBK), also modified byNimis and Gütter, 2010(TNG);Witt-Eickschen and Seck (1991, TWES) andLiang et al. (2013; TREE).
Xenolith Locality Lithology Group Ol Opx Cpx Spl Amp Phl Ap TBK TNG TWES TREE TBK- TREE
Fo Sp
Cr#
Degree of melting (%)
LaN/LuN
in cpx YN
AUB1407 Auersbach prot lhz 1a 68 18 11 2.5 0.24 1049 975 979 1032 ± 36 17 89.5 9.1 46.14 0.38 4.0
AUB1410 prot lhz 1a 58 26 13 2.3 0.08 1038 972 1014 1007 ± 25 31 90.5 11.5 48.39 0.36 3.9
BEI1401 Beistein ol-wbs 1b 34 39 21 1.6 2.46 1022 999 958 1053 ± 46 -32 90.0 8.8 n.d. 5.70 3.6
BEI1402 prot lhz 1a 45 36 16 3.5 n.d. 1056 993 979 1065 ± 6 -9 89.3 9.3 46.29 0.58 4.3
BEI1403 phl-bearing
wht
3b 63 n.d. 5 n.d. 32.4 + n.a n.a n.a n.a n.a 85.6 63.9 65.58 7.33 4.2
BEI1404 prot lhz 1a 69 18 12 1.2 n.d. 951 908 996 1044 ± 13 −93 90.2 12.0 48.85 0.45 4.0
BF1411 Burgfeld phl-bearing hzb
3a 68 11 5 0.0 15.94 + + 968 937 793 1020 ± 78 −52 88.2 51.6 63.44 11.96 5.1
FKG1402 Forstkogel prot lhz 2b 60 24 14 0.3 0.45 988 978 966 986 ± 40 2 88.6 9.4 46.42 3.12 4.1
GN1401 Gnas porph lhz 1b 68 19 10 0.9 2.04 896 912 949 939 ± 8 −42 90.4 17.9 52.86 8.13 2.2
GN1402 porph lhz 2b 61 25 12 2.2 n.d. 944 915 954 1018 ± 0 −73 90.1 20.8 54.36 3.63 2.4
dunite vein 90 2 4 3.3 1.17 n.a n.a n.a n.a n.a n.a n.a n.a n.a n.a
GN1406 prot lhz 1a 60 23 14 2.3 0.44 956 939 944 1036 ± 31 −80 90.2 11.5 48.46 0.30 3.7
GN1407 phl-bearing
hzb
3a 66 19 2 0.1 13.21 + + 1029 942 763 n.a n.a. 90.4 51.5 63.41 n.a. n.a.
GN1411 porph lhz 1b 75 18 6 0.9 0.92 906 939 927 960 ± 24 −54 90.4 22.4 55.08 13.00 2.2
GN1412 porph lhz 1a 71 15 12 1.4 0.01 973 944 965 957 ± 8 15 90.1 10.9 47.86 0.21 4.5
GS0611 Güssing fg eq lhz 71 18 9 1.1 0.01 770 801 822 1476 ± 217 −706 90.2 26.2 56.67 1.76 0.3
GS1408 porph lhz 1a 58 34 6 2.1 0.01 911 894 967 971 ± 31 −60 91.1 19.3 53.58 0.42 3.8
KPFS0402 Kapfenstein prot lhz 1a 46 35 17 1.2 0.19 1053 1007 1018 1035 ± 9 18 90.1 11.9 48.73 0.63 3.8
KPFS0404 prot lhz 1a 73 14 12 1.2 0.17 1027 976 985 1029 ± 19 −2 89.9 11.2 48.16 0.30 3.5
KPFS0420 prot lhz 1a 70 13 15 1.4 0.04 1054 986 1014 1062 ± 9 −8 89.8 9.8 46.82 0.28 3.2
KPFS0421 prot lhz 1a 55 33 10 2.1 n.d. 1047 983 1006 1016 ± 21 31 89.9 14.8 50.94 0.28 3.4
NH0601A Neuhaus am Klausenbach
porph lhz 1a 66 23 10 1.1 n.d. 860 919 1007 921 ± 52 −60 90.2 16.4 51.95 0.61 3.7
NH0602B porph lhz 1a 61 28 10 1.5 0.5 1083 929 902 937 ± 6 146 89.1 9.6 46.63 0.29 4.9
NH1402 porph lhz 1a 53 27 16 3.2 0.08 967 909 983 1039 ± 1 −71 89.7 9.5 46.50 0.15 4.3
NH1408 porph lhz 1b 70 20 10 0.7 0.05 950 895 960 962 ± 82 −12 90.6 15.4 51.37 3.58 3.7
PST1401 Pertlstein prot lhz 1a 58 29 12 0.9 0.01 985 976 1047 1186 ± 14 −201 90.4 17.2 52.43 0.72 3.5
PST1403 porph lhz 1a 63 21 13 3.1 0.02 964 953 1003 1028 ± 14 −64 90.5 17.8 52.78 0.81 3.2
RGB1415 Riegersburg porph lhz 1b 78 8 13 0.1 1.76 1093 966 897 1064 ± 103 28 89.8 51.8 63.48 6.82 3.1
RGB1416 prot lhz 2a 62 19 18 0.9 0.30 941 954 958 1012 ± 24 −71 89.4 9.0 n.d. 0.12 3.7
ol-wbs layer
9 18 70 2.0 1.00 n.a n.a n.a n.a n.a n.a n.a n.a n.a n.a
RGB1454 porph lhz 2b 59 24 11 0.6 4.58 960 960 940 938 ± 6 22 89.7 14.8 50.91 4.71 4.2
RGB1456 sheared lhz 2b 63 22 11 0.9 3.38 1053 985 990 1036 ± 3 17 89.4 19.5 53.70 0.24 3.9
SBF1401 Stein bei Fürstenfeld
porph lhz 1a 74 16 8 2.0 0.07 888 914 1007 915 ± 6 −26 90.5 15.6 51.47 0.51 3.2
TOB1401 Tobaj porph lhz 1a 56 27 15 2.1 0.53 1028 966 943 1103 ± 63 −74 90.2 11.2 48.17 0.43 3.9
TOB1402 porph hzb 1b 79 17 3 0.5 n.d. 1089 1056 1053 1089 ± 46 −1 89.7 26.3 56.69 2.26 2.3
TOB1403 prot lhz 1b 72 8 9 1.1 8.65 1013 1031 949 1114 ± 17 −102 88.8 15.8 51.59 3.45 3.4
TOB1405 phl-bearing
prot hzb
3b 50 19 3 4.5 5.65 + 950 948 993 944 ± 21 6 86.3 15.5 51.44 0.53 4.8
wbs vein n.d. 40 55 5.3 n.d. 941 930 947 1010 ± 60 −69 n.a. n.a. n.a. 0.31 5.9
4
(Fig. 4D and E). Amphiboles appear in two textural positions: I) forming millimeter sized pockets by subhedral amphibole grains (Fig. 4A and E), often with a vermicular spinel in the core, and II) replacing ortho- and clinopyroxenes with thin (1–10μm) lamellae (Fig. 4F) in the core of the pyroxenes and as rims around them. These pyroxenes are recrystallized partially into euhedral orflame-like patchwork structured amphiboles (Fig. 4C). Apatite is an accessory mineral in BF1411 and GN1407 harzburgites (subdivided into Group-3a), only 1–3 grains can be found per thin section. They appear mostly as rounded, 30–150μm subhedral inclusions in amphibole and clinopyroxene partially replaced by amphi- bole (Fig. 4F). The phlogopite-bearing xenoliths, containing no apatite, were subdivided into Group-3b. Harzburgite TOB1405 contains a 0.5–1 cm thick pyroxenite vein (Fig. S2), but the petrographic positions of the phlogopites and amphiboles are the same as in Group-3 xenoliths (Supplementary Text 2).
Lherzolite GS0611 (Fig. S3) is the onlyfine grained equigranular (average grainsize ~850μm) xenolith in the studied suite. Its detailed petrographic description is found inAradi et al. (2017)and in the Supplementary Text 2.
5. Mineral geochemistry
5.1. Major elements
The forsterite content (Fo = Mg/Mg + Fetotalcationic ratios) of the analyzed olivines range between 0.88 and 0.91 (Fig. 5A;
Table S1), except in the Group-3b xenoliths, where Fo is 0.86. The NiO content varies between 0.20 and 0.48 wt% (Fig. 5A). Olivines of the Group-3a GN1407 harzburgite deviate from the variation displayed by the other xenoliths since the highly magnesian oliv- ines (Fo ~ 0.91) have low NiO contents (<0.3 wt%) (Fig. 5A).
MnO contents vary from 0.12 to 0.29 wt%. The CaO concentrations are between 0.03 and 0.10 wt%, except in the fine grained equigranular lherzolite GS0611, in which CaO is below the detec- tion limit (0.02 wt%), whereas in the Group-3b wehrlite BEI1403 it is above 0.12 wt%.
The orthopyroxene Mg# (Mg#OPX= Mg/Mg + Fetotalcationic ra- tios) vary between 88 and 92 (Fig. 5B, Table S2). The Al2O3in the orthopyroxenes is between 1.37 and 5.24 wt% (Fig. 5B), their CaO con- tent is below 0.9 wt% (Table S2). In the Group-3a harzburgites, the orthopyroxenes, which are transformed partially into amphiboles, have the lowest Al2O3(< 2 wt%;Fig. 5B). In the orthopyroxenes of the equigranular GS0611 xenolith the Al2O3content is also remarkably low (2.16 wt%,Fig. 5B).
The Mg# of clinopyroxenes (Mg#CPX= Mg/Mg + Fetotalcat- ionic ratios) ranges between 88 and 92 (Table S3), except in the equigranular GS0611 (Mg#CPX= 94) and in the Group-3b xeno- liths (Mg#CPX< 87). Their Na2O and TiO2contents are between 0.85 and 1.82 and 0.12 and 0.89 wt%, respectively. In the Group-1 and Group-2 xenoliths, the clinopyroxenes have higher Al2O3
content than in Group-3 xenoliths, except TOB1405, in which clinopyroxenes are similar to those in Group-1 and Group-2 (Fig. 5C). The Group-3b wehrlite BEI1403 have clinopyroxene with higher TiO2/Al2O3 ratio compared to all the SB xenolith suite (Fig. 5D). Concentration of Al2O3in clinopyroxenes are al- ways higher than in orthopyroxenes, except in the equigranular lherzolite GS0611. Its clinopyroxenes have the lowest Al2O3, Na2O and TiO2concentrations coupled with exceptionally high CaO con- tent (above 24 wt%, Table S3).
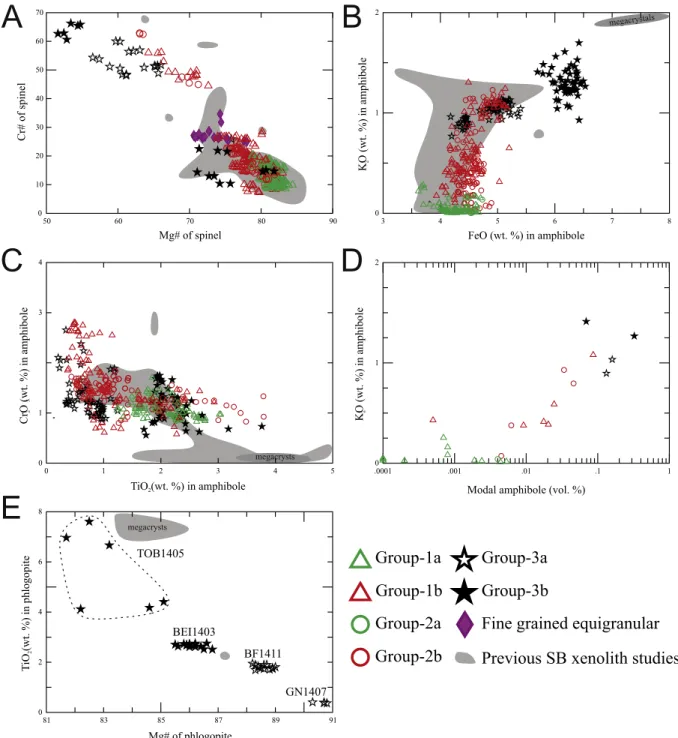
The Cr# (Cr# = Cr3+/Cr3++Al3+cationic ratios, 9–52) and Mg#
(Mg#SP= Mg/Mg + Fe2+cationic ratios, 45–88) number of the spinels show large variability (Fig. 6A, Table S4). In the Group-3 xenoliths, the Fig. 3.Petrography of the Group-1 and Group-2 xenoliths of the Styrian Basin. A: Representative texture of the protogranular Group-1a AUB1410 lherzolite. Transmitted light, 1 N. B: Am- phibole occurring at the contact of pyroxenes and spinels in the protogranular Group-1b lherzolite TOB1403. Stereomicroscope image. C: Porphyroclastic texture of the Group-2b RGB1454 lherzolite. Thin amphibole vein crosscuts the lherzolite xenolith. Scanned image. D: Porphyroclastic texture of the Group-2b GN1402 lherzolite. The black dashed curves denote the contact of the dunite band and the wall rock lherzolite. Abbreviations: ol–olivine; opx–orthopyroxene; cpx–clinopyroxene; sp–spinel; amp–amphibole.
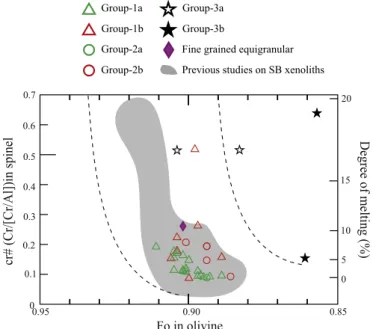
spinels show lower Mg# and higher Cr# compared to those in Group-1 and Group-2 xenoliths, except in Group-3b harzburgite TOB1405 (Fig. 6A). The #Mg and Cr# of spinels in this xenolith resemble the ones of Group-1 and 2. Compared to these two groups, enrichment in TiO2and FeO is observed in spinels from the matrix of the Group-2 sheared lherzolite RGB1456 and in Group-3b wehrlite BEI1403 (Table S4). All the studied xenoliths, except the Group-3a harzburgite BF1411 and Group-3b xenoliths plot within the OSMA-field (Olivine- Spinel Mantle Array,Fig. 7;Arai, 1987).
Amphiboles are mainly pargasites and magnesio-hastingsites in the studied xenoliths (Table S5;Hawthorne et al., 2012) and show a significant variation in major element composition. Amphiboles in Group-1 and Group-2 xenoliths have higher Na2O, FeO, Al2O3 and lower K2O, TiO2 compared to those in Group-3 xenoliths (Fig. 6B and C). The highest K2O contents (≥1 wt%) were measured in the xenoliths where the modal amount of amphibole is also the highest (Fig. 6D;Table 1). In Group-1 and Group-2 amphiboles show enrichment in K2O (up to 1 wt%) without significant change in FeO content. On the other hand, amphiboles in Group-3b xeno- liths show stronger enrichment in K2O, which is also associated with elevated FeO content (Fig. 6B).
Based on the major elements, the micas are phlogopites, their Mg#
range between 81 and 91 and show positive correlation with Al2O3and Cr2O3and negative correlation with TiO2content (Fig. 6E). Phlogopites in Group-3b xenoliths are more enriched in FeO, TiO2and more depleted in Al2O3compared to those in Group-3a xenoliths. Fluorine content of the
phlogopites is up to 0.9 wt%, Cl ranges from 0.01 to 0.18 wt% (Table S6).
The phlogopites have Mg# and concentration of TiO2, K2O and Cr2O3sim- ilar to amphiboles that enclosed them (Table S5 and S6).
Apatites were found in only Group-3a harzburgites BF1411 and GN1407 with SrO content around 1 wt% (Table S7). The apatites are Cl-rich (>1.8 wt%), F is below detection limit. The apatite in harzburgite GN1407 is richer in SO3(>0.5 wt%) than in harzburgite BF1411 (~0.1 wt%). As additional anion, CO32−was detected with Raman spectroscopy. Raman bands of carbonate ions in the apatites were detected at ~1021, ~1042 and ~ 1070 cm−1(Awonusi et al., 2007; Fig. S4).
To conclude, the comparison of our dataset with previously pub- lished major element data on SB xenoliths (Figs. 5 and 6) reveals that most Group-1 and Group-2 xenoliths overlap with previously published data. However, Group-3 and thefine grained equigranular xenolith could represent mantle domains not described before in the SB.
5.2. Mineral major element heterogeneities
Considerable major element inhomogeneity in minerals was ob- served in the Group-2 sheared lherzolite RGB1456 (Fig. S1). The silicates in thefine grained matrix display slightly lower Fo (e.g. Fo =88.5) and Na2O in clinopyroxene (1.22 wt%) than their porphyroclastic counter- parts (Fo = 89.5; Na2OCPX= 2.07 wt%). In the matrix, relict spinels, surrounded by amphiboles, are richer in Cr than the larger ones in
Fig. 4.Petrography of the Group-3 Styrian Basin xenoliths. A: Texture of the GN1407 harzburgite. 1 N, transmitted light. B: Phlogopite and vermicular spinel as inclusions in amphibole from the GN1407 lherzolite. 1 N, transmitted light. C: Backscattered electron image of an amphibole-orthopyroxene-clinopyroxene assemblage in the BF1411 harzburgite. D:
Backscattered electron image of a spinel remnant surrounded by a thin phlogopite, and a thicker amphibole crystal from the TOB1405 lherzolite. E: Backscattered electron image of a phlogopite inclusion and spinel grain in amphibole, from the GN1407 harzburgite. F: Amphibole lamellae and rim on a clinopyroxene from the BF1411 harzburgite. Apatite is included in the clinopyroxene remnant. BSE image. Abbreviations: ol–olivine; opx–orthopyroxene; cpx–clinopyroxene; sp.–spinel; amp–amphibole; phl–phlogopite.
6
the undeformed section of the xenolith (Cr2O3 = 47 and 11 wt%, respectively).
Centimeter-scale major element heterogeneity was also observed in the petrographically complex and heterogeneous Group-3b xenolith TOB1405 (Fig. S2): the rock-forming minerals in the harzburgite wall rock (closer to the amphibole-phlogopite clusters) display lower Mg content (e.g. Fo≈86) than those further away from them (Fo≈90).
The resorbed spinels with phlogopite and amphibole rims also display higher #Cr than the intact ones (~0.4 and ~ 0.15, respectively). Sodium in clinopyroxene is similar in the wall-rock and in the pyroxenite vein (~1.8 wt%), however in the spongy clinopyroxenes near the wall rock- vein (Fig. S2A) contact Na2O is slightly lower (~1.3 wt%).
5.3. Trace elements 5.3.1. Clinopyroxene
Incompatible trace elements in clinopyroxene (Table S8) vary over up to 3 orders of magnitude. Based on trace element characteristicsin Group- 1 and Group-2 xenoliths, two subgroups (a and b) are distinguished.
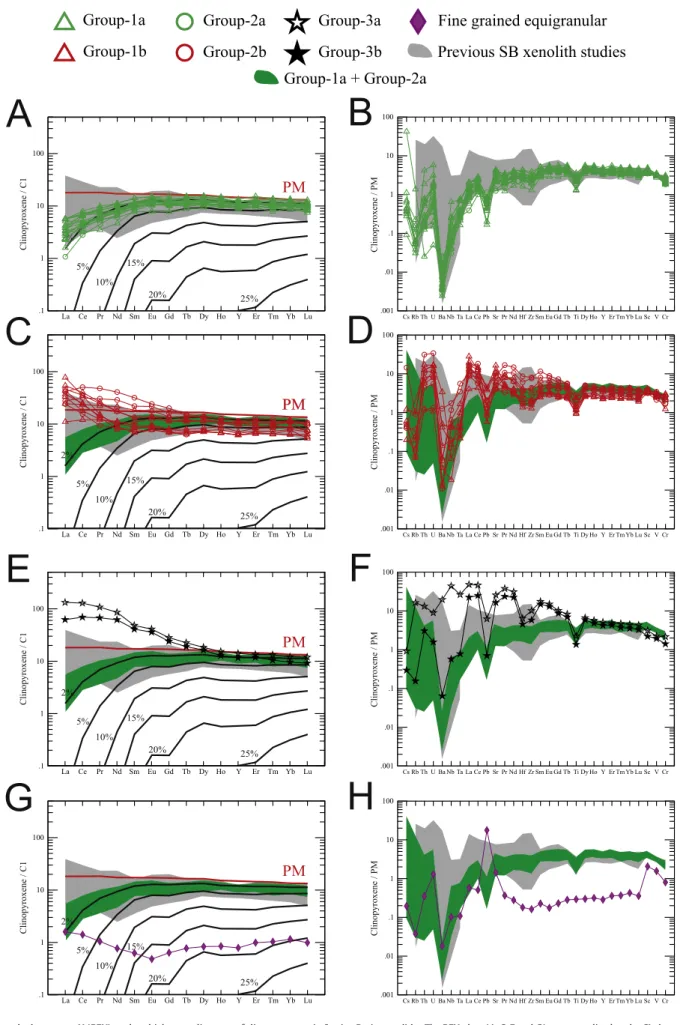
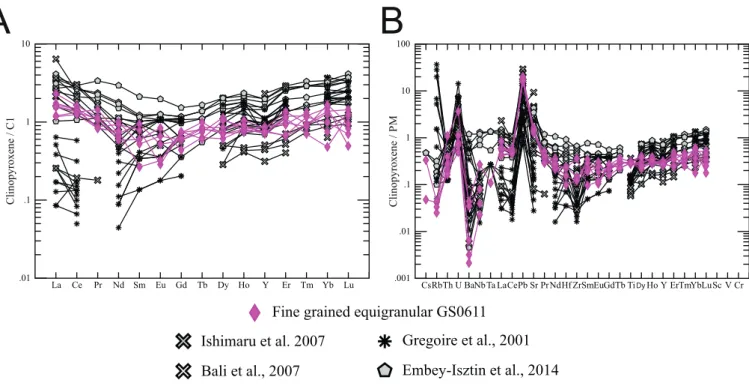
In subgroups 1a and 2a, the clinopyroxenes display a LREE depleted, flat normalized pattern from Sm to Lu (Fig. 8A) with (La/Lu)Nbetween 0.12 and 0.81 and are enriched in HREE compared to both the CI carbo- naceous chondrite (YbN> 3;McDonough and Sun, 1995) and the Prim- itive Mantle (PM,McDonough and Sun, 1995). Clinopyroxenes in these groups are depleted in LILE and HFSE compared to the PM (Fig. 8B). The only exceptions are those from Group-1a lherzolites BEI1404 and KPFS0402, which show 2–4 × PM and 3–5 × PM enrichment in U and Th, respectively.
Clinopyroxenes in Group-1b and Group-2b xenoliths show more variable LREE patterns compared to those in the Group-1a and Group- 2a xenoliths. In these subgroups, the clinopyroxenes have higher (La/Lu)Nthan 1, but lower HREE contents (YbN< 3) compared to the Group-1a and Group-2a xenoliths (Fig. 8C). Clinopyroxenes in some Group-1b and Group-2b xenoliths have aflat REE patterns from Nd to Lu, but show enrichment in La and Ce ((La/Lu)N > 2.5). These clinopyroxenes also have the lowest negative Nb, and smallest negative Sr anomalies of Group-1b and Group-2b xenoliths exhibiting depletion in Zr and Hf, and the highest U and Th concentrations (Fig. 8D). Two Fig. 5.Scatter plots of the major element content of the rock-forming silicates in Styrian Basin xenoliths. A: Forsterite (Fo, Mg2+/(Mg2++Fe2+)) vs. NiO (wt%) in olivine. B: Mg# (Mg/(Mg + Fe2+)) vs. Al2O3(wt%) in orthopyroxene. C: Cation numbers of Al vs. Na in clinopyroxenes. D: Cation numbers of Al vs. Ti in clinopyroxenes. Data of previous studies of Styrian Basin xenoliths are fromRichter (1971),Kurat et al. (1980, 1991),Vaselli et al. (1996),Dobosi et al. (1999)andColtorti et al. (2007).
xenoliths from Group-1b show flat distribution throughout the REY spectrum.
Clinopyroxenes in the Group-3b wehrlite BEI1403 and in the Group- 3a harzburgite BF1411 have highly elevated REY content and show con- cave upward patterns starting from Ce to Dy, with a small dip at La (Fig. 8E). These clinopyroxenes display negative Zr, Hf and Pb anomalies (Fig. 8F). Furthermore, clinopyroxene of the Group-3a harzburgite BF1411 is more enriched in LILE elements and Nb and Ta, and overall in all trace elements compared to clinopyroxenes in wehrlite BEI1403.
In the Group-3b lherzolite TOB1405 (Fig. S2) all the measured clinopyroxenes have a particular REY pattern (Fig. S11 and S12).
Clinopyroxene in the pyroxenite vein (Fig. S11D and E) and in the
harzburgite wall rock (Fig. S11A) show patterns similar to Group-1a and Group-2a xenoliths. The pyroxenes close to the pyroxenite vein (Fig. S11B and C) showflat, LREE depleted patterns, in one grain with a slight positive anomaly in Eu and Gd (Fig. S11B). Another grain neigh- boring spongy orthopyroxene showsflat REY pattern with a maximum at Nd (Fig. S11F).
The equigranular lherzolite GS0611 has a specific, U-shaped chon- drite normalized REY-pattern, with near chondritic REY concentrations and a slight negative anomaly of Eu (Fig. 8G). Normalized to the PM, clinopyroxene in GS0611 xenolith is depleted in all the incompatible el- ements, except U, Sr and Pb. The latter has a significant positive anomaly compared to Ce and Pr (Fig. 8H).
Fig. 6.Scatter plots of the major element content of the rock-forming minerals in Styrian Basin xenoliths. A: Mg# (Mg/(Mg + Fe2+)) vs. Cr# (Cr3+/(Cr3++Al3+)) of spinel. B: FeO (wt%) vs.
K2O (wt%) of amphiboles. C: TiO2(wt%) vs. Cr2O3(wt%) of amphiboles. D: Variation of K2O (wt%) in amphiboles as a function of their modal abundance in the studied Styrian Basin xe- noliths. E: Mg# (Mg/(Mg +ΣFe)) vs. TiO2(wt%) of phlogopites. Data of previous studies of Styrian Basin xenoliths is fromKubovics et al. (1989),Kurat et al. (1980, 1991),Vaselli et al.
(1996),Dobosi et al. (1999)andColtorti et al. (2007).
8
Few xenoliths exhibit chemical heterogeneity in their clinopyroxene trace element patterns. Clinopyroxenes in Group-1b lherzolite NH1408 and Group-2b lherzolite GN1402 show larger variability in trace ele- ment patterns compared to the other SB xenoliths. It is accounted for both intra- and intergrain variability (Fig. S5, S8 and S9), despite the lack of major element zonation. In both xenoliths, the REY patterns vary from LREE depleted patterns (like in Group-1a and Group-2a) to LREE enriched, starting from Sm (Fig. S5A and D). With increasing LREE the concentration of U, Th, Pb and Sr are also increasing (Fig. S5C and F). In Group-1b lherzolite NH1408, the incompatible trace element enrichment consistently increases towards one side of the xenolith from the other, although no change in mineral modes or textures can be ob- served (Fig. S6). In Group-2b lherzolite GN1402 (Fig. S7 and S8) clear connection between the textural position of the clinopyroxenes and their REY patterns was not observed.
In the Group-2b sheared lherzolite RGB1456 (Fig. S9), clinopy- roxenes show patterns similar to Group-1a and Group-2a in the cores, and similar to Group-3 compositions (see below) close to spongy rims and cracks (Fig. S1). Additionally, clinopyroxenes in the sheared zone have LREE (from La to Gd), LIL elements and Nb\\Ta enrichments and slightly lower Hf\\Zr anomaly compared to the Group-3 phlogopite- bearing xenoliths (Fig. 8G and H).
In the Group-2b lherzolite FKG1402 (Fig. S10), two types of REY pat- terns were observed: aflat one, which plots close to Group-1a and Group-2a clinopyroxenes with (La/Lu)N< 1, and an enriched one in REE from La to Ho, consistent with otherflat patterns from Group-2b xe- noliths. The LREE enriched clinopyroxene grains are in contact with am- phibole overgrowths and amphiboles in orthopyroxene-rich band (Fig. S10B), the LREE depleted clinopyroxene appears further from band (Fig. S10A). Besides REE, the clinopyroxenes in contact with am- phiboles are also enriched in Ba, Pb, Sr, Hf and Zr compared to the LREE depleted ones.
5.3.2. Orthopyroxene
The chondrite normalized REY patterns of orthopyroxenes show homogeneous distribution, increasing concentration from La to Lu irrespectively of the group (Fig. S13A and C; Table S9). The
orthopyroxenes show positive U, Ta, Pb, Hf and Ti anomalies, close to the PM composition in Group-1 and Group-2 xenoliths (Fig. S13B and D). In Group-3 xenoliths, the orthopyroxene shows the most enriched patterns in LREE (Fig. S13E) and LILE (Fig. S13F). Ortho- pyroxenes in the equigranular xenolith GS0611 show the most depleted and scattered REY patterns (Fig. S13G). However, similarly to its clinopyroxene (Fig. S13H), a significant positive Pb-anomaly is present in the orthopyroxene of thisfine grained xenolith (Fig. S13H).
5.3.3. Amphibole
The chondrite normalized REY patterns of the studied amphiboles are similar to their corresponding clinopyroxenes (Figs. 8 and 9;
Table S10). Amphiboles in Group-1a and Group-2a xenoliths have LREE depleted patterns from La to Eu, with (La/Lu)N< 1 (Fig. 9A). The multielement diagram shows a positive Sr and Ti anomaly, and widely scattered LILE and HFSE contents (Fig. 9B). Amphiboles in Group-1a lherzolite SBF1401 have the highest Pb concentrations and show ele- vated U, Th and Ba abundances, besides the Group-1a lherzolite BEI1404.
In Group-1b and Group-2b xenoliths amphiboles also mimic the trace element patterns of clinopyroxenes: they are enriched in REE ((La/Lu)N< 1) from La to Gd (Fig. 9C). Amphiboles in this groups display lower Ti/Nb and Zr/Nb ratios compared to those in the xenoliths of Group-1a and -2a. Positive Nb and Ta anomaly can be observed in the amphiboles of all the Group-2b xenoliths (Fig. 9D), in amphibole-rich Group-1b xenoliths BEI1401 and TOB1403, and in xenoliths of Group- 3b (Table S10).
Amphiboles in Group-3 xenoliths have the most enriched REY pat- terns of all the studied xenoliths (Fig. 9E). Group-3a amphiboles show enrichment from La to Ho, whereas in Group-3b xenoliths the patterns are convex upward from La to Ho. A negative Ti anomaly (1 > TiN/Ti*, where Ti* = (GdN*DyN)1/2) can be observed in Group-3a xenolith, whereas amphiboles in Group-3b have positive Ti anomalies (1 < TiN/ Ti*;Fig. 9E). Amphibole of Group-3a harzburgite GN1407 shows much lower Ti, Nb, Ta, Zr, Hf, but slightly higher U, Th and Cr contents than the other xenoliths from Group-3. The Fe-rich amphiboles of the Group-3b xenoliths show the lowest negative U, Th and Pb anomalies.
The Nb and Ta content of amphiboles of Group-3 show a positive corre- lation with Ti-anomaly (Ti*/TiN). The Nb/Ta ratio in Group-3a harzburgite GN1407 is much higher (~121) than those in the other Group-3 xenoliths.
5.3.4. Mica
Phlogopites of Group-3 xenoliths (Table S11) show both intra- and intergrain variability, scattered REY patterns due to low concentrations (<CI chondrite) (Fig. S14A). In all Group-3 xenoliths, except in GN1407 harzburgite, the phlogopites exhibit high positive Ba and Ti anomaly (Fig. S14B). Phlogopites in Group-3b xenoliths are more enriched in Ti than in Group-3a xenoliths. Phlogopites have high amount of Cs and Rb (> 300 × PM), Nb and Ta (>30 × PM) and a positive Sr and Pb anom- aly, except in harzburgite GN1407 (Fig. S14B). Nb/Ta is between 15 and 30, except in harzburgite GN1407 where this value is higher (177 in av- erage). Apart from REY and Th, in GN1407 harzburgite phlogopite has the lowest trace element content overall.
6. Equilibrium temperatures and depth of origin
Previously published (Aradi et al., 2017) equilibrium temperatures of the studied SB xenoliths were calculated with three major element thermometers: two-pyroxene thermometer byBrey and Köhler, 1990, TBKCa-in orthopyroxene thermometer byBrey and Köhler (1990; mod- ified byNimis & Grütter, 2010, TNG) and Cr-Al in orthopyroxene ther- mometer byWitt-Eickschen and Seck, 1991, TWES(Table 1). All major element based thermometers provide consistent and robust results in a good agreement (860 and 1093 °C ± 16 °C for TBK; TNG: 894–1056
± 25 °C; TWES: 897–1053 ± 15 °C, respectively;Aradi et al., 2017), Fig. 7.OSMA (Olivine-Spinel Mantle Array;Arai, 1987) diagram of Cr# (Cr3+/(Cr3+
+Al3+)) of spinel vs. forsterite content (Fo; Mg/(Mg + Fe2+)) of olivine in Styrian Basin xenoliths. Data from previous studies (Coltorti et al., 2007;Dobosi et al., 1999;
Kurat et al., 1980, 1991;Vaselli et al., 1996) cover the greyfield. Degree of melting was calculated by the equation ofHellebrand et al. (2001.)
Fig. 8.Rare earth elements + Y (REY), and multielement diagrams of clinopyroxenes in Styrian Basin xenoliths. The REY plots (A, C, E and G) are normalized to the CI, the multielement plots (B, D, F and H) are normalized to the primitive mantle (PM) ofMcDonough and Sun (1995). REY data are compared to melting curves calculated for anhydrous non-modal fractional melting of clinopyroxene of the primitive mantle (PM,McDonough and Sun, 1995) in the spinel lherzolite facies (Niu, 1997at 1.5 GPa). References of previous Styrian Basin xenolith stud- ies are fromDobosi et al. (1999)andColtorti et al. (2007).
except for xenoliths in Group-3 and thefine grained lherzolite GS0611.
For these xenoliths, the TWESshows significantly lower equilibrium temperatures (< 825 °C) than TBKand TNG.
Additionally, we used the two-pyroxene, REE thermometer ofLiang et al. (2013), which gave slightly higher T range between 915 and 1186
°C. In most of the calculations of TREE, we excluded LREE due to the low concentration and the high uncertainty in orthopyroxene (Fig. S13, Table S9).
The thermal history of the SCLM can be inferred based on the varia- tion in temperatures between the REE and major element based two- pyroxene thermometers (Wang et al., 2015;Yao and Liang, 2015) since the closure temperature of REEs is higher than that of Ca, Mg or Fe in pyroxenes (Liang et al., 2013;Wang et al., 2015). When TREEis higher than TBK, a recent cooling event is expected in the SCLM; in con- trast if TBKis higher than TREEa heating event could be assumed (Wang et al., 2015). If the difference between temperatures calculated with the Fig. 9.Rare earth elements + Y (REY), and multielement diagrams of amphiboles in Styrian Basin xenoliths. The REY plots (A, C and E) are normalized to the CI, the multi-element plots (B, D and F) are normalized to the primitive mantle (PM) ofMcDonough and Sun (1995). References of previous SB xenolith studies are fromColtorti et al. (2007).
method ofBrey and Köhler (1990)(TBK) andLiang et al. (2013)(TREE) is less than 50 °C, the peridotite is considered well-equilibrated due to its long residence in the lithospheric mantle (Wang et al., 2015).
Half of the xenolith suite shows temperature differences lesser than 50 °C (Fig. S15C); therefore, we can assume that after the last metaso- matic event these mantle domains were well equilibrated. However, the other half of the xenolith suite represents mantle domains that show slight temperature variations. Some of the Group-1 and a few of Group-2 xenoliths record slight cooling after the last event, and three xenoliths a slight heating. TREE was ignored in the fine grained equigranular lherzolite GS0611 due to the extremely low REE concen- trations in both pyroxenes.
The equilibration pressure of xenoliths was estimated combining the TBKand the local geotherm of the Styrian Basin (Fig. 10) beacuse there are no reliable, major-element geobarometers for spinel-facies perido- tites. Based on petrographic observations, the calculated equilibrium temperatures, and the local geotherm, the studied xenoliths were equil- ibrated in the spinel facies and derived from a ~ 30 km thick domain; ap- proximately from a 30 to 60 km depth range (Fig. 10;Aradi et al., 2017).
The depth of the Lithosphere-Asthenosphere Boundary (LAB) is 60–80 km beneath the Styrian Basin (Bianchi et al., 2014). Thus, the studied xe- noliths derive from the subcontinental lithospheric mantle. Thefine grained equigranular GS0611 xenolith, which records the lowest TBK
(770 °C), represents probably the uppermost part of the SCLM (~ 27 km, Horváth et al., 2006) close to the MOHO (Aradi et al., 2017).
Compared to previous studies (e.g.Kurat et al., 1991;Vaselli et al., 1996), which mainly focused on the xenoliths of Kapfenstein and Tobaj, xenoliths in our study represent samples from the SCLM from c.
100 °C lower temperature range (Fig. 10), indicating that xenoliths found in previously studied localities may not represent the whole lith- ospheric column beneath the Styrian Basin.
7. Discussion
7.1. Partial melting in the Styrian Basin SCLM
In order to quantify the degree of the partial melting within the SB upper mantle, we used the REY contents of clinopyroxenes and the Cr# of spinels. For the REY based modeling, we used the anhydrous non-modal fractional model ofNiu (1997)using the clinopyroxene composition of the primitive mantle ofMcDonough and Sun (1995).
For the use Cr# of spinels as a melting indicator (Table 1), we followed the model ofHellebrand et al. (2001). Clinopyroxene compositions of most Group-1a and Group-2a xenoliths are close to primitive mantle clinopyroxenes and the maximum degree of partial melting is c. 5%
(Fig. 8A). The HREE content of clinopyroxene in Group-1b and Group- 2b peridotites can be account by less than 10% fractional melting (Fig. 8C), whereas that of Group-3 xenoliths only records 5% melting (Fig. 8E). In contrast, the low temperature,fine grained equigranular GS0611 lherzolite underwent as much as 20% of melting from a Fig. 10.A: Equilibrium temperatures (TBK) projected onto the recent local geotherm of the Styrian Basin. Spinel (Sp)–Garnet (Gt) phase transformation (dotted-dashed line) is from O'Reilly and Griffin (1996). Crust-mantle boundary (MOHO) depth is based onHorváth et al. (2006). B: Histogram of TBKequilibrium temperatures (Brey and Köhler, 1990) of the studied Styrian Basin xenoliths. The data is compared to the TBKequilibrium temperatures of previously studied Styrian Basin xenoliths based onKurat et al. (1980, 1991),Vaselli et al. (1996), Dobosi et al. (1999),Falus et al. (2000)andColtorti et al. (2007).
12
primitive mantle source (Fig. 8G). The results of Group-1 and Group-2 xenoliths are broadly in agreement with the estimated melt depletion based on the Cr# of spinel using theHellebrand et al. (2001)melting model (Fig. 7). However, this model predicts higher depletion degrees than the model ofNiu (1997), except for GS0611 lherzolite (8% partial melting). Discrepancy between the two models (and the parameters they are based on) are also found in Group-3 xenoliths and in the RGB1415 lherzolite from Group-1b. As discussed below, it is probably related to the extensive crystallization of amphibole at the expense of spinels (e.g.Fig. 2D) resulting in the modification of the composition of spinels. Regardless of the applied model, Group-1b and Group-2b xe- noliths underwent minor amount of melt extraction in the spinel facies, whereas in terms of major elements, Group-1a, Group-2a and Group-3 xenoliths represent a fertile mantle domain with a composition similar to primitive mantle. The majority of the previously studied SB xenoliths (Coltorti et al., 2007;Dietrich and Poultidis, 1985;Dobosi et al., 1999;
Falus et al., 2000;Kurat et al., 1980, 1991;Richter, 1971;Vaselli et al., 1996) shows similarities to those of fertile Group-1a and Group-2a xe- noliths, recording less than ~7% of partial melting.
Our dataset is large enough (35 xenoliths from 13 localities) to make a region-wide comparison of the fertility and depletion of the SCLM across the CPR. Group-1a and Group-2a xenoliths could be considered as fragments of one of the least depleted SCLM in the CPR. Group-1b, Group-2b and Group-3 xenoliths, however, sampled a more complex, geochemically heterogeneous SCLM, which underwent subsequent metasomatism after the partial melting. In the central part of the CPR (Fig. 1A), with the thinnest lithosphere in the region (~70 km;
Horváth et al., 2006), xenolith data suggest a moderately depleted SCLM. Protogranular, geochemically more fertile xenoliths, with an as- thenospheric origin (Kovács et al., 2012), have experienced 0–5% melt removal from a primitive mantle source (based onNiu, 1997). In con- trast, the common poikilitic and recrystallized xenoliths with mosaic equigranular textures show strong depletion, up to 20% (Bali et al., 2007;Berkesi et al., 2012;Embey-Isztin et al., 2014). In the northern margin of the CPR (Nógrád-Gömör,Liptai et al., 2017), the SCLM is more deformed and underwent significantly higher amount of partial melting (i.e. 7–10% in the most fertile peridotites, up to 25% in the most depleted ones) compared to the Styrian Basin. Xenoliths from the Perşani Mountains (Eastern CPR, Transylvania) show fertile compo- sitions similar to the Styrian Basin xenoliths based on both the Cr# of spinel (Falus et al., 2000, 2008;Vaselli et al., 1995) yielding less than 7% melt removal, and the REE content of clinopyroxenes (Chalot-Prat and Boullier, 1997) suggests less than 5% of melt removal.
7.2. Mantle metasomatism in the Styrian Basin SCLM 7.2.1. Pre-Cenozoic metasomatic events
The Group-2 xenoliths display modal heterogeneity, in the form of pyroxene- or olivine-rich veins and modal layering (Fig. 2C and D). In all Group-2 xenoliths, except the sheared RGB1456 lherzolite (Fig. S1), the major element composition of rock forming minerals is homoge- neous suggesting that the pyroxene- or olivine-rich veins and layers (Fig. 2C and D) are in chemical equilibrium with the wall rock, although most of them (Group-2b) were also affected by later metasomatic events.
Pyroxene-rich websteritic veins and bands are common in mantle rocks (e.g.Garrido and Bodinier, 1999). Refertilization of the upper mantle by asthenospheric melts could be the main cause of the genera- tion of secondary clinopyroxene in lherzolites (e.g.Lenoir et al., 2001;Le Roux et al., 2007; Varas-Reus et al., 2016 and reference therein).
Websterite can mark melt segregation horizons along lherzolite- harzburgite contacts (e.g.Le Roux et al., 2007;Soustelle et al., 2009) in peridotite massifs, or can be formed during thermal erosion of the SCLM, intermingled with olivine-rich domains (Bodinier et al., 2008;
Gervilla and Remaidi, 1993). These melt reactions, coeval with melting, could produce homogeneous major and trace element compositions (e.g.Lenoir et al., 2001). In this scenario the olivine-rich and websterite
bands might be the result of relatively young melting event(s) in the mantle. However, their formation in the SB should predate the metaso- matic event that precipitated hydrous minerals (see in 7.3.4).
Another explanation for the homogeneous major and trace element distribution of Group-2 xenoliths could be that, after the initial hetero- geneous distribution of major and trace elements, the whole mantle as- semblage is re-equilibrated, including the observed signs of stealth (O'Reilly and Griffin, 2013) cryptic metasomatism in the SCLM (Dawson, 1984). The equilibration of such geochemical heterogeneities (e.g. in the REE distribution) in the pyroxenes takes at least ~1 Ga under lithospheric conditions (1150 °C and 1.5 GPa;Van Orman et al., 2001).
Thus, these features in the Styrian Basin SCLM may be considered as re- sults of ancient (>1 Ga) metasomatic events. Additionally, the Neogene fluid-enhanced recrystallization in the lithospheric mantle beneath the SB (Aradi et al., 2017) could also enhance annealing.
7.2.2. Recent geochemical evolution of the Styrian Basin SCLM
The various enriched trace element patterns (Fig. 8) of clinopyr- oxenes in the SB xenoliths indicate that after partial melting and subse- quent ancient refertilization event(s) (discussed in 7.3.1), the xenoliths of Group-1a,−2a,−1b and -2b and−3 were enriched by different metasomatic agents. Comparing the Group-1b and -2b and Group-3 xe- noliths to Group-1a and -2a xenoliths, the former groups have elevated modes of amphiboles (Table 1,Fig. 6D). In Group-1b and Group-2b xe- noliths, clinopyroxenes are depleted in basaltic major elements and HREE, but enriched in LREE, Sm, Th, U,Sr, Hf and Zr following the partial melting event (Fig. 8D). Group-1b and Group-2b xenoliths generally have compositionally homogeneous pyroxenes with the exception of five lherzolite xenoliths from Group-1b -2b and -3b (GN1402, NH1408, RGB1456, FKG1402 and TOB1405; Fig. S5–S12). This chemical homogeneity suggests signs of slow metasomatic front propagation (e.g.Bodinier et al., 1990;Le Roux et al., 2007).
There is clear evidence of chromatographic fractionation in three lherzolites NH1408, GN1402 and RGB1456, showing trace-element in- homogeneity in clinopyroxenes on grain scale. In NH1408 and GN1402 xenoliths, besides LREE (from La to Nd, Fig. S5), U, Th, Pb and Sr also show milli- to centimeter-scale heterogeneity in clinopyroxene (Figs. S6 and S9). All these trace elements positively correlate with each other implying contemporaneous enrichment (Fig. S5C). Such trace element fractionation in lithospheric mantle can be driven by infil- tration offluid or melt (O'Reilly and Griffin, 2013and references therein).
The increasing (La/Yb)Nratio can be a product of an evolved silicate melt, which percolated through this chromatographic column (e.g.Bedini et al., 1997). We assume that the slight and irregular enrichment in U and Th in some of the clinopyroxenes in the Group-1a and Group-2a xe- noliths can also be explained by chromatographic process beside the pre- cipitation of amphiboles from a hydrous melt (discussed below).
7.2.3. Formation of thefine grained lherzolite
Thefine grained equigranular lherzolite GS0611 is characterized by specific petrographic, crystallographic (Aradi et al., 2017) and geochem- ical features among the Styrian Basin xenoliths. Based on the extremely low equilibrium temperature (TBK= 770 °C), it should represent the up- permost part of the SCLM near the MOHO (Aradi et al., 2017). Texturally similar xenoliths were observed previously in the central part of the CPR (e.g.Bali et al., 2002;Embey-Isztin et al., 2014).Embey-Isztin et al. (2014) classified these rocks as poikilitic xenoliths and the lherzolite GS0611 shows petrographic and geochemical features similar to those xenoliths.
Major element composition of clinopyroxenes in lherzolite GS0611 (CaO
> 20 wt%; Al2O3< 5 wt%) and spinels (Cr# > 30), U-shaped LREE pat- terns (Fig. 8G) and significant positive Pb anomaly (Fig. 8H) in the clinopyroxenes are all the characteristic features of the poikilitic xeno- liths ofEmbey-Isztin et al. (2014). However, the equilibrium temperature is much lower compared to those ofEmbey-Isztin et al. (2014)from the central CPR (ΔTBK~ 200–250 °C;ΔTWES~ 50 °C). These poikilitic xenoliths contain elevated Pb contents relative to the dominant lherzolitic xenolith