1 2
Temperature-dependent nanomechanics and topography of bacteriophage
3
T7
4 5
Runing title: Temperature-dependent structure and mechanics of T7 6
7 8 9
Zsuzsanna Vörös, Gabriella Csík, Levente Herényi and Miklós Kellermayer 10
11 12
Department of Biophysics and Radiation Biology, Semmelweis University, Budapest H1094 13
Hungary 14
15 16 17 18 19 20 21 22
Corresponding author:
23
kellermayer.miklos@med.semmelweis-univ.hu 24
25
JVI Accepted Manuscript Posted Online 8 August 2018 J. Virol. doi:10.1128/JVI.01236-18
Copyright © 2018 American Society for Microbiology. All Rights Reserved.
on September 14, 2018 by guest http://jvi.asm.org/ Downloaded from
Abstract 26
Viruses are nanoscale infectious agents, which may be inactivated by heat treatment. The 27
global molecular mechanisms of virus inactivation and the thermally-induced structural 28
changes in viruses are not fully understood. Here we measured the heat-induced changes in 29
the properties of T7 bacteriophage particles exposed to two-stage (65 ˚C and 80 ˚C) thermal 30
effect, by using AFM-based nanomechanical and topographical measurements. We found that 31
exposure to 65 ˚C led to the release of genomic DNA and to the loss of the capsid tail, hence 32
the T7 particles became destabilized. Further heating to 80 ˚C surprisingly led to an increase 33
in mechanical stability, due likely to partial denaturation of the capsomeric proteins kept 34
within the global capsid arrangement.
35 36 37
Importance 38
Even though the loss of DNA, caused by heat treatment, destabilizes the T7 phage, its capsid 39
is remarkably able to withstand high temperatures with a more-or-less intact global 40
topographical structure. Thus, partial denaturation within the global structural constraints of 41
the viral capsid may have a stabilizing effect. Understanding the structural design of viruses 42
may help in constructing artificial nanocapsules for the packaging and delivery of materials 43
under harsh environmental conditions.
44 45 46
Keywords 47
atomic force microscopy, nanoindentation, thermally-induced structural change, CD 48
spectroscopy 49
50
on September 14, 2018 by guest http://jvi.asm.org/ Downloaded from
Introduction 51
52
Viruses are remarkable nanoscale machineries that harbor a piece of genetic material within a 53
proteinaceous capsule. As obligatory parasites, they are capable of efficiently fooling the host 54
organism into manufacturing the viral structural elements, which spontaneously reproduce 55
the virus particle by self-assembly. Because of their biological, medical and even economic 56
importance, the properties of viruses have been investigated by a wide array of experimental 57
approaches. It has long been known that most viruses can be thermally inactivated(1-4). It is 58
hypothesized that thermal virus inactivation is caused by the release of the genetic material or 59
some kind of capsid disruption (5-8), but the exact nature of the thermally-driven structural 60
transitions within the viruses are little known. Differential scanning calorimetry and cryo- 61
electron microscopy experiments have revealed a reversible structural transition at 53 ˚C 62
limited to the hexamers of the HK97 bacteriophage (9). Heating the HK97 phage further 63
results in the release of genomic DNA by not precisely known mechanisms, and heating even 64
further to 80 ˚C results in an irreversible transition of thermal melting (10). In the case of 65
bacteriophage λ, heat-induced transitions at 68 ˚C and 87 ˚C have been assigned to the escape 66
of DNA and irreversible melting, respectively(11). The simultaneous observation of capsid- 67
and DNA-related events, however, have not so far been possible at the level of the individual 68
virus particles.
69
Previously, a distinct thermal melting of the bacteriophage T7 has been documented(12-15).
70
T7 is a non-enveloped, short-tailed icosahedral E.coli phage that contains a 40 kbp genomic 71
DNA (16). Thermal melting, measured by following OD260 as a function of temperature, 72
involves two major transitions related to DNA. The first transition occurs between 50-60 ˚C, 73
and it is thought to correspond to the release of DNA from the capsid. This transition is 74
accompanied by a marked loss of infectivity (17). A second transition is detected in the 75
on September 14, 2018 by guest http://jvi.asm.org/ Downloaded from
sample at temperatures above 80 ˚C, and it is related to DNA denaturation. Temperature- 76
dependent CD spectroscopic measurements indicated that both of these transitions are likely 77
to be accompanied by structural changes in the capsid proteins as well (12). Although high- 78
resolution structural information is available on the protein capsid of T7(18, 19), the details 79
of the thermally-induced transitions within the protein components of the capsid remain 80
unclear.
81
In recent years, atomic force microscopy (AFM)-based nanomechanical experiments emerged 82
as a sensitive tool to explore the properties of viruses (20-29). It has been shown that 83
nanomechanical parameters, such as stiffness and capsid breaking force, may reveal 84
molecular mechanisms underlying capsid maturation, and the packaging, storage and release 85
of genetic material.
86
Here we employed AFM to explore the nanomechanical and topographical changes in T7 87
bacteriophages exposed to two-stage thermal treatment (65 ˚C, 80 ˚C). We show that distinct 88
changes in the nanomechanical properties of T7 occur upon heat treatment. Topographical 89
analysis revealed the structural alterations that underlie the nanomechanical changes: 65 ˚C 90
treatment leads to the release of genomic DNA and the loss of the tail complex, and further 91
heating to 80 ˚C leads, on one hand, to the appearance of large globular particles that likely 92
correspond to disassembled capsids and, on the other hand, to a partial structural stabilization 93
of the remaining capsids, due most likely to rearrangements via partial denaturation of the 94
capsomeric gp10A proteins.
95 96
on September 14, 2018 by guest http://jvi.asm.org/ Downloaded from
Results and Discussion 97
Nanomechanics of heat-treated T7 phages 98
In the present work, individual, surface-adsorbed T7 phage particles exposed to different 99
temperatures (room temperature, 65 ˚C, 80 ˚C) were manipulated with AFM to reveal their 100
nanomechanical properties and the thermally-induced changes in these properties. Fig. 1 101
shows our results obtained on phages at room temperature (RT). After landing the AFM tip 102
on the capsid surface, force increased linearly to about 8 nN, where a sharp transition marked 103
by a sudden drop of force and corresponding to capsid breakage occurred. Upon pressing the 104
AFM tip further, force fluctuated below 2 nN, then it began to rise sharply upon approaching 105
the substrate surface. The retraction force trace was essentially featureless; therefore, a large 106
force hysteresis was present, indicating that the mechanical manipulation resulted in an 107
irreversible conformational change (breakage) of the capsid. Although in the majority of the 108
capsids similar force traces were recorded (Fig. 1.c), in a fraction of them we obtained traces 109
with a significantly different, but reproducible, appearance (Fig. 1.d). In these traces the 110
initial linear regime ended at about 2 nN (we refer to these as putative empty capsids, see 111
below).
112
In T7 capsids treated at 65 ˚C (Fig. 2.a-b), the force traces were similar to those seen in Fig.
113
1.d: capsid breakage occurred at about 2 nN, then force fluctuated around 2 nN before 114
increasing abruptly upon approaching the substrate surface. In T7 capsids heated further to 80 115
˚C (Fig. 2.c-d), the overall appearance of the force traces was similar to that seen for the 65 116
˚C samples, but capsid breakage and the following force fluctuation occurred at greater force 117
levels.
118
Fig 3 displays the distribution of the parameters extracted from the force traces (see also 119
Table 1). The breaking force values in the RT samples (Fig. 3.a) partition into two modes, 120
according to the distinct types of force curves (see Figs. 1.c-d). The low-force mode of the 121
on September 14, 2018 by guest http://jvi.asm.org/ Downloaded from
RT sample aligns well with the histogram peak of the 65 ˚C data (Fig. 3.b). Considering that 122
T7 phages heated to temperatures above 60 ˚C are thought to loose their DNA (12), we 123
tentatively conclude that the low-force peak in the RT data may correspond to empty capsids.
124
The presence of empty capsids in the RT sample indicates that the spontaneous or artificially- 125
induced DNA ejection of T7 phages is not negligible (30). The breaking force is severely 126
reduced in 65 ˚C-treated capsids (from 6.90 nN to 1.61 nN, see Table 1). Since, according to 127
AFM imaging results (see Fig. 5), the 65 ˚C treatment indeed resulted in the release of DNA 128
from the capsids, our findings indicate that the presence of packaged DNA within the phage 129
contributes to its mechanical stability. Quite interestingly, the breaking force was increased in 130
the 80 ˚C-treated T7 phages relative to the ones treated at 65 ˚C (Fig. 3.c). Conceivably, 131
structural rearrangements occurred in the capsomeric proteins between 65-80 ˚C, which 132
resulted in a stabilization of their interactions, hence to an increased mechanical stability of 133
the phage particle.
134
Stiffness was largest in the intact T7 phage, and the reduced stiffness values were similar in 135
the RT empty capsids and the heat-treated ones (Figs. 3.d-f). Thus, the presence of packaged 136
DNA contributes to the stiffness of the T7 phage.
137
The maximal indentation values progressively increased as a result of heat treatment (Figs.
138
3.g-i), which is a combined effect of the underlying changes in breaking forces and stiffness.
139
Thus, even though the stiffness of 80 ˚C-treated T7 capsids is reduced, because of the 140
increased breaking forces, they withstand greater indentations prior to breakage.
141
The mean capsid height became slightly reduced upon 65 ˚C treatment (Fig. 3.j-k). Notably, 142
the mean capsid height of the empty-capsid RT phages is essentially identical to the 65 ˚C- 143
treated ones, indicating that the presence of packaged DNA within the phage increases its 144
diameter (by about 10 nm). Conceivably, the DNA pressure inside the phage causes the 145
expansion of the icosahedral phage structure. We note that the 10 nm difference in mean 146
on September 14, 2018 by guest http://jvi.asm.org/ Downloaded from
capsid height between the RT and 65 ˚C-treated capsids is only partly due to the DNA 147
pressure; since capsid height was obtained from mechanical measurements with a pyramidal 148
AFM tip, the presence of upward-oriented phage tails likely shifted the average height to 149
greater values in the RT samples. The capsid height is slightly increased in the 80 ˚C-treated 150
sample relative to 65 ˚C, which, as judged from the histogram shape (Fig. 3.l), is probably 151
due to the emergence of a subpopulation of capsids with larger diameter.
152 153
AFM structure of heat-treated T7 phages 154
To reveal the structural detail and mechanisms behind the heat-induced nanomechanical 155
changes in T7 capsids, we carried out high-resolution AFM measurements on phage particles 156
exposed to 65 ˚C and 80 ˚C (Fig. 4.a). In an overview AFM image of a typical RT sample 157
(Fig. 4.b), the characteristic T7 phage particles could be visualized against a nearly 158
featureless substrate background. Occasionally, a DNA molecule released from the capsid 159
upon mechanical perturbation could be observed. The mechanically-induced DNA ejection is 160
characterized by the sudden, within-one-scanline appearance of the DNA chain(30). We note 161
that there were a few globular particles in the background, which may correspond to the core 162
T7 phage proteins that become ejected simultaneously with DNA (30). Importantly, the 163
conical tail complex could be observed on most of the phage particles. Depending on the 164
surface binding of the phages, the tail complex was oriented in different directions (Fig. 4.c).
165
In high-resolution AFM images, even the size, the cogwheel shape and the central pore of the 166
capsomeres could be resolved (Fig. 4.d-e).
167
Upon 65 ˚C treatment, the topography of the background, and to some extent the capsids, 168
became different (Fig. 5). The most striking feature is that the substrate became covered with 169
a meshwork of DNA chains. A height profile of a section of the background (Fig. 5.a inset) 170
shows that the cross-sectional height of the individual strands is about 2 nm, which 171
on September 14, 2018 by guest http://jvi.asm.org/ Downloaded from
demonstrates that they are indeed DNA. Thus, the 65 ˚C treatment, as suggested earlier(12), 172
indeed resulted in the release of DNA from the T7 capsids. The second notable feature in the 173
AFM images is that in most of the capsids the conical tail complex is not visible. Even if a 174
tail can be seen, its structure is usually stubby, quite different from a cone (Fig. 5.c). Thus, 175
DNA has been released from the phage particles, because of a separation of the tail complex 176
from the capsid. Because the gp8 protein plays an important role in the connecting the tail 177
complex to the capsid, we hypothesize that it might be a thermally sensitive component of 178
T7. As a result, large (>10 nm) globular particles can be identified in the background, which 179
may correspond to the remnants of the broken-off tail complexes. Although DNA release and 180
the loss of tail were clearly observed in the samples treated at 65 ˚C, we do not exclude the 181
possibility that these structural transitions may begin to occur at lower temperatures already 182
(31, 32). We note that we were unable to detect the presence of L-shaped tail fibers on the 183
substrate surface. Possibly, the poly-L-lysine-coated surface and the large amount of DNA 184
precluded the binding of the tail fibers in proper orientation. The third striking feature is that 185
the capsid surface became more faceted, and the icosahedron edges and faces emerged more 186
distinctively (Fig. 5.b). Such a faceted appearance can be well explained by the shrinkage of 187
the capsids upon DNA release (Figs. 3.j-k). In high-resolution AFM images, the cogwheel 188
shape of the individual capsomeres could be well identified (Figs. 5.d, f). In a few capsids, 189
we noticed gaps in the position of the pentameres, which are most likely the exit holes 190
through which DNA escaped (Fig. 5.e).
191
In T7 samples exposed to 80 ˚C, the background was also densely populated with DNA 192
strands (Fig. 6.a). A notable feature is the large number of globular particles scattered in the 193
background. Even large aggregates of the particles could be observed (Fig. 6.b). Considering 194
that the size of the aggregates far exceeds that of the tail complex, we hypothesize that the 195
aggregates, hence their component globular particles, originate from the capsid wall. In high- 196
on September 14, 2018 by guest http://jvi.asm.org/ Downloaded from
resolution AFM images (Fig. 6.c-d), the capsomeres appeared swollen, and they displayed 197
less distinct cogwheel structure according to visual inspection. Altogether, the major 198
transitions of T7 upon heating to 65 ˚C are the release of DNA rearrangements in the capsid.
199
The transitions upon further heating to 80 ˚C entail structural changes within the capsid wall.
200 201
Analysis of topographical data 202
Representative height profiles across individual capsids (Fig. 7.a) demonstrate the heat- 203
induced topographical changes in T7. Upon 65 ˚C treatment, the capsid slightly shrunk, its 204
faces became flattened and its edges more distinct. The 80 ˚C-treated capsid shown here 205
became swollen and its surface rugged. The ratio of capsids with visible tail complexes 206
progressively reduced with heat treatment (Fig. 7.b). The capsomere diameter considerably 207
increased after 80 ˚C treatment (Fig. 7.c). We hypothesize that thermally-induced 208
conformational changes, most likely partial denaturation, has occurred in the gp10A 209
capsomeric proteins, which resulted in an increase of their apparent volume. It might well be 210
possible that the partial denaturation exposed the hydrophobic core of the capsomere 211
proteins, and a hydrophobic interaction occurred in between neighboring capsomeres. Such 212
an interaction may explain the increase in breaking force between 65 ˚C and 80 ˚C observed 213
in the nanomechanical experiments (Figs. 3.b-c). The peak capsid height decreased slightly 214
upon 65 ˚C treatment (Figs. 7.d-e), but the 80 ˚C treatment resulted in the emergence of a 215
sub-population with larger height values (Fig. 7.f). We hypothesize that this sub-population 216
corresponds to capsids with swollen wall structure. The peak capsid height analysis shown 217
here more-or-less reflects the tendencies observed in the nanomechanical experiments.
218
However, because AFM images allow us to select the tallest topographical point on the 219
capsids, the peak height analysis is more sensitive to local variations, which are hidden or 220
averaged out in the nanomechanics experiment.
221
on September 14, 2018 by guest http://jvi.asm.org/ Downloaded from
The number of globular particles progressively increased in the samples upon heat treatment 222
(Fig. 8.a). The height of the major population of the particles is centered around 6 nm 223
regardless of heat treatment (Figs. 8.b-d). In the 80 ˚C-treated samples, particle populations 224
with much larger heights emerged (Fig. 8.c). While the ~6 nm particles may correspond to 225
the ejected core proteins, the large globular particles are most likely capsomeric proteins and 226
their aggregates, which appear due to the complete disassembly of some of the capsids.
227 228
CD spectroscopic analysis 229
To investigate the structural changes in heat-treated T7 further, CD spectroscopic 230
measurements were performed at room temperature (25 ˚C) and progressively increased 231
temperatures (61 ˚C, 83 ˚C) (Fig 9). The CD spectra, recorded at 25, 61 and 83 ˚C, display 232
differences in the short-wavelength regime (at 225 nm), indicating that capsid-protein- 233
associated structural transitions take place not only between 25-61 ˚C, but also between 61-83 234
˚C. The latter appears to be part of a broad temperature-dependent transition that begins 235
slightly below 80 ˚C and peaks at 92 ˚C, and corresponds most likely to the loss of protein α- 236
helix content in a denaturing transition (12). In the AFM experiments, due to the brief (15 237
min) exposure to high temperature (80 ˚C) followed by cooling to room temperature, only 238
partial denaturation may have taken place.
239 240
Model of thermally-induced structural changes in T7 241
We propose the following phenomenological model to explain our observations (Fig. 10). At 242
room temperature (Fig. 10.a), T7 displays a characteristic icosahedral structure with 243
distinctive conical tail complex. The icosahedron is slightly swollen due to the DNA pressure 244
inside the capsid. The DNA-filled T7 phages have a high stiffness and withstand 245
(instantaneous) forces up to about 8 nN prior to breakage. Upon heating to 65 ˚C (Fig. 10.b), 246
on September 14, 2018 by guest http://jvi.asm.org/ Downloaded from
the genomic DNA is ejected from the capsid. The release of DNA is likely caused by the 247
conical tail complex breaking off the capsid, rather than by activating the natural DNA- 248
ejection machinery. It is currently unclear whether the entire genome of T7 exits the capsid, 249
or a portion remains inside. It is hypothesized that during its natural DNA ejection, only part 250
of the T7 genome is driven out of the capsid due to the DNA pressure. The remaining DNA is 251
thought to be pulled into the E.coli by an active process 252
(33-35). However, because the thermally-induced changes involve the loss of the entire tail 253
complex, there might be enough room for the nearly complete release of the T7 genome.
254
Regardless of how much DNA exits during this process, the resulting drop in DNA pressure 255
is accompanied by a shrinkage and a more faceted appearance of the capsid. Upon further 256
heating to 80˚C (Fig. 10.c) the capsids do not disappear, but they are still present with a 257
maintained global structure. A partial denaturation likely takes place in the gp10A proteins 258
that form the capsomeres and hence the capsid wall. The partial protein denaturation within 259
the global confinement of the capsid architecture, and the resulting exposure of hydrophobic 260
protein regions result in capsomere swelling and a new set of inter-capsomeric interactions, 261
most probably via hydrophobic protein regions. Facilitated folding and misfolding following 262
repetitive partial or complete denaturation have been observed in proteins confined either in a 263
chaperonin system(36) or in a force field(37). Notably, capturing a protein in the misfolded 264
state results in a considerable conformational expansion (38). We envision that similar 265
processes may occur in the gp10A proteins heated to 80˚C, then cooled to room temperature.
266
In the end, the capsid wall becomes thicker, and the entire capsid surface becomes rugged. It 267
is quite conceivable, that the hydrophobic stabilization is not the result of the heating per se, 268
but of the relaxation from the thermal exposure. That is, capsids that did not completely fall 269
apart during the 80 ˚C treatment may relax into a stabilized structure upon cooling back to 270
on September 14, 2018 by guest http://jvi.asm.org/ Downloaded from
room temperature. By adjusting the time of exposure to the high temperature, the capsid 271
stabilization may conceivably be tuned.
272 273
Conclusions 274
We have directly shown that exposing T7 to a thermal treatment at 65 ˚C caused the release 275
of its genomic DNA due to the tail complex breaking off the capsid. The loss of DNA and/or 276
thermally-driven changes in capsomeric protein structure result in a reduced capsid stiffness 277
and breaking force. Further heating to 80 ˚C leads to rearrangements within the capsid wall, 278
caused most likely by partial denaturation of the component gp10A proteins. Even though the 279
the capsids are destabilized, they are remarkably able to still withstand high temperatures 280
with a more-or-less intact global topographical structure. Thus, partial denaturation within the 281
global structural constraints of the viral capsid may have a stabilizing effect. Understanding 282
the structural design of viruses may help in constructing artificial nanocapsules for the 283
packaging and delivery of materials under harsh environmental conditions. By tuning capsid 284
stability, these nanocapsules may, in principle, be tailored for specific applications.
285 286
on September 14, 2018 by guest http://jvi.asm.org/ Downloaded from
Materials and methods 287
T7 preparation 288
T7 (ATCC 11303-B7) was grown in Escherichia coli (ATCC 11303) host cells and purified 289
according established methods (39). Briefly, the phage suspension was concentrated on a 290
CsCl gradient and dialyzed against buffer (20 mM Tris-HCl, 50 mM NaCl, pH 7.4)(14) . T7 291
bacteriophage concentration was determined from optical density by using an exctinction 292
coefficient of ε260 = 7.3 × 10³ (mol nucleotide bases × L-1 × cm-1). The dialyzed T7 samples 293
were kept at 4 ˚C for a few months without significant loss of activity. Prior to further use the 294
T7 samples were diluted with PBS (137 mM NaCl, 2.7 mM KCl, 10 mM Na2HPO4, 1.8 mM 295
KH2PO4, pH 7.4).
296 297
Atomic force microscopy and nanomanipulation 298
T7 samples properly diluted in PBS were applied to freshly cleaved mica functionalized with 299
glutaraldehyde(29, 40). The dilution was adjusted so that an approximate surface density of 300
10 phage particles per µm2 is achieved. A freshly-cleaved mica was first incubated with poly- 301
L-lysine (0.01 % aqueous solution) for 20 minutes at room temperature, then rinsed 302
extensively with MilliQ water and dried with a stream of high-purity N2 gas. Subsequently, 303
the surface was incubated with 10 % aqueous glutaraldehyde for 30 minutes at room 304
temperature, then rinsed extensively with MilliQ water and dried with a stream of high-purity 305
N2 gas. Finally, a sample of T7 phage was loaded onto the substrate surface and incubated for 306
40 minutes on ice. Unbound viruses were removed by gentle washing with PBS. Non-contact 307
mode AFM images were acquired with an Asylum Research Cypher instrument (Asylum 308
Research, Santa Barbara, CA) by using silicon-nitride cantilevers (Olympus BL-AC40TS-C2 309
or Nanoworld PNP-TR). 512 x 512-pixel images were collected at a typical scanning 310
frequency of 0.3-1.5 Hz and with a mean indentation force of about 30 pN. All of the images 311
on September 14, 2018 by guest http://jvi.asm.org/ Downloaded from
presented in this work were collected on non-fixed samples under aqueous buffer conditions.
312
For temperature-dependent measurements we used the cooler/heater stage of the AFM 313
instrument. Temperature was kept constant with a precision of 0.1 ˚C. Evaporation of water 314
was prevented by the sealed container housing the AFM scanner. For nanomechanical 315
measurements the surface-bound viruses were manipulated by first pressing the cantilever 316
(Nanoworld PNP-TR, lever 1) tip against the apex of the virus, then pulling the cantilever 317
away with a constant, pre-adjusted rate (29). Typical cantilever movement rate was 1 μm/s 318
except where noted otherwise. Stiffness was determined for each cantilever by using thermal 319
method (41).
320 321
Image processing and data analysis 322
AFM images and force spectra were analyzed using algorithms built in the Cypher controller 323
software (AsylumResearch, Santa Barbara, CA). Indentation distance (z) was calculated from 324
cantilever displacement (s), force (F) and cantilever stiffness (k) as 325
z=s-F/κ. (1)
326
AFM images were corrected for flatness of field (within a few Å) and their color contrast was 327
adjusted in order to better communicate the relevant features. No additional image processing 328
was carried out.
329 330
CD spectroscopy 331
Circular dichroism measurements were carried out on a Jasco J-810 dichrograph in 1 cm 332
quartz cell. The solvent reference spectra were automatically subtracted from the CD spectra 333
of the samples. The solvent was a buffer containing 20 mM TRIS and 50 mM NaCl (pH 7.4).
334
Temperature was controlled with a PFD-425S type Peltier heating system. For temperature- 335
controlled measurements, the sample cell was equilibrated for 3 minutes at the target 336
on September 14, 2018 by guest http://jvi.asm.org/ Downloaded from
temperature prior to data acquisition. CD band intensities were expressed in molar ellipticity, 337
Θ (deg∙cm2∙dmol-1). Spectra were smoothed by the Savitzky-Golay algorithm.
338 339
Statistics 340
The number of nanomechanical curves, images and particles (T7 or globular) analyzed are 341
shown in the relevant figures. The results shown in this manuscript were collected in 15 342
independent nanomechanics and 9 independent AFM imaging experiments. The CD spectra 343
are the average of three scans. CD data were analyzed by using the Microcal Origin software 344
(OriginLab, Northampton, MA). Statistical analyses and graph plotting was carried out by 345
using either KaleidaGraph (v.4.5.1, Synergy Software, Reading, PA) or IgorPro (v. 6.34A, 346
Wavementrics, Lake Oswego, OR) programs.
347 348 349 350
Acknowledgements 351
This work was supported by grants from the Hungarian National Research, Development and 352
Innovation Office (K109480; K124966; VKSZ_14-1-2015-0052; NVKP-16-1-2016-0017 353
National Heart Program). The research leading to these results has received funding from the 354
European Union's Seventh Framework Program (FP7/2007-2013) under grant agreement n°
355
HEALTH-F2-2011-278850 (INMiND).
356 357
Z.V. performed research, analyzed data, and wrote the paper; G.C. performed research, 358
contributed analytic tools, and wrote the paper; L.H. analyzed data and wrote the paper; M.K.
359
designed research, performed research, analyzed data, and wrote the paper.
360 361
on September 14, 2018 by guest http://jvi.asm.org/ Downloaded from
References 362
363
1. Foster RAC, Johnson FH, Miller VK. 1949. The influence of hydrostatic pressure 364
and urethane on the thermal inactivation of bacteriophage. J Gen Physiol 33:1–16.
365
2. Pollard EC, Solosko W. 1971. The thermal inactivation of T4 and lambda 366
bacteriophage. Biophysj 11:66–74.
367
3. Yamagishi H, Ozeki H. 1972. Comparative study of thermal inactivation of phage phi 368
80 and lambda. Virology 48:316–322.
369
4. Wetzel R, Perry LJ, Baase WA, Becktel WJ. 1988. Disulfide bonds and thermal 370
stability in T4 lysozyme. Proc Natl Acad Sci USA 85:401–405.
371
5. Brié A, Bertrand I, Meo M, Boudaud N, Gantzer C. 2016. The Effect of Heat on 372
the Physicochemical Properties of Bacteriophage MS2. Food Environ Virol 8:251–
373
261.
374
6. Wigginton KR, Kohn T. 2012. Virus disinfection mechanisms: the role of virus 375
composition, structure, and function. Curr Opin Virol 2:84–89.
376
7. Pfaender S, Brinkmann J, Todt D, Riebesehl N, Steinmann J, Steinmann J, 377
Pietschmann T, Steinmann E. 2015. Mechanisms of methods for hepatitis C virus 378
inactivation. Appl Environ Microbiol 81:1616–1621.
379
8. Wigginton KR, Pecson BM, Sigstam T, Bosshard F, Kohn T. 2012. Virus 380
inactivation mechanisms: impact of disinfectants on virus function and structural 381
integrity. Environ Sci Technol 46:12069–12078.
382
on September 14, 2018 by guest http://jvi.asm.org/ Downloaded from
9. Conway JF, Cheng N, Ross PD, Hendrix RW, Duda RL, Steven AC. 2007. A 383
thermally induced phase transition in a viral capsid transforms the hexamers, leaving 384
the pentamers unchanged. J Struct Biol 158:224–232.
385
10. Duda RL, Ross PD, Cheng N, Firek BA, Hendrix RW, Conway JF, Steven AC.
386
2009. Structure and Energetics of Encapsidated DNA in Bacteriophage HK97 Studied 387
by Scanning Calorimetry and Cryo-electron Microscopy. J Mol Biol 391:471–483.
388
11. Qiu X. 2012. Heat induced capsid disassembly and DNA release of bacteriophage λ.
389
PLoS ONE 7:e39793.
390
12. Csík G, Egyeki M, Herényi L, Majer Z, Tóth K. 2009. Role of structure-proteins in 391
the porphyrin-DNA interaction. J Photochem Photobiol B, Biol 96:207–215.
392
13. Tóth K, Rontó G. 1987. Salt effects on bacteriophage T7-I. Physiol Chem Phys Med 393
NMR 19:59–66.
394
14. Tóth K, Csik G, Rontó GY. 1987. Salt effects on the bacteriophage T7-II structure 395
and activity changes. Physiol Chem Phys Med NMR 19:67–74.
396
15. Zupán K, Herényi L, Tóth K, Majer Z, Csík G. 2004. Binding of cationic porphyrin 397
to isolated and encapsidated viral DNA analyzed by comprehensive spectroscopic 398
methods. Biochemistry 43:9151–9159.
399
16. Cerritelli ME, Cheng N, Rosenberg AH, McPherson CE, Booy FP, Steven AC.
400
1997. Encapsidated conformation of bacteriophage T7 DNA. Cell 91:271–280.
401
17. Fekete A, Rontó G, Feigin LA, Tikhonychev VV, Módos K. 1982. Temperature 402
dependent structural changes of intraphage T7 DNA. Biophys Struct Mech 9:1–9.
403
on September 14, 2018 by guest http://jvi.asm.org/ Downloaded from
18. Agirrezabala X, Velázquez-Muriel JA, Gómez-Puertas P, Scheres SHW, Carazo 404
JM, Carrascosa JL. 2007. Quasi-Atomic Model of Bacteriophage T7 Procapsid 405
Shell: Insights into the Structure and Evolution of a Basic Fold. Structure 15:461–472.
406
19. Guo F, Liu Z, Fang PA, Zhang Q, Wright ET, Wu W, Zhang C, Vago F, Ren Y, 407
Jakana J, Chiu W, Serwer P, Jiang W. 2014. Capsid expansion mechanism of 408
bacteriophage T7 revealed by multistate atomic models derived from cryo-EM 409
reconstructions. Proc Natl Acad Sci U S A 111:E4606–E4614.
410
20. Michel JP, Ivanovska IL, Gibbons MM, Klug WS, Knobler CM, Wuite GJL, 411
Schmidt CF. 2006. Nanoindentation studies of full and empty viral capsids and the 412
effects of capsid protein mutations on elasticity and strength. Proc Natl Acad Sci USA 413
103:6184–6189.
414
21. Kol N, Gladnikoff M, Barlam D, Shneck RZ, Rein A, Rousso I. 2006. Mechanical 415
properties of murine leukemia virus particles: effect of maturation. Biophysj 91:767–
416
774.
417
22. Ivanovska IL, Miranda R, Carrascosa JL, Wuite GJL, Schmidt CF. 2011.
418
Discrete fracture patterns of virus shells reveal mechanical building blocks. Proc Natl 419
Acad Sci U S A 108:12611–12616.
420
23. Kurland NE, Drira Z, Yadavalli VK. 2012. Measurement of nanomechanical 421
properties of biomolecules using atomic force microscopy. Micron 43:116–128.
422
24. Castellanos M, Pérez R, Carrasco C, Hernando-Perez M, Gómez-Herrero J, de 423
Pablo PJ, Mateu MG. 2012. Mechanical elasticity as a physical signature of 424
conformational dynamics in a virus particle. Proc Natl Acad Sci U S A 109:12028–
425
12033.
426
on September 14, 2018 by guest http://jvi.asm.org/ Downloaded from
25. Mateu MG. 2012. Mechanical properties of viruses analyzed by atomic force 427
microscopy: a virological perspective. Virus Res 168:1–22.
428
26. Cieplak M, Robbins MO. 2013. Nanoindentation of 35 virus capsids in a molecular 429
model: relating mechanical properties to structure. PLoS ONE 8:e63640.
430
27. Hernando-Pérez M, Lambert S, Nakatani-Webster E, Catalano CE, de Pablo PJ.
431
2014. Cementing proteins provide extra mechanical stabilization to viral cages. Nat 432
Commun 5.
433
28. Ramalho R, Rankovic S, Zhou J, Aiken C, Rousso I. 2016. Analysis of the 434
mechanical properties of wild type and hyperstable mutants of the HIV-1 capsid.
435
Retrovirology 1–7.
436
29. Vörös Z, Csík G, Herényi L, Kellermayer MSZ. 2017. Stepwise reversible 437
nanomechanical buckling in a viral capsid. Nanoscale 9:1136–1143.
438
30. Kellermayer MSZ, Vörös Z, Csík G, Herényi L. 2018. Forced phage uncorking:
439
viral DNA ejection triggered by a mechanically sensitive switch. Nanoscale 10:1898–
440
1904.
441
31. Serwer P. 1976. Internal proteins of bacteriophage T7. J Mol Biol 107:271–291.
442
32. Steven AC, Trus BL, Maizel JV, Unser M, Parry DA, Wall JS, Hainfeld JF, 443
Studier FW. 1988. Molecular substructure of a viral receptor-recognition protein. The 444
gp17 tail-fiber of bacteriophage T7. J Mol Biol 200:351–365.
445
33. Molineux IJ. 2001. No syringes please, ejection of phage T7 DNA from the virion is 446
enzyme driven. Molecular Microbiology 40:1–8.
447
on September 14, 2018 by guest http://jvi.asm.org/ Downloaded from
34. Molineux IJ, Panja D. 2013. Popping the cork: mechanisms of phage genome 448
ejection. Nat Rev Microbiol 11:194–204.
449
35. Molineux IJ. 2006. Fifty-three years since Hershey and Chase; much ado about 450
pressure but which pressure is it? Virology 344:221–229.
451
36. Lin Z, Puchalla J, Shoup D, Rye HS. 2013. Repetitive protein unfolding by the trans 452
ring of the GroEL-GroES chaperonin complex stimulates folding. Journal of 453
Biological Chemistry 288:30944–30955.
454
37. Oberhauser AF, Marszalek PE, Carrion-Vazquez M, Fernandez JM. 1999. Single 455
protein misfolding events captured by atomic force microscopy. Nat Struct Biol 456
6:1025–1028.
457
38. Hammarstrom P, Persson M, Carlsson U. 2001. Protein compactness measured by 458
fluorescence resonance energy transfer. Human carbonic anhydrase ii is considerably 459
expanded by the interaction of GroEL. J Biol Chem 276:21765–21775.
460
39. Strauss JH, Sinsheimer RL. 1963. Purification and properties of bacteriophage MS2 461
and of its ribonucleic acid. J Mol Biol 7:43–54.
462
40. Wang H, Bash R, Yodh JG, Hager GL, Lohr D, Lindsay SM. 2002. Glutaraldehyde 463
modified mica: a new surface for atomic force microscopy of chromatin. Biophysj 464
83:3619–3625.
465
41. Matei GA, Thoreson EJ, Pratt JR, Newell DB, Burnham NA. 2006. Precision and 466
accuracy of thermal calibration of atomic force microscopy cantilevers. Review of 467
Scientific Instruments 77:083703.
468
on September 14, 2018 by guest http://jvi.asm.org/ Downloaded from
42. Vörös Z, Csík G, Herényia L, Kellermayer MSZ. 2017. Stepwise reversible 469
nanomechanical buckling in a viral capsid. Nanoscale 9:1136–1143.
470
471
on September 14, 2018 by guest http://jvi.asm.org/ Downloaded from
Figure legends 472
473
Figure 1. Nanomechanics of T7 phages. a. Schematics of mechanical manipulation: the tip of 474
the AFM cantilever is first brought into contact with the T7 phage surface (i) which is then 475
pressed (ii) with a pre-adjusted velocity to 10 nN maximal force during which the capsid 476
eventually ruptures (iii). Finally the cantilever is lifted (iv). AFM cantilever and T7 phage are 477
not to scale. b. Representative force versus indentation curve obtained at room temperature.
478
Data collected during the indentation half-cycle is displayed in red, whereas those during 479
retraction in blue. Notable stages of the nanomechanics experiments are shown with small 480
Roman numerals (i-iv). Variables extracted from the data (breaking force F, maximal 481
indentation distance x, capsid height h) are shown with italic letters. Capsid stiffness (k) is 482
obtained by fitting a line in the initial linear regime of the indentation data (ii). c. Dataset 483
containing 80 similar, overlaid force versus indentation curves collected in independent 484
experiments on different phage particles at room temperature (42). Red and blue traces are 485
indentation and retraction half cycles, respectively. d. Dataset containing 55 similar, overlaid 486
force versus indentation curves (indentation half cycle only), collected at room temperature in 487
independent experiments, which are similar to each other but are distinctively different from 488
the dataset in c (putatively called empty-capsid curves, see later).
489 490
Figure 2. Nanomechanics data of heat-treated T7 phages. Red and blue indicate indentation 491
and retraction half-cycles, respectively. a. Representative force versus indentation curve 492
measured on a T7 phage particle that has been exposed to a temperature of 65 ˚C for 15 493
minutes. b. Dataset containing 45 similar, overlaid force versus indentation curves collected 494
in independent experiments on different phage particles heat-treated at 65 ˚C. c.
495
Representative force versus indentation curve measured on a T7 phage particle that has been 496
on September 14, 2018 by guest http://jvi.asm.org/ Downloaded from
exposed to a temperature of 80 ˚C for 15 minutes. d. Dataset containing 41 similar, overlaid 497
force versus indentation curves collected in independent experiments on different phage 498
particles heat-treated at 80 ˚C.
499 500
Figure 3. Distribution of variables obtained from nanomechanics data. Breaking force (a, b, 501
c), stiffness (d, e, f), maximal indentation distance (g, h, i) and capsid height (j, k, l) 502
histograms for T7 phage particles at room temperature (RT) and ones treated at 65 ˚C and 80 503
˚C, respectively. Light gray bars correspond to data obtained on empty capsids at room 504
temperature. The numbers (n) refer to the number of force curves analyzed to obtain the 505
nanomechanical parameters.
506 507
Figure 4. Temperature-dependent AFM measurements on T7 phage particles. a. Thermal 508
treatment protocol. Sample temperature versus time trace recorded in a typical experiment.
509
The same sample is exposed to consecutive heating (for 15 min) cooling (to 20 ˚C) and image 510
acquisition (at 20 ˚C) cycles. b. Overview of a 1 µm x 1 µm sample area at room temperature 511
(20 ˚C). Slow AFM raster scan direction is from top to bottom of the image. White arrowhead 512
points at the nearly instantaneous event of mechanically induced DNA ejection. Scale bar 100 513
nm. Inset, topographical height map along an arbitrarily chosen line in the background (white 514
dashed line). c. AFM images of T7 phage particles displaying their conical tail in different 515
orientations. White arrowheads point at the tail apices. Scale bar 30 nm. d. High-resolution 516
AFM images of the T7 phage surfaces with resolvable capsomeres. Views along the two-fold 517
(i, ii) and three-fold symmetry axes (iii), which are explained in (iv), are shown. Scale bar 10 518
nm. In the bottom row dashed guiding lines are superimposed on the respective images to 519
indicate the symmetries. e. Magnified view of a cogwheel-shaped hexagonal capsomere.
520
Arrowheads point at the spokes of the cogwheel. Scale bar 10 nm.
521
on September 14, 2018 by guest http://jvi.asm.org/ Downloaded from
522
Figure 5. AFM of T7 phages treated at 65 ˚C. a. Overview of a 1 µm x 1 µm sample area.
523
White arrowheads point at large (>10 nm) globular particles. Scale bar 100 nm. Inset, 524
topographical height map along an arbitrarily chosen line in the background (white dashed 525
line). Black arrowheads point at DNA cross-sections, whereas the empty arrowhead at the 526
substrate (mica) surface. b. Comparison of icosahedral facets of room-temperature (i) and 65- 527
degree (ii) capsids. AFM images contrast enhanced with identical color-scale offset (48 nm) 528
and range (20 nm). c. AFM image of two T7 particles. White arrowhead points at the short, 529
stubby tail complex visible on one of the particles whereas there is no visible tail on the other 530
one. Scale bar 20 nm. d. High-resolution AFM images of 65 ˚C-treated T7 phage particles 531
with resolvable capsomeres on their surfaces. Views are along the three-fold symmetry axes.
532
Because of contrast enhancement, only the top facets are visible and the rest of the capsid is 533
hidden. Scale bar 10 nm. e. T7 particles with resolvable DNA exit holes (white arrowheads).
534
The exit hole appears as a gap in the location of a missing pentagonal capsomere at one of the 535
icosahedron vertices. Images viewed along the two-fold (i), three-fold (ii, iii, iv) and five-fold 536
symmetry axes (v, vi) are shown. Images iii and v are reconstructed from the rightward fast 537
AFM scanlines, whereas images iv and vi are from leftward (reverse) scanlines from the 538
same sample area. Scale bars, 20 nm. f. Magnified view of a cogwheel-shaped hexagonal 539
capsomere. Arrowheads point at the spokes of the cogwheel. Scale bar 10 nm.
540 541
Figure 6. AFM of T7 phages treated at 80 ˚C. a. Overview of a 1 µm x 1 µm sample area.
542
White arrowheads point at large (>10 nm) globular particles. Scale bar 100 nm. b. AFM 543
image showing large aggregates of globular particles (white arrowheads) c. High-resolution 544
AFM images of 80-degree-treated T7 phage particles with resolvable capsomeres on their 545
surface. Views along the three-fold (i, iii) and two-fold symmetry axes (ii) are shown. Scale 546
on September 14, 2018 by guest http://jvi.asm.org/ Downloaded from
bar 10 nm. d. Magnified view of the capsomeric structure. Arroheads point at putative spokes 547
of the originally cogwheel-shaped capsomere. Note that the central pore cannot be resolved, 548
most likely due to the swelling of the protein matrix. Scale bar 10 nm.
549 550
Figure 7. Analysis of capsid topography data. a. Topographical height map along the cross- 551
section of either a capsid at room temperature (green trace) or ones treated at 65 ˚C (orange) 552
or 80 ˚C (red). b. Ratio of capsids with tails as a function of temperature. The numbers above 553
the bars represent the number of fields analyzed for every T7 particle. Error bars represent 554
standard deviation (SD). c. Capsomer diameter as a function of temperature. The numbers 555
above the bars represent the number of capsomers measured. Error bars represent standard 556
deviation (SD). d, e and f show histograms of peak capsid heights for room-temperature 557
(RT), 65 ˚C and 80 ˚C treated T7 phages, respectively. Peak height refers to the tallest 558
topographical point in the capsid image. The numbers (n) refer to the number of T7 phage 559
particles analyzed.
560 561
Figure 8. Analysis of topographical data of globular particles. a. Number of globular 562
particles per field as a function of temperature. The numbers above the bars represent the 563
number of fields analyzed for every particle. Error bars represent standard deviation (SD). b, 564
c and d show histograms of globular particle height for samples at room temperature (RT) 565
and ones treated at 65 ˚C and 80 ˚C, respectively. Black arrowheads point at populations of 566
large globular particles. The numbers (n) refer to the number of globular particles analyzed.
567 568
Figure 9. CD spectroscopy of heat-treated T7. CD spectra of T7 samples recorded at room 569
temperature (25 ˚C, black line), at 61 ˚C (blue line) and 83 ˚C (red line). Arrow marks the 570
wavelength of 225 nm, at which the protein-dependent changes were monitored.
571
on September 14, 2018 by guest http://jvi.asm.org/ Downloaded from
572
Figure 10. Schematic model of thermally-induced changes in the T7 bacteriophage. At room 573
temperature (a) the capsid is slightly swollen because of the DNA pressure inside. The 574
bulging of the capsid wall as shown in the scheme is not to scale. Upon heating to and 575
incubating at a temperature of 65 ˚C (b), the tail complex is broken off, resulting in the 576
release of the genomic DNA. The capsid becomes more faceted due to the relaxation of the 577
capsid pressure. Finally, at 80 ˚C (c) the capsid becomes swollen and its surface irregular, and 578
the capsids may become fragmented into large globular particles (this last step is not shown).
579 580
on September 14, 2018 by guest http://jvi.asm.org/ Downloaded from
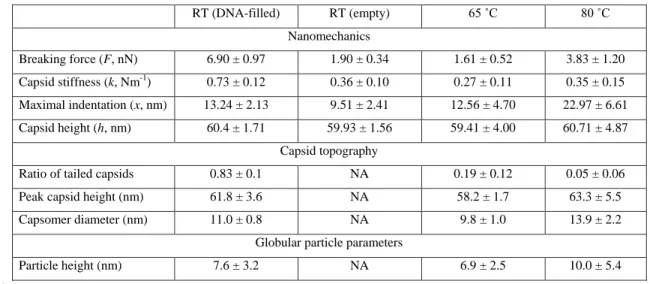
Table 1. Nanomechanical and topographical parameters of T7 bacteriophage capsids and 581
globular particles (mean ±S.D.).
582 583
RT (DNA-filled) RT (empty) 65 ˚C 80 ˚C
Nanomechanics
Breaking force (F, nN) 6.90 ± 0.97 1.90 ± 0.34 1.61 ± 0.52 3.83 ± 1.20 Capsid stiffness (k, Nm-1) 0.73 ± 0.12 0.36 ± 0.10 0.27 ± 0.11 0.35 ± 0.15 Maximal indentation (x, nm) 13.24 ± 2.13 9.51 ± 2.41 12.56 ± 4.70 22.97 ± 6.61 Capsid height (h, nm) 60.4 ± 1.71 59.93 ± 1.56 59.41 ± 4.00 60.71 ± 4.87
Capsid topography
Ratio of tailed capsids 0.83 ± 0.1 NA 0.19 ± 0.12 0.05 ± 0.06
Peak capsid height (nm) 61.8 ± 3.6 NA 58.2 ± 1.7 63.3 ± 5.5
Capsomer diameter (nm) 11.0 ± 0.8 NA 9.8 ± 1.0 13.9 ± 2.2
Globular particle parameters
Particle height (nm) 7.6 ± 3.2 NA 6.9 ± 2.5 10.0 ± 5.4
584