University of Sopron
Alexander Lámfalussy Faculty of Economics
István Széchenyi Doctoral School of Economics and Management
THE IMPACT OF DIGITAL FINANCIAL SERVICES ON THE PROFITABILITY OF AGRICULTURE ENTERPRISES:
A COMPARATIVE STUDY IN HUNGARY AND INDONESIA
Doctoral (PhD) Dissertation
Written by:
Rosita Widjojo
Supervisor:
Prof. Dr. Csaba Székely, DSc.
Sopron 2021
THE IMPACT OF DIGITAL FINANCIAL SERVICES ON THE PROFITABILITY OF AGRICULTURE ENTERPRISES:
A COMPARATIVE STUDY IN HUNGARY AND INDONESIA Dissertation to obtain a PhD degree
Written by:
Rosita Widjojo
Prepared by the University of Sopron
István Széchenyi Doctoral School of Economics and Management
within the framework of the International Economy and Management Programme
Supervisor:
Prof. Dr. Csaba Székely, DSc.
The supervisor has recommended the evaluation of the dissertation to be accepted: yes/no
________________________________
Supervisor‘s signature
Date of comprehensive exam: yy/mm/dd Comprehensive exam result ………..%
The evaluation has been recommended for approval by the reviewers (yes/no)
1. Jury: Dr. ………. yes/no ………..
Signature
2. Jury: Dr. ……….. yes/no ……….
Signature Result of the public dissertation defense: ………%
Sopron, yyyy/mm/dd
………..
Chairperson of the Judging Committee
Qualification of the PhD degree: ………..
……….
UDHC Chairperson
TABLE OF CONTENTS
ABSTRACT ... 5
LIST OF FIGURES ... 6
LIST OF TABLES ... 7
LIST OF ABBREVIATIONS ... 10
CHAPTER 1: INTRODUCTION ... 11
1.1. Background of the Research Topic ... 11
1.2. Digitalization in the Agriculture Sector ... 14
1.2.1 Overview of the Indonesian Agriculture Sector ... 18
1.2.2 Digitalization in Indonesian Agriculture ... 22
1.2.3 Overview of the Hungarian Agriculture Sector ... 23
1.2.4 Digitalization in Hungarian Agriculture ... 27
1.3 Research Objectives ... 28
1.4 Research Gap ... 29
1.5 Planning of the Research... 29
1.6 Possible Constraints ... 30
CHAPTER 2: REVIEW OF RELATED LITERATURE ... 31
2.1 The Cooperative Structure of Indonesia ... 31
2.2 The Cooperative Structure in Hungary ... 36
2.3 Definitions ... 41
2.3.1 Cooperatives and Agriculture Enterprises ... 41
2.3.2 Digital Financial Services ... 46
2.3.3 Profitability Evaluation ... 48
2.4 The Link between Agriculture Value Chain and DFS ... 53
2.5 Empirical Evidence for Impact ... 55
2.6 Summary of Literature Review ... 56
CHAPTER 3: RESEARCH METHODOLOGY ... 61
3.1 Research Questions ... 61
3.2 Hypotheses ... 62
3.3 Methodology ... 63
3.4 Survey and Collecting Data ... 65
3.5 Methods and Analysis ... 68
CHAPTER 4: RESULTS AND DISCUSSIONS ... 71
4.1 The Questionnaire Analysis ... 71
4.2 Normality Test for Financial Data ... 105
4.3 Hypothesis Testing for Revenue ... 106
4.4 Hypothesis Testing for Total Variable Cost... 109
4.5 Hypothesis Testing for Gross Margin ... 111
4.6 Results ... 113
4.7 New Scientific Contribution ... 121
4.8 Limitations ... 123
CHAPTER 5: CONCLUSIONS AND RECOMMENDATIONS ... 125
5.1 Conclusions ... 125
5.2 Recommendations ... 127
REFERENCES ... 128
APPENDICES ... 135
ACKNOWLEDGEMENTS ... 157
DECLARATION OF ACADEMIC HONESTY ... 158
ABSTRACT
The agriculture sector has a significant role to provide for food security in nations, and with the development of technology, digital financial services (DFS) in the agriculture sector can help deision makers to find ways to provide accessibility and efficiency in farming operations. This study intends to fill in the research gap about to what extent DFS could improve profitability of agriculture enterprises in a developed country (Hungary) in contrast to a developing country (Indonesia). The literature review in this study provides the history, structure, definitions and terms used, e.g. agriculture enterprise, DFS, profitability. The methods used in this study are (1) a survey to map DFS in agriculture enterprises, comparing two countries, Indonesia and Hungary, and (2) secondary data analysis to measure the significance of DFS on profitability measures, which are which are revenue, total costs and gross margin, in Indonesia and Hungary. The results from the chi-square test show that most of the variables are significant between countries (Indonesia and Hungary). The result also includes constraints in agriculture development and important features in DFS development.
The regression analysis shows that DFS is significant to agriculture enterprises in Hungary but not significant to agriculture enterprises in Indonesia. In conclusion, as DFS in agriculture enterprises in Hungary are widely used through a specific system, a similar system could be applied to Indonesia through agriculture enterprises especially for rural areas where banks are not accessible. There is also an urgent need from agriculture enterprises to provide farmers with education and training to use DFS to facilitate farming transactions.
Keywords: digital financial services, profitability, agriculture enterprises
LIST OF FIGURES
Page
FIGURE 1. AGRICULTURE AND FOOD VALUE CHAIN ... 14
FIGURE 2. ILLUSTRATIVE DFS NEEDS AT DIFFERENT AGRI-VALUE CHAIN LEVEL ... 16
FIGURE 3. SHARE OF ECONOMIC SECTORS IN INDONESIA‘S GDP FROM 2010 TO 2019 ... 18
FIGURE 4. AGRICULTURE, FORESTRY AND FISHING TO GDP AND EMPLOYMENT IN AGRICULTURE IN SELECTED APEC COUNTRIES (IN PERCENT), 2018 ... 20
FIGURE 5. THE GROWTH OF AGRICULTURAL LAND AREA IN INDONESIA (IN MILLIONS OF HECTARES) ... 21
FIGURE 6. DIGITAL LANDSCAPE IN INDONESIA, 2019 (IN PERCENT) ... 22
FIGURE 7. SHARE OF ECONOMIC FACTORS IN HUNGARY‘S GDP FROM 2010 TO 2019 ... 24
FIGURE 8. HUNGARY: FARMS AND FARMLAND BY FARM SIZE, 2016 (IN STANDARD OUTPUT) . 24 FIGURE 9. AGRICULTURE, FORESTRY AND FISHING TO GDP AND EMPLOYMENT IN AGRICULTURE IN HUNGARY AND ITS NEIGHBORING COUNTRIES (IN PERCENT), 2018... 25
FIGURE 10. HUNGARY‘S DIGITAL LANDSCAPE, 2019 (IN PERCENT) ... 27
FIGURE 11. NUMBER OF COOPERATIVES IN INDONESIA FROM 1967 TO 2015 (IN UNITS) ... 34
FIGURE 12. NUMBER OF ACTIVE COOPERATIVES IN INDONESIA FROM 1967 TO 2015 (IN UNITS) ... 34
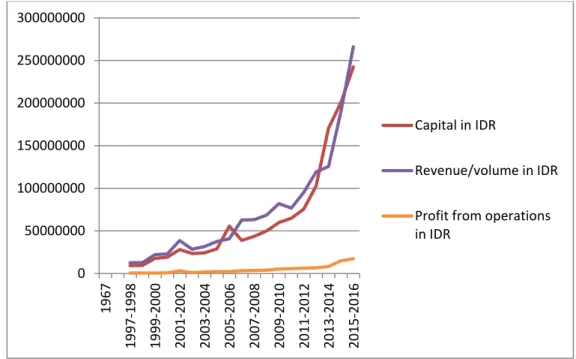
FIGURE 13. AMOUNT OF CAPITAL, REVENUE AND PROFIT FROM OPERATIONS FROM INDONESIAN COOPERATIVES (IN IDR), FROM 1967 TO 2015 ... 35
FIGURE 14. FLOW OF THE RESEARCH STEPS ... 61
FIGURE 15. THEORETICAL FRAMEWORK OF THE RESEARCH ... 62
FIGURE 16. CONSTRAINTS TO AGRICULTURE ENTERPRISE DEVELOPMENT ... 116
FIGURE 17. IMPORTANT FEATURES OF DFS ... 118
LIST OF TABLES
Page
TABLE 1. NUMBER OF FARM HOLDINGS AND FARM SIZE, INDONESIA ... 19
TABLE 2. NUMBER OF FARMS BY PHYSICAL SIZE CATEGORIES IN HUNGARY, 2012-2016 ... 26
TABLE 3. LIST OF POSSIBLE CONSTRAINTS ... 30
TABLE 4. THE TIMELINE OF COOPERATIVE REGULATIONS IN INDONESIA ... 32
TABLE 5. THE TIMELINE OF COOPERATIVE DEVELOPMENTS IN HUNGARY ... 37
TABLE 6. FARM STRUCTURE, KEY INDICATORS, HUNGARY, 2000 AND 2010 ... 40
TABLE 7. AGRICULTURAL PRODUCTION CYCLE: SCHEDULE, REQUIREMENTS AND RELEVANCE FOR DFS ... 54
TABLE 8. SUMMARY OF THE MAIN LITERATURE REVIEW ... 57
TABLE 9. SAMPLE SIZE FOR A GIVEN POPULATION SIZE ... 66
TABLE 10. ADVANTAGES AND DISADVANTAGES OF USING SECONDARY ANALYSIS ... 67
TABLE 11. GENDER (1)... 73
TABLE 12. AGE (2) ... 73
TABLE 13. EDUCATION (3) ... 74
TABLE 14. INVOLVED IN AGRICULTURAL PRODUCTION OR AGRICULTURE BUSINESS (4) ... 74
TABLE 15. CONNECTION TO THE FARM AREA AS (5) ... 75
TABLE 16. YEARS OF INVOLVEMENT IN AGRICULTURE (6) ... 75
TABLE 17. FARMING AS A PRIMARY OCCUPATION (7) ... 76
TABLE 18. THE MAIN AGRICULTURE PRODUCTS IN FARM (8) ... 76
TABLE 19. TYPES OF AGRICULTURE ENTERPRISE INVOLVED IN FARMING ACTIVITIES (9) ... 77
TABLE 20. FARM INPUTS PURCHASED FROM AGRICULTURE ENTERPRISES (10) ... 77
TABLE 21. FARM SIZE (11) ... 78
TABLE 22. FARM TURNOVER (IN EUR) (12) ... 78
TABLE 23. OPINION ABOUT THE COSTS OF FARMING ACTIVITIES COMPARED TO THE TURNOVER (13) ... 79
TABLE 24. BENEFITS TO MEMBERS PROVIDED BY THE AGRICULTURE ENTERPRISE: BETTER POSSIBILITIES TO EXPAND THE AGRICULTURAL PRODUCTION (14.1) ... 80
TABLE 25. BENEFITS TO MEMBERS PROVIDED BY THE AGRICULTURE ENTERPRISE: THE AGRICULTURE ENTERPRISE OPERATES IN THE NEARBY REGION (14.2) ... 80
TABLE 26. BENEFITS TO MEMBERS PROVIDED BY THE AGRICULTURE ENTERPRISE: THE AGRICULTURE ENTERPRISE OFFERS GOOD SERVICE FOR THE MEMBERS (14.3) ... 81
TABLE 27. BENEFITS TO MEMBERS PROVIDED BY THE AGRICULTURE ENTERPRISE: THE AGRICULTURE ENTERPRISE PAYS A COMPETITIVE PRODUCER PRICE (14.4) ... 81
TABLE 28. BENEFITS TO MEMBERS PROVIDED BY THE AGRICULTURE ENTERPRISE THE AGRICULTURE ENTERPRISE OFFERS A STABLE MARKET CHANNEL (14.5) ... 82
TABLE 29. BENEFITS TO MEMBERS PROVIDED BY THE AGRICULTURE ENTERPRISE: MEMBERSHIP SECURES THE MARKETING OF PRODUCTS (14.6) ... 82
TABLE 30. BENEFITS TO MEMBERS PROVIDED BY THE AGRICULTURE ENTERPRISE: THE AGRICULTURE ENTERPRISE PROVIDES EASY ACCESS TO CREDIT TO MEMBERS (14.7) ... 83
TABLE 31. BENEFITS TO MEMBERS PROVIDED BY THE AGRICULTURE ENTERPRISE: THE AGRICULTURE ENTERPRISE INCREASES THE INCOME OF MEMBERS (14.8) ... 83
TABLE 32. BENEFITS TO MEMBERS PROVIDED BY THE AGRICULTURE ENTERPRISE: THE AGRICULTURE ENTERPRISE PROVIDES EDUCATION AND TRAINING FOR ITS MEMBERS (14.9) ... 84
TABLE 33. CONSTRAINTS TO AGRICULTURE ENTERPRISE DEVELOPMENT (15) ... 85
TABLE 34. DO YOU, AS AN INDIVIDUAL, OR AS A MEMBER OF AN AGRICULTURE ENTERPRISE,
HAVE A BANK ACCOUNT? (16) ... 85
TABLE 35. WHERE DO YOU GET FINANCIAL SUPPORT (E.G. CREDITS, LOANS, ETC) TO FINANCE YOUR ACTIVITIES? (17) ... 86
TABLE 36. WHAT IS THE PERCENTAGE OF FUNDS RECEIVED FROM NATIONAL BANK AND/OR THE EU? (17.1) ... 86
TABLE 37. WHAT IS THE PERCENTAGE OF FUNDS RECEIVED FROM THE REGIONAL BANK? (17.2) ... 87
TABLE 38. WHAT IS THE PERCENTAGE OF FUNDS RECEIVED FROM THE PRIVATE BANK? (17.3) ... 88
TABLE 39. WHAT IS THE PERCENTAGE OF FUNDS RECEIVED FROM OWN SOURCES? (17.4) ... 88
TABLE 40. WHAT IS THE PERCENTAGE OF FUNDS RECEIVED FROM OTHER SOURCES? (17.5) .... 89
TABLE 41. PRIMARY BANK : MAKES IT EASY FOR ME TO USE THEIR SERVICES (18.1) ... 89
TABLE 42. PRIMARY BANK: THE GOOD QUALITY OF THE SERVICES OF THE BANK (18.2) ... 90
TABLE 43. PRIMARY BANK : ROUTINELY LOOKS FOR WAYS TO IMPROVE MY EXPERIENCE OR DELIVER GREATER VALUE (18.3) ... 90
TABLE 44. PRIMARY BANK: OFFERS THE MOST VALUE COMPARED TO THE SAME TYPES OF SERVICES (18.4) ... 91
TABLE 45. PRIMARY BANK: IS TRANSPARENT ON SERVICE FEES (18.5) ... 91
TABLE 46. PRIMARY BANK : KNOW WHAT THE CUSTOMER NEEDS (18.6) ... 92
TABLE 47. MOST PREFERRED CHANNEL FOR BANKING ACTIVITIES ... 92
TABLE 48. HOW OFTEN DO YOU USE THE BANK BRANCH/OFFICE CHANNEL ... 93
TABLE 49. HOW OFTEN DO YOU USE THE ATM CHANNEL ... 93
TABLE 50. HOW OFTEN DO YOU USE THE CALL CENTER CHANNEL ... 94
TABLE 51.FREQUENCY OF USING ONLINE BANKING CHANNEL ... 94
TABLE 52. FREQUENCY OF USING MOBILE APPS CHANNEL ... 95
TABLE 53. PREFERRED CHANNEL TO APPLY FOR CREDIT CARD ... 95
TABLE 54. PREFERRED CHANNEL TO APPLY FOR DEBIT CARD... 96
TABLE 55. PREFERRED CHANNEL FOR TRANSACTIONS/CHECKING ACCOUNTS ... 96
TABLE 56. PREFERRED CHANNEL FOR SAVINGS/DEPOSIT ACCOUNTS ... 97
TABLE 57. PREFERRED CHANNEL TO APPLY FOR PERSONAL LOANS... 97
TABLE 58. PREFERRED CHANNEL FOR WEALTH MANAGEMENT ACCOUNT... 98
TABLE 59. PREFERRED CHANNEL TO APPLY FOR HOUSE LOANS ... 98
TABLE 60. PREFERRED CHANNEL FOR MORTGAGE/MORTGAGE REFINANCE SERVICE ... 99
TABLE 61. CHANNEL USED TO HANDLE TRANSFERS WITHIN THE SAME BANK ... 99
TABLE 62. CHANNEL USED TO HANDLE TRANSACTIONS WITH OTHER BANKS ... 100
TABLE 63. CHANNELS USED TO PAY MONTHLY BILLS ... 100
TABLE 64. CHANNEL USED FOR BALANCE INQUIRIES ... 101
TABLE 65. CHANNEL USED TO UPDATE ACCOUNT DETAILS ... 101
TABLE 66. CHANNEL USED TO INQUIRE ABOUT A BANK SERVICE ... 102
TABLE 67. CHANNEL USED TO HANDLE OR FILE COMPLAINTS ... 102
TABLE 68. CHANNEL USED TO APPLY FOR LOANS/CREDITS ... 103
TABLE 69. CHANNEL USED TO HANDLE TRANSACTION DISPUTES ... 103
TABLE 70. CHANNEL USED TO REPORT LOST/STOLEN DEBIT/CREDIT CARDS ... 104
TABLE 71. IMPORTANT FEATURES IN USING DFS ... 104
TABLE 72. ONE-SAMPLE KOLMOGOROV-SMIRNOV TEST FOR INDONESIA DATA ... 105
TABLE 73. ONE-SAMPLE KOLMOGOROV-SMIRNOV TEST FOR HUNGARY DATA ... 106
TABLE 74. SPSS RESULT OF DFS ON TOTAL REVENUE OF AGRICULTURE ENTERPRISES IN INDONESIA ... 107
TABLE 75. SPSS RESULT OF DFS ON TOTAL REVENUE OF AGRICULTURE ENTERPRISES IN HUNGARY ... 108
TABLE 76. SPSS RESULT OF DFS ON TOTAL VARIABLE COST OF AGRICULTURE ENTERPRISES IN INDONESIA ... 109 TABLE 77. SPSS RESULTS FOR DFS ON TOTAL VARIABLE COST OF AGRICULTURE ENTERPRISES IN HUNGARY ... 110 TABLE 78. SPSS RESULTS FOR DFS ON GROSS MARGIN OF AGRICULTURE ENTERPRISES IN
INDONESIA ... 111 TABLE 79. SPSS RESULTS FOR DFS ON GROSS MARGIN OF AGRICULTURE ENTERPRISES IN
HUNGARY ... 112 TABLE 80. SUMMARY OF THE QUESTIONNAIRE ANALYSIS ... 114 TABLE 81. SUMMARY OF ACCEPTANCE OF HYPOTHESES ... 119
LIST OF ABBREVIATIONS
ADB Asian Development Bank
APEC Asia-Pacific Economic Cooperation ARDA Agriculture and Rural Development Agency BPS Biro Pusat Statistik (Indonesian Statistical Bureau) CAP Common Agriculture Policy
CTA Centre technique de coopération agricole et rurale DAS Digital Agriculture Strategy
DFS Digital Financial Services
DGT Directorate General of Taxation (Indonesia)
G20 The G20 is an international forum, made up of 19 countries and the European Union, representing the world‘s major developed and emerging economies
GDP Gross Domestic Product GNP Gross National Product GVA Gross Value Added
HSCO Hungarian Central Statistical Office
IACS Integrated Administration and Control System ICA International Cooperative Alliance
IOF Investor-owned firms KSH Központi Statisztikai Hivatal NFP Not-for-profit organizations ROI Return on investment
VAT Value Added Tax
WEF World Economic Forum
WTO World Trade Organization
CHAPTER 1: INTRODUCTION
1.1. Background of the Research Topic
On a broader scale, businesses are always thinking about major industry shifts and new technologies that will affect the way that they operate in the years ahead. With developments in technological innovation, internet-powered tech companies and startups are challenging the biggest incumbent industries like hospitality, transport, and now agriculture. From a management standpoint, technological innovation, in the form of digital transformation, will certainly impact all business sectors. In the agriculture sector, digital transformation will affect aspects of yield, efficiency, and profitability. There is huge potential, and need, to help the agriculture industry find efficiencies, conserve valuable resources, meet global demands for protein, and ensure consumers have access to clean, safe, healthy food. To achieve this, technological innovation is inevitable. To keep the workforce and operations intact, revenues and profitability will certainly decrease.
According to a study from Price Waterhouse Coopers (2016), regarding agriculture enterprises and digital technology, digital technology will impact the industry ―on the farm‖, such as input technologies (encompassing all inputs such as fertilizers, pesticides, soil amendments, genetics, seeds, and feed); precision agriculture (including drones and robotics, big data, smart equipment and sensors, and farm management software); new production and new business models (indoor or controlled environment agriculture, cellular agriculture, input and asset sharing). Nowadays technologies are looking to disrupt the supply chain in the agriculture sector through traceability and packaging, processing technologies, waste-reducing technologies such as biotechnologies producing biomaterials from food and agricultural waste, farm-to- consumer distribution, e-grocers, and food nutrition transparency. These technologies are being applied globally across developed and emerging markets. As a supporting enterprise in the supply chain, agriculture enterprises are also subject to innovation to keep up with the changing trend. Changes in farm ownership are challenging the traditional dynamics between agriculture enterprises and farmer relationships. There is a trend of strategic acquisition of farmland and established farming operations by institutional investors. These stakeholders recognize the value of land scarcity and the investment opportunities that come with it. There is also a trend where younger farmers
are beginning to take over their family‘s farms. The younger generation of farmers are more technological-savvy and they looked from digital experiences in other industries to apply in the agriculture sector. Therefore, the farmers of the next generation may leave the long established traditional relationship for a breakthrough in digital agriculture. In the next decade, there will be retirement of much of the rural workforce in farms. As the older generation leaves the industry, they will depart with years of customer insights and agronomic expertise. The transfer of knowledge and client relationship may be difficult since the younger generation leaves the rural area for high paying jobs in urban areas.
The urbanization that is taking place will have an impact on the loss of human resources in the agriculture sector. However, digitalization might be a driving force to bring young talent back to the agriculture industry. Digitalization will become increasingly important in the future, and since the agriculture business involves largely daily transactions to maintain the food supply chain, then digital payments will become a trend in day-to-day operations.
A study from Centre Technique de Coopération Agricole et Rurale (CTA) in 2018 mentioned that agriculture plays a major role in the economy with numerous cash transactions taking place throughout the value chain. Digitalization should be able to answer the challenge by finding ways that can be economically and environmentally sustainable. Although the study from CTA focuses on the digitalization of agriculture in Africa, the Caribbean, and the Pacific, overall, digitalization could potentially increase productivity and profitability levels. As digital agriculture matures, agriculture retailers will continue their important role of servicing producers through interrelated farm technologies and crop input products. Often structured as enterprises, agriculture retailers serve as the middlemen between manufacturers and growers in the agriculture value chain.
According to Nadeau and Nadeau (2016), agriculture enterprises are owned and democratically controlled by their members. Enterprises are owned by producers, consumers, workers, business, and other organizations, and combinations of the above.
Also, according to the International Cooperative Alliance (ICA), unlike for-profit businesses, in which profitability is the primary measure of success, service to members is the priority of enterprises, but they also must maintain a level of profitability that allows them to operate sustainably over time. From a measurement perspective, the growth or decline of enterprises is problematic, because there is no worldwide, longitudinal data set encompassing the many different kinds of enterprises.
Throughout this research, the term ―agriculture enterprises‖ is used to describe business units engaged in the production of food and fiber, ranching, and raising of livestock, aquaculture, and all other farming and agricultural related industries, which also encompasses cooperatives. The use of the term ―agriculture enterprises‖ is to give a general idea about the structure of the business unit, as the term ―cooperatives‖ has a different meaning in Indonesia and Hungary, respectively.
The number of agriculture enterprises in the world is approaching 3 million, and the number of agriculture enterprise memberships is about 2 billion. By 2030, there would be more opportunities to create additional agriculture enterprise enterprises (ICA, 2018):
1. Improving the measurement of performance in agriculture enterprises
Without systematically measuring the number of agriculture enterprises and related variables over time, it is not possible to tell whether the agriculture enterprise movement is increasing or decreasing in size and sustainability. This lack of information creates a fundamental problem: how can we increase the role of enterprises in the world, if we do not know how many there are or what are they doing? Good data and analysis are prerequisites to good planning. Research on agriculture enterprises, including a periodic, global census, is necessary for effective planning their long-term growth.
2. Improving the legal and regulatory environment for agriculture enterprises.
The quality of agriculture enterprise laws, regulations and regulatory systems varies dramatically from one country to the next. All countries should have agriculture enterprise laws, regulations, and enforcement practices that are consistent with the seven agriculture enterprise principles.
3. Strengthening community-level, national and international support for enterprises.
4. Improving agriculture enterprise development and financial assistance.
5. Developing targeted strategies for agriculture enterprise sectors, countries, and job- creation opportunities.
The agriculture sector is commonly faced with problems such as production capacity and quality, access to markets, improved trading positions, and higher incomes.
Digitalization is a driving force for agriculture enterprises to keep up with the changing trend. Digital financial services (DFS) hold an enormous opportunity for financial inclusion and expansion of basic services. Financial services can help development through facilitating transactions, investments, and managing accounts. When provided with appropriate DFS products and access to well-designed networks, agriculture
enterprises will benefit from improvements in income, financial management, and economic resilience. DFS will become increasingly important and widespread, since in the future, digitalization will take over some parts of daily operations of businesses, including agriculture.
1.2. Digitalization in the Agriculture Sector
Agriculture is an ancient occupation that has long been practiced by a significant portion of the population. At that time it used simple, basic technological solutions and even included the primary processing of food. It is only in recent centuries that it has become a complex system of many vertical stages. Today we are talking about agro- industry and agribusiness, which involves a whole value chain process. Its development can be characterized by the same characteristics as those of any industry. Digitalization has thus also become a key driver of its development.
Source: Own figure based on KPMG (2013)
Figure 1. Agriculture and Food Value Chain
Input companies
Farmers
Trade
Food companies Retailers
Consumers
Seeds
Fertilizers
Crop protection
Animal health &
nutrition
Crop insurance
Food ingredients
Crops
Meat
Dairy
Others*
Crops
Meat
Oil/meals
Biofuels
Bakery
Meat
Dairy
Snacks
Beverage s
Hypermarkets
Supermarket
Corner shops
Urban
Rural
*Others include activities such as:
- Producing fibers for industrial use - Energy
- Environment sustainability
Although individual crops and regions may vary, in general the agricultural value chain contains the following steps (Fig.1). At each link in this value chain, there is a transfer: of crops, labor, information, or money. Food is a physical commodity produced with varying degrees of human labor, and so transfers of physical crops and labor cannot be wholly digitized to a certain extent. Some agricultural information (weather, prices, basic agronomy) can be delivered digitally and is frequently in short supply, while other information (soil quality, best practices) is in equally high demand, yet may require a physical presence.
The agricultural industry recognizes that digital technology is a key issue, offering significant value-creation opportunities. There are five major issues that will transform the enterprises‘ environment over the next 30 years: demographics, emerging countries, urbanization, the environment and technology. The use of mobility, data analysis, and connected device technologies is seen as a way to optimize processes and harness added value, particularly for members.
Although they have already deployed practical initiatives based on digital technologies, agricultural enterprises see today as a turning point. The extensive business ecosystem of agricultural enterprises (members, customers, suppliers, other enterprises, etc.) has encouraged them to be among the first to adopt the digitization of information exchanges with their different partners, particularly members. More than half of the enterprises have also introduced, or are considering, collaborative working initiatives.
These enterprises also use digital technology to optimize production, supply-chain, maintenance and traceability processes, mainly through the effective use of data.
Aside from the issues related to target value chains and technologies, the main challenges encountered revolve around the human factor. Agricultural enterprises should strengthen their teams to acquire the skills necessary for this transformation and have rolled out cross-functional and collaborative working methods that increase agility.
Numerous partnerships with suppliers, universities and other enterprises have been put in place to pool resources and reduce costs.
Agriculture enterprises serve both the customer end and the supplier end of the value chain, from crop planning to harvest, until the final customers. The existing agriculture should be able to adapt with the change. The interconnectivity in the value chain will relieve many stresses that usually occur in product pricing, financing and credit services.
Real-time inventory may be one way to set product pricing adjusted to the supply and demand of real-time orders and inventory changes. It creates the opportunity for growers
and farmers to be more proactive in planning. By providing digital platforms for sales, operations, and customers to view local inventory levels and place online orders will be helpful to reduce inefficiencies in paperwork, such as the use of carbon-copy forms for sales and inventory management. Alternately, agriculture enterprises can also focus on farm credit financing and crop insurance. Enterprises can help how farmers can use data to manage operations in the field, provide access to operating credit during down economies and better crop insurance premiums.
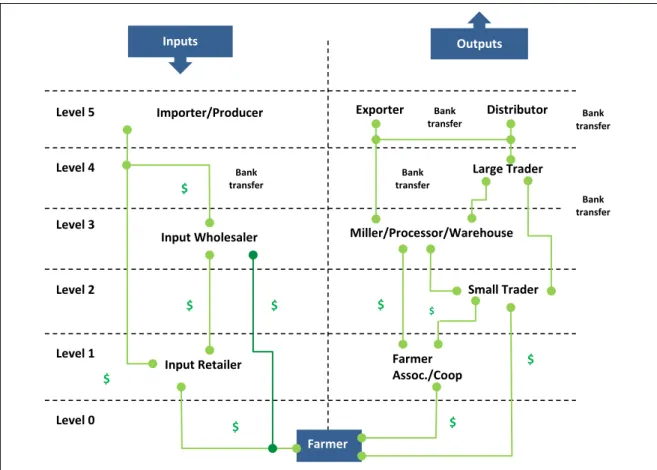
Source: Own figure based on Digital Financial Services for Agriculture, World Bank (2017).
Figure 2. Illustrative DFS Needs at Different Agri-Value Chain Level
Fig.2 illustrates the drivers shaping the need of DFS: revenue generation, transaction relationships, formal financial services usage, and information access/digital technology.
The use of digital technologies in the agriculture value chain has the potential to address some of the problems faced by farmers, among them the lack of transparency in the value chain and operational inefficiencies that lead to higher costs. In practice, most of the daily transactions occurred in the agriculture value chain are cash-based. According to the Global Findex report (2017), about 15% of adults in developing economies have reported that they received payments for the sale of agricultural products in cash. For most low-
Inputs Outputs
Level 5
Level 4
Level 3
Level 2
Level 1
Level 0
Farmer
Input Retailer Farmer
Assoc./Coop
Small Trader Miller/Processor/Warehouse Input Wholesaler
Large Trader
Importer/Producer Exporter Distributor
$
Bank transfer
$
$ $
$
$
Bank transfer
Bank transfer
Bank transfer
Bank transfer
$
$
$
and middle-income countries, 95% of those receiving agricultural payments were paid in cash. Even the least cash-heavy agricultural sectors still show 75% of transactions in cash.
Although still commonly used daily in the agriculture sector, cash has the following downsides as pointed out (Global Findex, 2017):
a. It is expensive. Making payments, transferring money, and withdrawing cash all require travel which brings its own costs, and/or fees.
b. It is insecure. Cash can be stolen, leaving the carrier with no recourse.
c. It is opaque. When cash changes hands there is often no record of the transaction, making cash transactions a means of potential misappropriation.
d. It is slow. As a physical commodity that can move no faster than the humans transporting it, cash payments take days or weeks to be executed.
Overall, the longer the transfer of cash takes, the more expensive, time-consuming, and insecure that process becomes. Differences of language, culture, and gender can make transactions more complex and expensive. Compounding these inefficiencies, agricultural workers count on multiple payment streams (input purchases, transport, crop sales, credit, etc.) for their entire livelihood, which multiplies the challenges faced in the sector.
The G20 is an international forum, established in 1999, consists of 19 countries and the European Union, representing the world‘s major developed and emerging economies.
Together, the G20 members represent 85 % of global GDP, 75% of international trade and two-thirds of the world‘s population. The member countries are: Argentina, Australia, Brazil, Canada, China, France, Germany, India, Indonesia, Italy, Japan Mexico, Russia, Saudi Arabia, South Africa, South Korea, Turkey, the United Kingdom, the United States, and the European Union. The G20 GPFI report (2015) about new trends in agricultureal finance, mentioned some potential research areas in the finance part. These five key research areas are: (1) understanding demand for smallholder households, (2) digital financial services, (3) financing for women in the agricultural sector, (4) value chain finance, and (5) agricultural insurance.
In relation with the new trends in agriculture finance, this research focuses on the use of digital financial services on the profitability of agriculture enterprises. The scope is limited to a comparison in two countries, Hungary and Indonesia. The reason for the choice of these two countries is Hungary, as an example where the agriculture sector is saturated, and Indonesia, as an example where the agriculture sector is progressing in terms of development. Not much information is known on the extent of digital financial
services adopted in both countries, notably in the agriculture sector. Due to the differences in the way agriculture and agriculture enterprises are developed in Hungary and Indonesia, the outcome may be different in many ways.
1.2.1 Overview of the Indonesian Agriculture Sector
Indonesia, a large archipelago nation of more than 17,000 islands with a population of 262 million, is on its way to become the largest economy in Southeast Asia. The country‘s gross national income per capita rose steadily from US$2,642 in 2007 to US$3,932 in 2017. With an average annual GDP growth of 5–6%, Indonesia has become the largest economy in Southeast Asia during the past decade.The poverty rate has been cut to more than half within two decades, leaving around 11% of the population still living below the national poverty line (World Bank, 2019). Today, Indonesia is the world‘s fourth most populous nation and the world‘s tenth largest economy in terms of purchasing power parity, and a member of the G-20 (World Bank, 2019). Digital technology is fast becoming the core of life, work, culture and identity. Yet, while the number of Indonesians using the internet has followed the upward global trend, some groups — the poor, the elderly, women, the less well- educated, people living in remote communities — are disadvantaged.
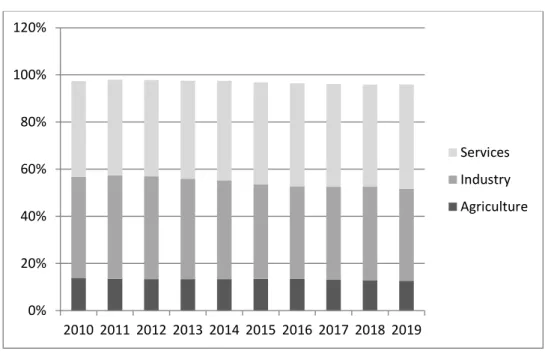
Source: Statista, 2020
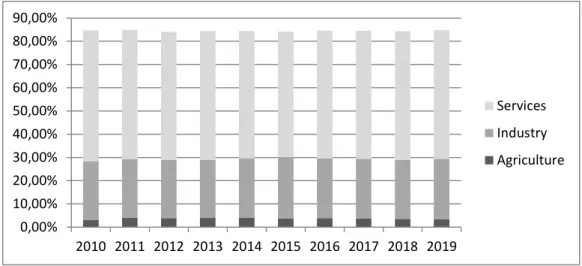
Figure 3. Share of Economic Sectors in Indonesia’s GDP from 2010 to 2019
0%
20%
40%
60%
80%
100%
120%
2010 2011 2012 2013 2014 2015 2016 2017 2018 2019
Services Industry Agriculture
Fig. 3 shows the share of economic sectors in the gross domestic product (GDP) in Indonesia from 2010 to 2019. In 2019, the share of agriculture in Indonesia's gross domestic product was around 12.72%, industry contributed approximately 38.95%
and the services sector contributed about 44.23%. Indonesia is a leading producer of palm oil and a global producer of rubber, copra, cocoa and coffee. It is also the second marine fisheries producer in the world, after China. Large plantations cultivate export crops on about 15% of the total agricultural area, but the majority of farmers (68%) are smallholders operating on less than 1 hectare despite the fact that three out of five Indonesians live in rural areas with farming as their main occupation (IFAD, 2016). In contrast, Indonesia is also a net importer of grains, horticulture and livestock produce (ADB, 2015). The country‘s diverse landscape supports the agriculture sector to make a considerable contribution to the economy. Table 1 presents the number of farm holdings and farm sizes in Indonesia.
Table 1. Number of Farm Holdings and Farm Size, Indonesia Smaller farm Other farm National
Average farm size (ha) 0.56 5.01 0.92
Minimum farm size (ha) 0 1.02 0
Maximum farm size (ha) 1.02 6.88 6.88
Total number of holdings 2,721,963 752,903 3,474,866 Source: FAO, 2018.
The nation‘s total land area used for agricultural production has increased over the last decades and is now equivalent to 32% of the total land area. Although its share of GDP is decreasing, agriculture is still of crucial importance for Indonesia‘s economy, accounting for 12.72% of GDP. Moreover, the sector is the second biggest source of employment, in particular in the country‘s rural areas, with around 33% of Indonesia‘s labor force being employed in the agricultural sector. Rice is the primary staple food crop with a steady increase in annual production, making Indonesia the third largest rice producer in the world. Despite the gradual increase of food crop production, the country remains a net importer of grains (mainly wheat) and other agriculture produce, such as horticulture. Indonesia‘s total number of farmers are small family farms (93%). They dominate the sector and grow the bulk of staples, including rice, corn and cassava, as well as of cash crops, under which palm oil and rubber are the main export crops (FAO, 2018).
During the administration of President Joko Widodo, now serving his second term, business-friendly initiatives have been applied to attract investment in the agriculture sector, answering issues such as decreasing crop yields, limited access to capital, and outdated infrastructure. The development plan for agriculture includes targets for food security and farmers empowerment, including food sovereignty in four commodities: rice, sugar, corn and soybeans. Although the president‘s policies have addressed some of these challenges by expanding the total area of farming and revitalizing the infrastructure, there are still issues that require attention, mainly within the agriculture value chain. The progress has been slowed down by an underdeveloped downstream segment, and the inability of smallholder farmers to acquire the market demand, both nationally and internationally.
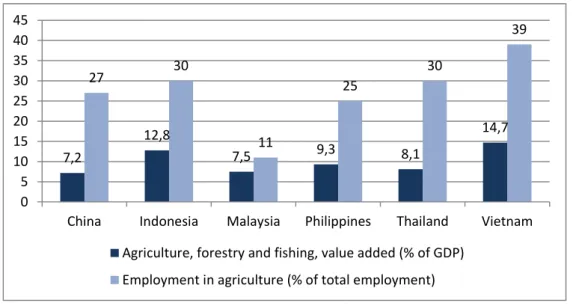
Source: World Bank, 2018
Figure 4. Agriculture, Forestry and Fishing to GDP and Employment in Agriculture in Selected APEC Countries (in percent), 2018
Fig. 4 below represents Indonesia‘s position among selected countries in the APEC. APEC is the Asia-Pacific Economic Cooperation, with member countries:
Australia, Brunei Darussalam, Canada, Chile, China, Hong Kong, Indonesia, Japan, Republic of Korea, Malaysia, Mexico, New Zealand, Papua New Guinea, Peru, Philippines, Russia, Singapore, Taiwan, Thailand, United States and Vietnam. The APEC Minister …
Despite the contribution of agriculture to the economy and policies made to help boost the sector, it has not been able to achieve the potential farm produce mainly due to socio-economic factors, such as education and income, which would optimize the
7,2
12,8
7,5 9,3 8,1
14,7
27 30
11
25
30
39
0 5 10 15 20 25 30 35 40 45
China Indonesia Malaysia Philippines Thailand Vietnam Agriculture, forestry and fishing, value added (% of GDP)
Employment in agriculture (% of total employment)
farm production. In the sector of agriculture, forestry and fishing, based on selected APEC countries, Indonesia is in second place after Vietnam, meaning that there is still a huge opportunity for development, given the huge size of the population.
In terms of structure, Indonesia‘s agricultural sector consists of two types of production: large-scale plantations under the guidance of the government or private investors, and smallholders using traditional farming methods. The latter tend to focus on horticultural commodities, while large plantations dominate leading exports such as palm oil, although a recent shift has seen smallholders increasingly account for a dominant share in other exports such as rubber.
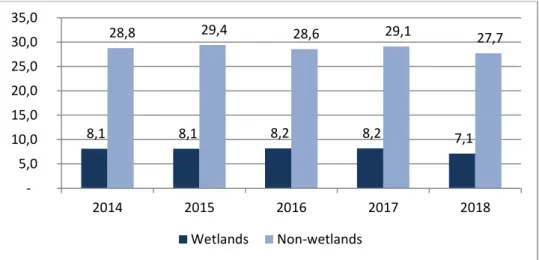
The agricultural land in Indonesia is divided into 2 categories: wetland and non- wetland area. Wetland is the land or area for planting rice, which is divided again into sub-categories: irrigated wetland, non-irrigated wetland, dry field/garden, shifting cultivation and temporarily unused land. The non-wetland category is the land or area used to cultivate other kinds of plants (other crops, palm oil, horticulture, fruit, etc) other than rice.
Source: Statistics of Agricultural Land, Indonesia, 2018
Figure 5. The Growth of Agricultural Land Area in Indonesia (in millions of hectares) Fig. 5 shows that there is a decline in the use of the agricultural area, both for wetlands and non-wetlands. Indonesia‘s agriculture sector is made of four sub-sectors:
cash crops, food crops, horticulture crops and livestock (BPS, 2018). Indonesia is one of the world‘s largest producers and exporters of cash crops such as palm oil, rubber, coconut, cocoa and coffee. These high-value crops dominate the agriculture landscape with 96.3% of the total value of Indonesia‘s agriculture commodity exports coming from cash crops with an export value of $31,815 million (Indonesia Agriculture
8,1 8,1 8,2 8,2 7,1 28,8 29,4 28,6 29,1 27,7
- 5,0 10,0 15,0 20,0 25,0 30,0 35,0
2014 2015 2016 2017 2018
Wetlands Non-wetlands
Statistics, 2018). Major food crops, ranked by export value, are rice, wheat, soybean, mung bean and peanuts. Horticultural crops include vegetabes (e.g. chili, shallot, cabbage, potato), fruits (e.g. pineapple, banana, mangosteen, mango), ornamental plants (e.g. orchid) and medicinal plants (e.g. ginger, turmeric).
About 31 million hectares in Indonesia are under cultivation, with about 40% of the cultivated land producing export crops. Approximately 60% of the country's cultivated land is located just in the heavily populated Java Island. Large plantations (large, privately-owned estates) cultivate export crops on about 15% of the total agriculture area, but the majority of traditional farming (68%) of both food and export crops are operating on small plots of about 0.8 to one hectare size.
1.2.2 Digitalization in Indonesian Agriculture
The digital environment in Indonesia is summarized below (Fig. 6). In addition to the overall figures, data presented in fig. 6 further explains that from a population of 268.2 million, the urbanization level is 56%, so there are more people living in cities compared to those living in rural areas. Also, mobile subscriptions are 133%
compared to the total population (355.5 million vs. 268.2 million), which indicates that one person may have more than one mobile subscription, or may own several separate subscriptions for different purposes. Internet users are high, more than half of the population, which is 150 million or 56% of the total population, with 56% of active social media users and 48% of mobile social media users.
Source:Modified fromhttps://datareportal.com/reports/digital-2019-indonesia
Figure 6. Digital Landscape in Indonesia, 2019 (in percent)
56,0
133,0 56,0
56,0 48,0
0,0 20,0 40,0 60,0 80,0 100,0 120,0 140,0 Urbanization level
Mobile subscriptions Internet users Active social media users Mobile social media users
Economy-specific findings for Indonesia are made great progress, almost doubling its financial inclusion rate, from 19.6% of adults having an account to 36.1%, injust three years. However, around one-third of the population work in agriculture in some way, and of this cohort, 81% lived below the poverty line in 2015.
The digitalization of Indonesia‘s rice subsidy, and a wide-scale pilot of a single social payments instrument, currently underway, have the capacity to substantially expand the digital payments ecosystem for the rural poor and drive further gains in financial inclusion. Digitalization of agricultural payments in the palm oil industry – valued around US$2.8 billion – is also gathering momentum, with significant benefits expected to flow to rural communities. Farmer associations (equivalent to agriculture enterprises) and aggregators are interested in digitizing payments. By working through farmer associations in the palm oil and cocoa sectors, payment providers can begin the development of a digital ecosystem at the association level, and use existing information services to educate farmers about the time and cost savings of digitalization.
1.2.3 Overview of the Hungarian Agriculture Sector
Hungary has an area of 93,024 km2 of which 57% is agriculture land, while forests cover 21%. Hungary has a population of nearly 10 million, of which more than 4.5 million (or 46.7%) live in predominantly rural areas. Hungary has a farming sector characterized by small farms, in which nearly 85% of the roughly 500,000 farms have less than 5 ha. In addition, it is also characterized by a rather atypical agricultural sector with a very high share of arable farming (81% of agricultural land and low grassland (14.2%).
According the latest national statistics (HCSO, 2017), there were 9,000 agricultural enterprises and 416,000 agricultural holdings engaged in agriculture in 2016. However, many of the agricultural holdings were subsistence or non- subsistence farmers cultivating agricultural areas less than 1 hectare (Szerletics, 2018). Due to the new Land Transaction Act in force in 2014, only active farmers (and their family members) living in Hungary and obtaining at least a secondary agricultural and/or forestry qualification can buy land up to 300 hectares (except for livestock farms and seed producers where the limit is 1,800 hectares). Furthermore, in the new Land Transaction Act, preemption rights are provided for the Hungarian State, the farmer using the land, the neighboring farmers, local farmers and farmers
living within 20 km distance. All of the above creates high administrative burdens and strong state control for local land markets. In terms of land use regulations, Hungarian land policy favors family farms instead of large farms. Overall, land regulations together with degressivity are responsible for the splitting up of large farms. Fig. 7 shows the share of economic sectors in gross domestic product (GDP) in Hungary from 2010 to 2019. In 2019, the share of agriculture in Hungary's gross domestic product (GDP) was 3.47%, industry contributed approximately 25.98% and the services sector contributed about 55.29%.
Source: Statista, 2020
Figure 7. Share of Economic Factors in Hungary’s GDP from 2010 to 2019
Source: Eurostat, 2017
Figure 8. Hungary: Farms and Farmland by Farm Size, 2016 (in standard output)
0,00%
10,00%
20,00%
30,00%
40,00%
50,00%
60,00%
70,00%
80,00%
90,00%
2010 2011 2012 2013 2014 2015 2016 2017 2018 2019
Services Industry Agriculture
0 10 20 30 40 50 60 70 80 90
Very small farms Medium size farms Large farms Farms Farmland
Data from Eurostat (2017) backed up the evidence of farms and farmland by comparing small size, medium and large farms in Hungary. From fig.8, it can be seen that very small farms has more farms than farmland in contrast to large farms which have more farmland and less farms. The largest share of the total agriculture output in Hungary in 2018 was represented by cereals (27%), live animals (24%), industrial crops (13%), and animal products (11%). The share of total crop production was 58%
and 35% for animal and animal products (HCSO, 2018).
Source: World Bank, 2018
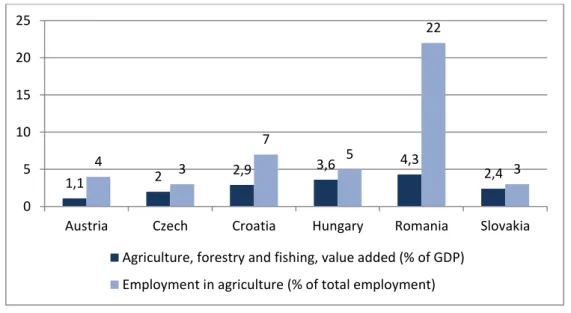
Figure 9. Agriculture, Forestry and Fishing to GDP and Employment in Agriculture in Hungary and Its Neighboring Countries (in percent), 2018
In addition, fig. 9 represents Hungary‘s agriculture position among its neighboring countries (Austria, Czech Republic, Croatia, Romania and Slovakia Republic), in which Hungary came in second position (3.6%) after Romania (4.3%) in terms of the agriculture sector‘s contribution to GDP, and in third position (5%) after Romania (22%) and Croatia (7%) in terms of employment in agriculture compared to the total employment.
Table 2 shows that in Hungary, most of the farm areas fall in the category of 0 to 3 hectares (32%, in 2016) as opposed to areas with more than 1,200 hectares (0.15%, in 2016). Although most farm size categories remain stable with a slight increase of decrease, the most significant change is in 2014-2015, where there is an increase in the category of 600 to 1,200 hectares of farm area.
1,1 2 2,9 3,6 4,3
4 3 2,4
7
5
22
3 0
5 10 15 20 25
Austria Czech Croatia Hungary Romania Slovakia
Agriculture, forestry and fishing, value added (% of GDP) Employment in agriculture (% of total employment)
Table 2. Number of Farms by Physical Size Categories in Hungary, 2012-2016
Farm size (UAA) 2012 2013 2014 2015 2016
0-3 ha 58,546 59,732 60,143 55,373 54,922
3.01 -5.00 ha 25,448 25,653 25,280 25,698 25,456
5.01 – 10.00 ha 32,214 32,433 32,134 33,808 33,863
10.01 – 25.00 ha 30,465 30,280 30,195 28,961 28,572
25.01 – 50.00 ha 12,997 13,032 13,024 13,035 13,044
50.01 – 100.00 ha 7,689 7,761 7,792 8,170 8,308
100.01 – 300.00 ha 6,509 6,574 6,669 6,979 7,154
300.01 – 600.00 ha 981 982 1,067 1,231 1,227
600.01 – 1,200.00 ha 556 566 565 701 773
>1,200.01 ha 477 443 439 323 259
Total 175,882 177,456 177,308 174,279 173,578
Source: Szerletics, 2018
The Common Agricultural Policy (CAP) is implied by the European Union to provide a decent standard of living for farmers and agricultural workers, in addition to provide a stable, varied food supply for its 500 million citizens. As a common policy for all 27 EU countries (Brexit taken into account), the CAP strengthens the competitiveness and sustainability of EU agriculture by providing Direct Payments aimed at stabilizing farm revenues and finances projects responding to country- specific needs through national (or regional) Rural Development Programmes. The impact of CAP also influenced the structural changes of agricultural holdings.
According to EC (2015), there were 11 million farms cultivating 172 million hectares of agricultural land with 22 million people in European agriculture in 2015. The European Commission or EC (2013) suggests that the number of farms has been declining since 1975 and those remaining have become bigger both in terms of agricultural area and also in economic terms.
According to the latest figures published by the HCSO (2019), capital expenditures in agriculture expanded by 8.3% at unchanged prices in 2018. Farmers spent HUF 347.7 billion (EUR 1.1bn) on development projects in 2018, HUF 43.6 billion (EUR 138 million) more (at current prices) than in 2017. The share of agriculture from capital expenditures within the national economy was 4.1%. Overall, the sector-level profitability of agriculture improved by 3% in 2018. The support schemes included in the Rural Development Program made a considerable contribution to the increased CAPEX. Specifically, farmers received HUF 12.5 billion
for the modernization of animal farms, HUF 15.3 billion for horticultural development, HUF 11.0 billion for value-added agricultural products, and HUF 3.7 billion for wine production. In addition to the above, the following factors also contributed to the increase in capital expenditures: income-supplementing agricultural subsidies, a stable financial background guaranteed by a sound risk management system, the growing profitability of agricultural production, and low loan interest rates.
1.2.4 Digitalization in Hungarian Agriculture
Hungary‘s digital environment can be summarized in fig. 10 below for a general overview, with percentages in main points such as total population, mobile subscriptions, internet users, active social media users, and mobile social media users.
Source: Modified from https://datareportal.com/reports/digital-2019-hungary
Figure 10. Hungary’s Digital Landscape, 2019 (in percent)
In addition to the overall figures, data presented in fig. 10 further explains that from a population of 9.67 million, the urbanization level is 72%, so there are more people living in cities compared to those living in rural areas. Also, mobile subscriptions are 117%, compared to the total population (11.34 million vs. 9.67 million), which indicates one person has more than one mobile subscription, or owns several separate subscriptions for different purposes. Internet users are high, which is 8.59 million, or 89% of the total population, with 62% of active social media users and 55% of mobile social media users.
72,0
117,0 89,0
62,0 55,0
0,0 20,0 40,0 60,0 80,0 100,0 120,0 140,0 Urbanization level
Mobile subscriptions Internet users Active social media users Mobile social media users
Hungary was one of the first countries to establish a national Digital Agriculture Strategy. According to Takácsné et al., (2018), the application of precision agriculture (PA) as a technology breakthrough confirmed increasing yields and has profitability benefits compared to conventional farming. Consequently, this study about the impact of DFS on the profitability of agriculture enterprises is associated within the DAS itself to assist the work of farmers and larger companies to apply DFS technology and simultaneously, increase efficiency.
1.3 Research Objectives
The background of the study in the previous sections explained on how technology developments could help improve the agriculture sector in both Indonesia and Hungary.
Besides the differences on how the agriculture sector works in Indonesia and Hungary, a comparison of the digital landscape between Indonesia and Hungary could tell on how the development of agriculture and internet evolves in each country. However, the comparison is not absolute, since in many aspects both countries are different e.g. country size, population size and internet coverage, but it is useful as a starting point to discover some ideas on how DFS could be developed and applied in Indonesia based on Hungary‘s example, or vice versa.
Previously, this research wanted to make agriculture cooperatives as the basis of comparison between Indonesia and Hungary. However, the situation in the agriculture sector in Hungary changed, so it is not appropriate to fully use agriculture cooperatives as the object of the study. Instead, the term ―agriculture enterprises‖ are used in the study as it covers all types of business models in the agriculture sector, including cooperatives.
The research objective renews a theme on which some previous research had been undertaken with the aim of understanding the determinants of DFS and the application in enterprises. In this context, this research aims:
(1) To find out about the factors that affect the application of DFS in agriculture enterprises, and
(2) To find out whether the application of DFS, given the digital and agriculture landscape in Hungary and Indonesia, including recent agriculture strategies, could have an impact on the profitability of agriculture enterprises.
1.4 Research Gap
Based on the preliminary findings in many literature and news from the agriculture sector, there is a common ground when discussing about the agriculture sector and DFS.
Even though in a global scale there is a significant overall progress in financial, technical and economic resources to boost the use of digital financial services in everyday life, there are still challenges that need to be answered in order to keep up with recent developments in finance. Agriculture enterprises are often the most neglected part of the agriculture sector, but in both developed and developing countries, agriculture enterprises exist in the agriculture value chain to assist farmers to link with the downstream and upstream flow. DFS in agriculture enterprises could have a more significant role in order to increase the profitability of the enterprises as a whole, while at the same time help facilitate the flow of cash among farmers who are the members of the agriculture enterprise. In most developing countries, still there is a lack of investment from financial institutions or financial providers to provide the access to financial services, resulting in low agriculture productivity and efficiency, which leads to low incomes and high losses. As there are no previous studies comparing on how digital financial services could affect the profitability of agriculture enterprises in a developed country (Hungary) in contrast to a developing country (Indonesia), this study is intended to fill in the research gap.
1.5 Planning of the Research
The planning of the research will be divided into five steps:
1. The research will use both primary data and secondary data. The first step is to provide a background to build the survey questions. This is important as the survey needs to be conducted ahead of time.
2. Building a questionnaire for the survey which will be distributed to stakeholders of agriculture enterprises in Indonesia and Hungary. The questionnaire will be divided into 3 parts: demographics, agriculture sector, and DFS.
3. The literature review to provide the scientific background in conducting the research.
4. Based on the literature review, the methodology, including the research objectives, research questions, and hypotheses will be constructed. From this step, what type of secondary data needed are summarized to relate to the hypotheses.
5. The analysis of the survey results and the hypotheses, including limitations and new scientific contribution.
6. The conclusion and recommendation, including practical implications.
1.6 Possible Constraints
There may be possible constraints when undertaking this study. Table 3 summarizes the issues that may come up during the research process. However, for each constraint, there are alternative solutions that could help overcome the difficulties faced in the research process.
Table 3. List of Possible Constraints
No List of possible constraints What can we do about it?
1 Language constraints in interviews or preparing questionnaires
Use help for questionnaire translation and interviews to avoid misunderstanding or miscommunication; needs special attention.
2 Unable to obtain the data needed for the research
Depends on whether the agriculture enterprises are open about their activities and their innovation so far. This part should be focused in specific areas.
3 Availability of secondary data Statistics for agriculture enterprises in Europe are updated while it is not the case for Indonesia. However, a compromise could be made by using the last 5 years of time series data from national databases and from the World Bank data.
4 Unwillingness of the agriculture agriculture enterprise to participate
Depends on the cooperation of the members of the agriculture enterprise are able to assist in obtaining data.
5 Technical aspects of the agriculture enterprise management
Depends whether the agriculture enterprises are open with their financial statements and/or financial aspects in running the business .It needs routine control.
6 Time The time limit is the constraint; however the
research project must be fulfilled. There is a consequence of not being able to graduate on time.
7 Budget The budget is also a concern regarding the
research will be done in 2 countries as a comparison study. The travelling budget makes up most of the costs.
8 Reality in the field vs. expected outcome Any change between reality in the field and the expected outcome has to be treated with a sense of urgency or mitigation plan.
Source: Researcher’s own construction