Genome-wide mapping of binding sites of the transposase-derived SETMAR protein in the human genome
Márton Miskei
a, Adrienn Horváth
a, Lívia Viola
a, Laura Varga
a, Éva Nagy
a, Orsolya Feró
a, Zsolt Karányi
a,c, Jason Roszik
d, Csaba Miskey
e,⇑, Zoltán Ivics
e,⇑, Lóránt Székvölgyi
a,b,⇑aMTA-DE Momentum Genome Architecture and Recombination Research Group, Department of Biochemistry and Molecular Biology, Faculty of Medicine, University of Debrecen, Hungary
bFaculty of Pharmacy, University of Debrecen, Hungary
cDepartment of Internal Medicine, Faculty of Medicine, University of Debrecen, Hungary
dDepartment of Melanoma Medical Oncology, Division of Cancer Medicine, MD Anderson Cancer Centre, University of Texas, USA
eDivision of Medical Biotechnology, Paul Ehrlich Institute, Langen D-63225, Germany
a r t i c l e i n f o
Article history:
Received 1 April 2021
Received in revised form 12 July 2021 Accepted 12 July 2021
Available online 14 July 2021
Keywords:
SETMAR/Metnase Transposase
Histone methyltransferase ChIP-seq
a b s t r a c t
Throughout evolution, DNA transposons provide a recurrent supply of genetic information to give rise to novel gene functions by fusion of their transposase domain to various domains of host-encoded proteins.
One of these ‘‘domesticated”, transposase-derived factors is SETMAR/Metnase which is a naturally occurring fusion protein that consists of a histone-lysine methyltransferase domain and an HsMar1 transposase. To elucidate the biological role of SETMAR, it is crucial to identify genomic targets to which SETMAR specifically binds and link these sites to the regulation of gene expression. Herein, we mapped the genomic landscape of SETMAR binding in a near-haploid human leukemia cell line (HAP1) in order to identify on-target and off-target binding sites at high resolution and to elucidate their role in terms of gene expression. Our analysis revealed a perfect correlation between SETMAR and inverted terminal repeats (ITRs) of HsMar1 transposon remnants, which are considered as natural target sites for SETMAR binding. However, we did not detect any untargeted events at non-ITR sequences, calling into question previously proposed off-target binding sites. We identified sequence fidelity of the ITR motif as a key factor for determining the binding affinity of SETMAR for chromosomes, as higher conservation of ITR sequences resulted in increased affinity for chromatin and stronger repression of SETMAR-bound gene loci. These associations highlight how SETMAR’s chromatin binding fine-tune gene regulatory net- works in human tumour cells.
Ó2021 The Author(s). Published by Elsevier B.V. on behalf of Research Network of Computational and Structural Biotechnology. This is an open access article under the CC BY license (http://creativecommons.
org/licenses/by/4.0/).
1. Introduction
Transposons of themarinerfamily are present in a wide variety of eukaryotic genomes, including humans[1–3]. These transposons contain a single gene encoding the transposase, flanked by short,
<30-bp inverted terminal repeat (ITR) sequences.Marinerelements mobilize through a cut-and-paste mechanism catalyzed by the transposase, which belongs to a large family of recombinase pro- teins including retroviral/retrotransposon integrases and trans- posases, characterized by the DDE/D signature in the catalytic
domain of the proteins[2,3]. Transposition results in the accumu- lation of hundreds or thousands of transposon copies over evolu- tionary time. However, most mariner copies appear to be dead remnants of once active transposons inactivated by mutations[4].
Mariner elements are represented by two subfamilies in the human genome:Hsmar1[5]andHsmar2[6]. The firstHsmar1ele- ment entered the primate genome lineage approximately 50 mil- lion years (Myr) ago, and transposition was ongoing until at least 37 Myr ago, producing 114 ‘‘full-length” Hsmar1 copies [5]
(Fig. 1. However, none of the present copies encodes a functional transposase protein due to mutational inactivation. The Hsmar1 transposon copies are accompanied by 42 ‘‘gappy”Hsmar1 ele- ments containing internal deletions in their transposase coding sequences, 5252 copies of solo-ITRs (containing a single ITR) and 2679 copies of an Hsmar1-related, paired-ITR element, MADE1
https://doi.org/10.1016/j.csbj.2021.07.010
2001-0370/Ó2021 The Author(s). Published by Elsevier B.V. on behalf of Research Network of Computational and Structural Biotechnology.
This is an open access article under the CC BY license (http://creativecommons.org/licenses/by/4.0/).
⇑Corresponding authors at: MTA-DE Momentum Genome Architecture and Recombination Research Group, Department of Biochemistry and Molecular Biology, Faculty of Medicine, University of Debrecen, Hungary (L. Székvölgyi).
E-mail addresses: Csaba.Miskey@pei.de (C. Miskey), Zoltan.Ivics@pei.de (Z. Ivics),lorantsz@med.unideb.hu(L. Székvölgyi).
j o u r n a l h o m e p a g e : w w w . e l s e v i e r . c o m / l o c a t e / c s b j
[5,7] (Fig. 1). Such miniature inverted-repeat transposable ele- ments (MITEs) are thought to have been generated by internal deletions of longer transposons (median MADE1 length: 68 bp, Fig. 1); they make up the predominant fraction of DNA elements in flowering plants, and are often found in animal genomes[8].
Despite their parasitic nature, there is increasing evidence that transposable elements are a powerful force in gene evolution.
Indeed, about 50 human genes are derived from transposable ele- ments [7], among them genes that are responsible for immunoglobulin gene recombination in all vertebrates [9]. One of these ‘‘domesticated”, transposase-derived genes is SETMAR (also called Metnase), a fusion gene containing an N-terminal SET domain fused in-frame to anHsmar1transposase[5,10]. The SET- MAR gene has apparently been under selection; the transposase open reading frame is conserved, and shows only 2.4% divergence from a consensusHsmar1transposase gene sequence (vs. 8% aver- age divergence between Hsmar1transposase genes)[5]. The SET domain can be found in histone methyltransferases that regulate gene expression by chromatin modifications [11]. Accordingly, the SETMAR protein has been shown to methylate histone H3 lysi- nes 4 and 36in vitro, and has been proposed to play a role in DNA double-strand break (DSB) repair[12].
The cellular function(s) of SETMAR remain enigmatic. Cordaux et al. have found that selection has been preserving the ITR- binding activity of SETMAR[10]. Accordingly, both the transposase domain of SETMAR as well as the full-length SETMAR protein were shown to bind toHsmar1ITR sequencesin vitro[10]. Thus, a func- tion of the SETMAR protein is likely associated with its ability to specifically recognize numerous genomic binding sites represented by theHsmar1ITRs. Through its ability to bind toHsmar1trans- poson ITR sequences, and to catalyze specific histone modifications [12], SETMAR could contribute to transcriptional gene regulation by inducing targeted chromatin modifications. Indeed, mariner transposase domains were recently described to have a propensity to undergo domestication by recurrent fusion to host transcrip- tional regulatory domains, especially the Krüppel-associated box (KRAB) domain; these KRAB-transposase fusion proteins repress gene expression in a sequence-specific fashion[13].
SETMAR is broadly expressed in human tissues (Supplementary Fig. S1) and cell lines (Supplementary Fig. S2), suggesting a
housekeeping function [12]. In addition, transcriptional variants of SETMAR show a broad expression pattern in human diseases including cancer[14–16]. Overexpression of SETMAR is favourable in kidney cancer and unfavourable in liver cancer, while most TCGA cancers have no significant survival association with SET- MAR (https://www.proteinatlas.org/ENSG00000170364- SETMAR/pathology). Molecular explanation for these heteroge- neous relationships is still unknown. To elucidate the pro- and anti-tumorigenic activities of SETMAR in a mechanistic detail, it is crucial to identify genomic targets to which SETMAR specifically binds in cancer cells and link these sites to the regulation of gene expression. A recent study used the ChIP-exo approach to map Flag-tagged SETMAR binding sites in the hyper-aneuploid U2O2 osteosarcoma cell line[17], which allowed the first evaluation of SETMAR cistrome in human tumour cells. However, the majority of ChIP-exo peaks (69%605 out of 875) could not be enriched at the expected target ITRs of theHsmar1transposons, which are considered as natural landing sites for SETMAR chromosome bind- ing. Significant off-target binding have been reported in another (unpublished) study [18], but the reason for SETMAR’s non-ITR binding remained unexplained. We therefore decided to map the genomic landscape of SETMAR in a near-haploid human leukemia cell line (HAP1) to identify on-target and off-target binding sites at high resolution and to elucidate their role in terms of gene expres- sion. Our analysis revealed a perfect correlation between SETMAR and ITR sequences without any untargeted events, calling into question the previously proposed off-target regions. In addition, we identified ITR sequence conservation as a key factor for deter- mining the affinity of SETMAR for chromosomes.
2. Materials and methods 2.1. Cell line and plasmids
The HAP1 cell line were maintained in complete Iscove’s Mod- ified Dulbecco’s Medium (IMDM, Sigma) supplemented with 10%
heat inactivated Tetracycline free Foetal Bovine Serum (iBiotech), 1% penicillin/ streptomycin (Sigma) at 37°C with 5% CO2. The SET- MAR knockout cell line was generated by the CRISPR/Cas9 technol- ogy. The CCTGATCATGTAGTTGGACC gRNA sequence was designed Fig. 1. Characteristics ofHsmar1mariner transposons.‘‘Full-length”Hsmar1, ‘‘gappy”Hsmar1, and MITEs (Miniature Inverted Repeat Transposable Elements) contain two inverted terminal repeat (ITR) sequences (red triangles). ‘‘Solo” inverted repeats contain one ITR linked to a truncatedHsmar1sequence or not. In each category, up to three mismatches were allowed in the flanking ITR sequences (‘‘core” motif: 5’-GGTGCAAAAGTAATTGCGG-3’). Histogram shows the length distribution of MITE sequences with a median size of 68 bp. Only ITRs within 500 bp were considered to identify MITEs. The number of cases (n) is shown on the left. (For interpretation of the references to colour in this figure legend, the reader is referred to the web version of this article.)
to target the endonuclease cleavage to the beginning of the 2nd exon of the SETMAR gene (chr3 4,312,904 (hg38), transcript:
NM_006515). The mutated cells harbour a 10 bp deletion at the target site, which resulted in a frame shift and a premature stop codon 30 bp downstream to the cleavage locus. The generation of the knockout cell line was performed by Horizon Genomics (https://horizondiscovery.com/). The SETMAR knockout cell line was made transgenic with theSleeping Beauty(SB) technology to express an N-terminally hemagglutinin (HA) tagged version of the SETMAR protein as follows. The SB transposon donor was cre- ated by blunt-end cloning the BamHI/XbaI fragment of pcDNA-HA/
SETMAR to the SalI/NotI site of the pTOV-T11-SV40puro [19].
500 ng of the resulting SB transposon donor plasmid, pTOV-HA- SETMAR-puro, was co-transfected with 100 ng of pcGlobinSB100X transposase expressing vector[20] with polyethylene imine into the knockout HAP1 cells, which were subjected to 1
l
g/ml puro-mycin selection to obtain the polyclonal HA-SETMAR-expressing cell line. The expression of the HA-SETMAR transgene and doxycy- cline inducibility were verified with Western-blot analysis using anti-HA antibody (11867423001, Roche).
2.2. SETMAR induction
pTOV-HA-SETMAR-puro was induced by increasing doxycycline concentrations (0.2mg/ml, 0.5mg/ml, 1mg/ml, 2mg/ml) 24 h before the ChIP measurement. The HA-tagged SETMAR protein is here- inafter referred to as ‘‘SETMAR-HA” throughout the text. Expres- sion levels were quantified by western blot and a concentration of 0.5 mM doxycycline was selected for subsequent NGS (ChIP- seq) experiments. For western blot, whole cell extracts were pre- pared by RIPA Buffer (50 mM Tris pH8, 150 mM NaCl, 1%, NP-40, 0.5% sodium deoxycholate, 0.1% SDS) supplemented with protease inhibitors (Pierce Protease Inhibitor Mini Tablets, Thermofisher A32953) followed by sonication (Diagenode BioruptorÒPlus; 1x5 cycles 30 sec on/off High mode). The extracts were prepared from dox-treated (induced) and untreated (uninduced) cells at a concen- tration of 107cells/ml. After centrifugation at 15.000g (at 4°C for 20 min), protein concentrations were measured by the BCA assay (Pierce BCA Protein Assay Reagent; Thermofisher 23225).
30 mg of protein extracts were run by SDS-PAGE (5–12%AA gel, Bio-Rad MiniProtean) and transferred to nitrocellulose membranes (Millipore, Billerica, MA). Ponceau S staining was used to quantify the protein levels. Membranes were blocked with 1% BSA/PBST for 1 h and then incubated with a rabbit polyclonal anti-HA tag anti- body (Abcam ab9110; 1:4000) and an anti-beta-actin mouse mon- oclonal antibody (8H10D10, Invitrogen; 1:2000) at 4°C overnight, with gentle shaking. A custom-made anti-SETMAR polyclonal anti- body (ThermoFisher Scientific) was also used to detect endogenous- and HA-tagged SETMAR, which was produced by immunizing rabbits with the purified protein corresponding to the C-terminal 135 amino acids of SETMAR. After three washes in 1% BSA/PBST, secondary antibodies were added at room temper- ature for 1 h: Alexa Fluor 647 goat anti-rabbit IgG (Invitrogen 1:1000, A-21245), and Alexa FluorÒ 680 Goat Anti-Mouse IgG (1:1000, ab175775, Abcam). Fluorescent signals were detected by the Molecular ImagerÒPharosFXTMsystem (Bio-Rad).
2.3. Chromatin immunoprecipitation and qPCR
2x10⁷ cells were fixed by 1% formaldehyde (V = 20 ml) for 10 min at room temperature (in T175 flasks), and were then quenched by 416 mM glycine for 5 min. After three washes in ice cold PBS/T, cells were scraped off and pelleted by centrifugation at 1000xg for 5 min at 4°C. Cell pellets were stored at80°C. For ChIP, 2x10⁷ cells were suspended in 1.5 ml of ChIP Lysis Buffer (50 mM HEPES-KOH pH 7.5, 140 mM NaCl, 1 mM EDTA pH8, 1%
Triton X-100, 0.1% Sodium Deoxycholate, 1% SDS, supplemented with protease inhibitors) and disrupted by Fast prep (speed: 6 m/
s; time: 40 sec; 2 cycles; pause time: 120 sec). Chromatin lysates were sonicated in 1.5 ml LowBind tubes (600
l
l sample/tube using Diagenode Bioruptor Plus (2x5 cycles, 30 sec ON/OFF LOW). After sonication, cell debris were pelleted by centrifugation at 16.000 g (at 4°C for 20 min). Fragment length distribution of sonicated sam- ples (50l
l) was checked by 1% agarose gel electrophoresis after reverse crosslinking (at 65 °C for 6 h) and phenol–chloroform extraction. Immunoselection was performed by 100ml DynabeadsTM Protein G precoated with 8mg of rabbit polyclonal anti-HA anti- body (Abcam ab9110, ChIP-grade). 5% of sonicated chromatin was saved as ‘‘input” while the rest (‘‘IP”) was diluted 1:10 with IP Dilution Buffer (1% Triton X-100, 2 mM EDTA pH8, 20 mM Tris-HCL pH 8, 150 mM NaCl, supplemented with protease inhibi- tors) in 15 ml tubes and incubated with antibody-coated magnetic beads (at 4°C overnight, with rotation). Beads were washed twice in low salt wash buffer (0.1 % SDS; 1% Triton X 100; 2 mM EDTA;20 mM Tris-HCl; 150 mM NaCl), high salt wash buffer (0.1% SDS;
1 % Triton X 100; 2 mM EDTA; 20 mM Tris-HCl; 500 mM NaCl), LiCl wash buffer (0.25 M LiCl; 1% NP40; 1% Na-deoxicolate; 1 mM EDTA; 10 mM Tris-HCl) and in TE buffer (10 mM Tris-HCl, 1 mM EDTA) at 4°C for 1 min, using MagnaRack. IP and input samples were then eluted in 100ul elution buffer (0.1 M NaHCO3, 1% SDS) for 15 min at 30°C with frequent vortexing. Supernatants were transferred to LoBind Eppendorf tubes and stored at80°C. Vali- dation of SETMAR-HA binding sites (predicted by ChIP-seq analy- sis, see below) were performed by real-time quantitative PCR (qPCR) using a QuantStudio12KFlex machine (Applied Biosys- temsTM) and LightCyclerÒ 480 SYBR Green I Master (Roche) PCR reagent, following the manufacturer recommendations. Measure- ments were done in triplicates from two independent biological replicate experiments, and enrichment ratios were plotted as ‘‘per- cent of input”, corrected for dilution. qPCR primers are listed in Supplementary Table S1.
2.4. Illumina sequencing and bioinformatic analysis
NGS libraries were prepared by the Nugen Ovation Ultralow System V2 library preparation kit (NuGEN Technologies) following the manufacturer’s instructions. 241 million reads were sequenced (paired-end) from two independent biological replicate experi- ments using an Illumina Nextseq 500 machine and the NextSeqÒ 500/550 Mid Output Kit v2 (Illumina). 97.31% of reads were mapped on the GRCh38 (hg38) human reference genome by Bow- tie2 version 2.3.4.1[21]using default parameters. Picard was used to remove PCR duplicates from BAM files created by Samtools ver- sion 1.10[22], applying default parameters. Repetitive segments of the genome were blacklist filtered (according to 05.05.2020, Stan- ford University, Anshul Kundaje Lab) and BAM files containing 185 million mapped reads were RPKM normalised using deeptools ver- sion 3.3.1 [23] applying bamCoverage processing (bin size = 100 bp; smooth length = 300 bp). MACS2 version 2.2.6 [24]was used to identify ChIP peaks from bedGraph files, applying default parameters. IP and corresponding Input data were pro- cessed in parallel. Peaks identified in Input were filtered out from IP samples using Bedtools version 2.29.0[25]. Eleven ChIP peaks fell into unmappable segments of the hg38 reference genome and were therefore excluded from further analysis. Computer ran- domized peak sets were generated by Bedtools as a null model for significance tests. Blacklisted regions were excluded from random peak set generation. Annotation of SETMAR-HA chromosomal binding sites was performed according to the genomic categories of HOMER[26]. Peaks (observed and random) were extended by +/- 500 bp and their overlap ratios were determined with the 4034
appropriate annotation categories. In the pie charts, only peak summits were considered (peak sizes were not extended).
De novo SETMAR-HA binding motifs were identified by the MEME Suite version 5.3.0[27]using the MEME and MAST tools.
The motifs are listed in Supplementary Table S1 (MEME MAST worksheet). 763 SETMAR peaks contain the ITR consensus sequence GGTGCAAAAGTAATTGCGG identified by Cordeux R et al.[10]as anin vitrobinding site for SETMAR. In parallel, we mapped the ITR consensus sequence by Cordeux R et al. [10]on the hg38 reference genome using Biostring and BSgenome.Hsapi- ens.UCSC.hg38 (R project) allowing 0–3 mismatches, and anno- tated the sequences based on the number of mismatches (0- 3MM ITR groups;Supplementary Table S1‘‘ITR_10854” sheet and MEME MAST sheet). The overlap of annotated ITRs and SETMAR- HA ChIP peaks (extended by +/- 500 bp) are shown inFigs. 4 and 5. Statistical analysis was performed and plots were generated by R version 3.6.3 (2020–02-29). Heatmaps and pileup plots were cre- ated by deepTools. NGS tracks were visualized by Integrative Gen- ome Browser (IGV) version 2.8.4[28]and JBrowse[29]. Published genomic datasets used in our analysis: RNA-seq (SRR5266566 (GSM2493886), SRR5266578 (GSM2493898) [30], ChIP-exo (GSE108773, [17]). SRA files were converted to fastq files by fastq-dump (version 2.10.4) using default parameters. RNA-seq reads were aligned to the hg38 genome by TopHat (version v2.1.1)[31]and FPKM values (Fragments Per Kilobase of transcript per Million mapped reads) were calculated by Cufflinks (version v2.2.1)[32].
3. Results and discussion
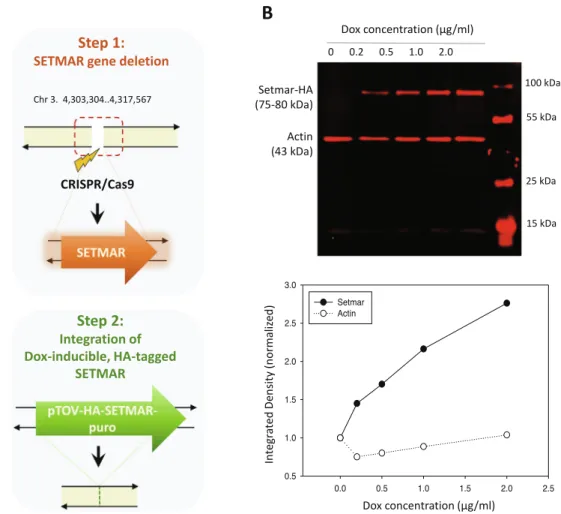
To map the chromatin binding sites of SETMAR with high spatial resolution, we set up an experimental system in the nearly haploid HAP1 lymphoblastoid leukaemia cell line[33]in which the endoge- nous SETMAR locus was knocked out by CRISPR/Cas9 technology followed by complementation by a doxycycline-inducible isoform of SETMAR carrying an N-terminal hemagglutinin tag (pTOV- HA-SETMAR-puro,Fig. 2A). The haploid chromosome set allows us to maximize NGS resolution and peak calling accuracy, while knockout of the parental allele is expected to prevent competition between endogenous and epitope-tagged SETMAR isoforms during chromatin binding. Western blot analysis shows that the kinetics of SETMAR-HA induction linearly scaled with the dose of dox concen- tration, while the tagged protein was not expressed in the absence of drug treatment (Fig. 2B) or in wild-type HAP1 cells (Supplemen- tary Fig. S3A). The amount of SETMAR-HA at a dox concentration of 0.5
l
g/ml was about 3–4 times the amount of endogenous SETMAR expressed in wild-type HAP1 cells (detected by an anti-SETMAR antibody; Supplementary Fig. S3B), which provided optimal enrichment for ChIP experiments without significant overexpres- sion of the fusion protein. The observed increase in SETMAR expres- sion levels falls well within the physiological range of SETMAR expression detected in various human tissues and cell lines (Supplementary Fig. S1-S2), which show approximately 80-fold differences. Of the 241 million sequenced reads, we identified 764 / 2228 high-confidence SETMAR-HA binding sites at two0.0 0.5 1.0 1.5 2.0 2.5
Integrated Density (normalized)
0.5 1.0 1.5 2.0 2.5 3.0
Setmar Actin
Fig. 2. Experimental design.(A) Scheme of SETMAR gene deletion and integration of the conditional allele (pTOV-HA-SETMAR-puro). (B) Kinetics of SETMAR-HA induction at various tetracycline (TET) concentrations. Tet-treatment was performed for 24 h. Upper panel: western blot with anti-HA and anti-beta Actin antibodies. Lower panel:
Quantification of band intensities as a function of TET concentrations.
Fig. 3. Genome-wide mapping of SETMAR binding sites by ChIP-seq.Upper panel: Genome browser track showing the chromosomal distribution of ChIP peaks (vertical blue bars). Lower panel: Validation of representative SETMAR-HA binding sites from different chromosomes by ChIP-qPCR. Positive and negative sites are highlighted in red and grey, respectively. Position of PCR amplicons and ChIP peak summits are shown below the IGV tracks. (For interpretation of the references to colour in this figure legend, the reader is referred to the web version of this article.)
Fig. 4. Annotation of SETMAR-HA binding sites in the human genome.(A) Association of ChIP peaks with genic (exon, intron, TSS, TTS) and intergenic regions. TSS:
transcription start site. TTS: transcription termination site. Left and right panels: observed and expected (computer randomized) distributions, respectively. Number of peaks:
764. (B) Detailed annotation of ChIP peaks over 11 functional genomic categories. n: number of elements in categories. Cells contain observed / expected ratios for peak counts. Warmer colours represent higher enrichment. Statistically significant enrichment is observed at TSS (p-value = 0.03),MADE1(p-value < 2.210-16) and ITR regions (p-value < 2.210-16; prop. z test; level of significance: 0.05).
4036
significance thresholds (Supplementary Table S1) associated with the 23 chromosomes except the mitochondrial genome (mtDNA), which was used as an internal negative control. Representative binding sites were validated by ChIP-qPCR measurements in dox- treated and untreated samples (Fig. 3 and Supplementary Fig. S4), confirming the specificity of our peak detection. We next
analysed the overlap of SETMAR-HA binding sites with annotated genomic categories of the hg38 reference genome (Fig. 4). Func- tional annotation revealed that most SETMAR-HA sites were located in intergenic regions (52%398 peaks) and introns (43%
329 peaks;Fig. 4A), however, the observed frequencies did not differ from the expected (theoretical) distribution. Statistically sig- Fig. 5. SETMAR-HA preferentially binds to inverted terminal repeat (ITR) sequences.(A) Genome browser track showing the distribution of SETMAR-HA ChIP peaks (blue) and ITR motifs (green) for each autosome and the sex chromosome (chrX). (B) The summit of SETMAR-HA signal perfectly coincides with ITRs (red curve and heatmap). The ChIP signal is depleted over random sites (yellow, green, and blue curves). (C) Upper panel: Proportional Venn diagram showing the overlap of SETMAR ChIP peaks and ITR motifs. Of the 764 SETMAR-HA peaks, 763 sites (99.9%) are associated with ITRs. Of the 10,854 ITRs, 1227 motifs (11.3%) are localized in SETMAR-HA peaks. Lower panel:
Chromosomal distribution of SETMAR-HA binding sites and ITR motifs is strongly correlated. The number of SETMAR-HA peaks and ITRs were plotted as a function of chromosome length. They show significant covariation and correlation with chromosome length (Spearman r = 0.89; p < 0.001). Dots: chromosomes. Chromosome X rep- resents an outlier in terms of ChIP peak numbers. (For interpretation of the references to colour in this figure legend, the reader is referred to the web version of this article.)
Table 1
Functional annotation of SETMAR-associated genes (n = 288).Upper table: top five hits of GO-term analysis. Lower table: list of significant MAPK genes.
#term ID term description observed gene count background gene count FDR
hsa04010 MAPK signaling pathway 14 293 0.0143
IPR000742 EGF-like domain 15 225 0.0016
GO:0005515 Protein binding 128 6607 0.0409
KW-0597 Phosphoprotein 161 8067 1.90E-05
KW-0025 Alternative splicing 203 10,225 1.13E-08
Gene name Ensemble ID Function
ANGPT1 ENSG00000154188 angiopoietin 1
CACNA1A ENSG00000141837 calcium voltage-gated channel subunit alpha1 A
CACNA2D1 ENSG00000153956 calcium voltage-gated channel auxiliary subunit alpha2delta 1
EFNA5 ENSG00000184349 ephrin A5
FGF1 ENSG00000113578 fibroblast growth factor 1
NTRK2 ENSG00000148053 neurotrophic receptor tyrosine kinase 2
PAK2 ENSG00000180370 p21 (RAC1) activated kinase 2
PLA2G4C ENSG00000105499 phospholipase A2 group IVC
PRKACB ENSG00000142875 protein kinase cAMP-activated catalytic subunit beta
PRKCB ENSG00000166501 protein kinase C beta
SOS1 ENSG00000115904 SOS Ras/Rac guanine nucleotide exchange factor 1
STK3 ENSG00000104375 serine/threonine kinase 3
TGFA ENSG00000163235 transforming growth factor alpha
MAP3K20 ENSG00000091436 mitogen-activated protein kinase kinase kinase 20
nificant enrichment was observed at transcriptional start sites (TSS;
p = 0.03), MADE1miniature transposons (p < 2.2 10–16), and other,Hsmar1transposon-derived ITR sequences (p < 2.210–16
;Fig. 4B). The number of peaks in TSS/promoter regions represented only 4% of the binding sites (27 peaks), however, SETMAR-HA was bound to 288 protein-coding genes when TSS-exon–intron-TTS regions were considered (we note that there may be multiple peaks within the same gene). GO-term analysis of SETMAR-associated genes showed enrichment of the MAPK signalling pathway (sum- marized inTable 1), suggesting a possible role for SETMAR in cell cycle control. Indeed, overexpression of SETMAR significantly reduced the proliferation rate of U2OS osteosarcoma cells[17], con- sistent with this model. Regarding intergenic regions, all the iden- tified peaks (398 sites) were located in ITR sequences (Fig. 5) or MADE1elements flanked by ITRs (Fig. 4B). Pileup and Venn diagram analysis (Fig. 5B-C) highlights the perfect colocalization between peak summits and ITR motifs within genic and intergenic regions.
We note, however, that only a subset of ITRs were accessible for SETMAR binding (1227 motifs11.3%), which is still significant compared to a randomized distribution (p < 2.2 10–16). The unavailability of ITRs at a given time may be related to local chro- matin openness, cis- and trans-acting factors, cell cycle stage, or other unknown elements of chromatin structure that have yet to be explored. To address the variance of ITR frequencies and SETMAR binding sites related to chromosome size, we plotted the number of ITRs and SETMAR-HA peaks per chromosome as a function of chro-
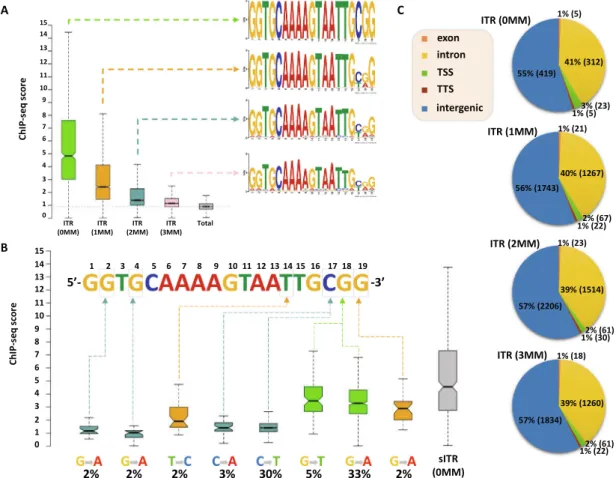
mosome length (Fig. 5C). The results clearly show that the distribu- tion of SETMAR-HA binding sites and ITR motifs was strongly correlated with chromosome length and showed significant covari- ation (Spearman r = 0.89; p < 0.001). The X chromosome is a notable exception, as SETMAR binding sites did not correlate with ITR num- bers and chromosome size. This unexpected behaviour of chromo- some X awaits explanation. To identify critical nucleotide positions in the core ITR motif that are required for SETMAR’s efficient chro- matin binding, we grouped ITRs based on the number of mis- matches in the 19nt 50-GGTGCAAAAGTAATTGCGG-30sequence (0- 3MM groups,Supplementary Table S1) and plotted the SETMAR- HA signal over the categories (Fig. 6). We found that ChIP-seq scores, related to the affinity of SETMAR-HA binding, were inversely proportional to the number of mismatches in the ITR motif (Fig. 6A), i.e. the greater the number of mismatches, the lower the affinity of SETMAR (p < 2.210-16). Furthermore, nucleotide positions G2, G4, T14, C17, G18, G19 appeared to be essential for the association of SETMAR and ITRs, as single-nucleotide changes in these bases sig- nificantly reduced the affinity of SETMAR-HA binding (Fig. 6B).
Based on the degree of affinity loss and the prevalence of muta- tional change, C-to-T and C-to-A transversions at position C17 proved to be the most critical mutations (change in affinity: greater than4-fold; cumulative allele frequency: 33%). Compared to posi- tion C17, G-to-A and G-to-T mutations of G18 were also widespread (38%) but did not cause similar affinity changes, while G-to-A muta- tion of G2 and G4 led to a large decrease in affinity but were rare
Fig. 6. Sequence fidelity of the ITR motif determines the affinity of SETMAR-HA binding.(A) ITRs were grouped based on the number of mismatches in the core 19 nt motif (0MM = 763, 1MM = 3104, 2MM = 3812, 3MM = 3175), and distribution of the ChIP signal was plotted over the categories (average ChIP-seq score per ITR). ‘‘Total” (grey box) represents genomic background. There is a statistically significant difference between groups and compared to genomic background (p value < 2.210-16, Wilcoxon rank sum test). ChIP-seq scores, related to the affinity of SETMAR-HA binding, are inversely proportional to the number of mismatches. PWM logos are highlighted for each ITR group. (B) Identification of critical ITR nucleotide positions for SETMAR’s chromatin binding. Single-nucleotide changes that significantly reduce the affinity of SETMAR- HA for solo ITRs (sITR) are highlighted (position, mutation type, and frequency/% of cases in the 1MM group). ChIP-seq scores show a significant reduction in each group compared to 0MM sITR (p value < 10-6, Wilcoxon rank sum test). Number of cases: sITRs with one mismatch (1MM sITR = 1519), sITRs with zero mismatch (0MM sITR = 322).
Rare events with a mutation frequency of<2% were excluded from the analysis. (C) Annotation of ITR groups in intergenic and genic (exon, intron, TSS, TTS) chromosomal regions. Percentage represents the proportion of 0-3MM ITRs within each annotation category. TSS: transcription start site. TTS: transcription termination site.
4038
(2%). Based on the number of mismatches, functional annotation of the ITR categories showed no difference in their genomic localiza- tion (Fig. 6C). It is noteworthy that more than 60% of the identified mutations were G-to-A and C-to-T changes that correspond to
‘‘clock-like” mutation signatures in the COSMIC database [34].
Clock-like mutations are known to form continuously in normal (and cancerous) human cell types, generating mutations at a steady rate throughout the lifetime of cells[35]. Since many ITRs occur in pairs along the chromosomes and one motif is typically of high fide- lity (0MM group), the neutral allele is free to mutate during evolu- tion while the conserved motif can still bind and position SETMAR.
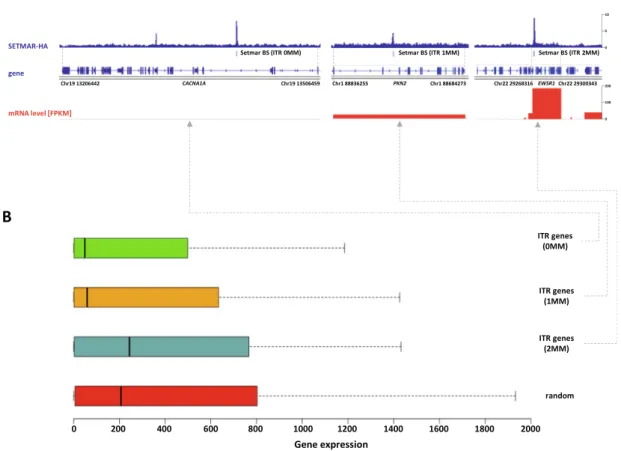
We found 454 paired ITRs of which 388 (85.4%) were 0MM/1-3MM ITR pairs. In this way, clock-like ITR polymorphisms provide a ratio- nale for fine-tuning SETMAR’s biological function related to tran- scription. Accordingly, when SETMAR-associated genes were grouped by the number of mismatches in the ITR motif, the high- fidelity group (MM0) showed significantly reduced mRNA expres- sion levels compared to the random gene group (Fig. 7). ITR sequence fidelity was inversely proportional to gene expression levels, i.e., the lower the number of ITR mismatches, the stronger the repression of SETMAR-bound gene loci. The preferential associ- ation of SETMAR and repressed genes is fully consistent with previ- ous results[10], which provide strong evidence for SETMAR binding to the most lowly expressed genes with FPKM values between zero and one.
4. Conclusions
The results presented in this study clearly show that SETMAR preferentially targetsHsmar1transposon ends (ITRs) in living cells
that are dispersed throughout the human genome. In contrast to previous studies, we could not detect any off-target binding events at non-ITR sequences. Possible reasons for the differences may include the use of different cell lines (U2OS osteosarcoma cells vs.HAP1 lymphoblastic leukaemia cells), tags (FLAGvs.HA), NGS platforms (SOLiDvs.Illumina), and the low NGS coverage of the previous study [17]. In our experiment, SETMAR was bound to the theoretically expected sequences [10]targeted by its trans- posase domain. The probability that SETMAR binds to ITR sequences by chance is extremely low (p-value < 2.2 10-16; Fig. 4B). In addition, several ChIP peaks were validated by qPCR in samples with and without doxycycline induction (Fig. 3and Supplementary Fig. S4), confirming the specificity of ChIP peak detection.
In conclusion, sequence fidelity of the ITR motif has been iden- tified as the only factor that determines the affinity of SETMAR to chromosomes, such that higher ITR fidelity and increased SETMAR chromatin binding resulted in stronger suppression of SETMAR- bound gene loci. This mechanism may be part of a subtle evolu- tionary strategy to fine-tune transcriptional processes regulated by SETMAR.
5. Key points
1. SETMAR/Metnase preferentially targets Hsmar1 transposon ends (ITRs) in living cells
2. Sequence fidelity of the ITR motif determines the affinity of SET- MAR/Metnase to chromosomes
3. Higher ITR fidelity results in increased affinity for chromatin and stronger repression of SETMAR-bound gene loci
Fig. 7. Gene expression values of SETMAR associated genes scale with the number of ITR mismatches.(A) Representative genes showing the reciprocal association of mRNA expression level and ITR mismatch number. FPKM stands for Fragments Per Kilobase of transcript per Million mapped reads. (B) mRNA expression levels of SETMAR- HA associated genes grouped by the number of mismatches in ITRs (MM0 = 132, MM1 = 145, MM2 = 29, random = 304). The high fidelity group (MM0) shows significantly reduced mRNA expression levels compared to the random gene group (p-value = 7.510-4, Wilcoxon rank sum test).
CRediT authorship contribution statement
Márton Miskei: Formal analysis, Methodology, Visualization, Data curation.Adrienn Horváth:Investigation.Lívia Viola:Inves- tigation.Laura Varga:Investigation.Éva Nagy:Investigation, Val- idation. Orsolya Feró: Formal analysis, Visualization. Zsolt Karányi:Software.Jason Roszik:Formal analysis.Csaba Miskey:
Conceptualization, Data Curation, Methodology.Zoltán Ivics:Con- ceptualization, Supervision, Funding acquisition. Lóránt Székvölgyi:Conceptualization, Methodology, Supervision, Funding acquisition.
Declaration of Competing Interest
The authors declare that they have no known competing finan- cial interests or personal relationships that could have appeared to influence the work reported in this paper.
Acknowledgements
We thank Tilmann Bürckstümmer and his colleagues at Horizon Genomics for the HAP1-derived SETMAR knockout cell line.
Funding
This work was funded by NKFIH-NNE-130913, H2020- ERARE18-066 REPETOMICS, GINOP-2.3.2-15-2016-00024, and the Thematic Excellence Programme (TKP2020-IKA-04) of the Ministry for Innovation and Technology in Hungary. MM and LS were sup- ported by the Bolyai Janos fellowship of the Hungarian Academy of Sciences and the UNKP-20-5-DE-296 and UNKP-20–5-DE-47 new national excellence program of the Ministry For Innovation and Technology from the source of the National Research, Develop- ment and Innovation Fund.
Data availability statement
All data relevant to this study can be found at GEO (GSE175725) or uploaded as online supplementary information. All genome browser tracks are available at JBrowse (http://geneart.med.uni- deb.hu/pub/2021-setmar, login: setmar, password: setmar-2021).
Appendix A. Supplementary data
Supplementary data to this article can be found online at https://doi.org/10.1016/j.csbj.2021.07.010.
References
[1] Robertson HM. The Tcl-mariner superfamily of transposons in animals. J Insect Physiol 1995;41(2):99–105.https://doi.org/10.1016/0022-1910(94)00082-R.
[2] Plasterk RHA, Izsvák Z, Ivics Z. Resident aliens: the Tc1/mariner superfamily of transposable elements. Trends Genet 1999;15(8):326–32. https://doi.org/
10.1016/S0168-9525(99)01777-1.
[3] Tellier M, Bouuaert CC, Chalmers R. Mariner and the ITm Superfamily of Transposons. Microbiol Spectr 2015;3:MDNA3-0033–2014.. https://doi.org/
10.1128/microbiolspec.MDNA3-0033-2014.Correspondence.
[4] Hartl DL, Lohe AR, Lozovskaya ER. Modern thoughts on an ancyent marinere:
Function, Evolution. Regulation. Annu Rev Genet 1997;31(1):337–58.https://
doi.org/10.1146/annurev.genet.31.1.337.
[5] Robertson HM, Zumpano KL. Molecular evolution of an ancient mariner transposon, Hsmarl, in the human genome. Gene 1997;205(1-2):203–17.
https://doi.org/10.1016/S0378-1119(97)00472-1.
[6] Robertson HM, Martos R. Molecular evolution of the second ancient human mariner transposon, Hsmar2, illustrates patterns of neutral evolution in the human genome lineage. Gene 1997;205(1-2):219–28.https://doi.org/10.1016/
S0378-1119(97)00471-X.
[7] International Human Genome Sequencing Consortium. Initial sequencing and analysis of the human genome. Nature 2001;409:860–921.https://doi.org/
10.1038/35057062.
[8] Feschotte C, Mouche C. Evidence that a Family of Miniature Inverted-Repeat Transposable Elements (MITEs) from the Arabidopsis thaliana Genome Has Arisen from a pogo-like DNA Transposon. Mol Biol Evol 2000;5:730–7.https://
doi.org/10.1093/oxfordjournals.molbev.a026351.
[9] Jones JM, Gellert M. The taming of a transposon: V(D)J recombination and the immune system. Immunol Rev 2004;200(1):233–48.https://doi.org/10.1111/
imr.2004.200.issue-110.1111/j.0105-2896.2004.00168.x.
[10] Cordaux R, Udit S, Batzer MA, Feschotte C. Birth of a chimeric primate gene by capture of the transposase gene from a mobile element. Proc Natl Acad Sci U S A 2006;103(21):8101–6.https://doi.org/10.1073/pnas.0601161103.
[11] Jenuwein T, Laible G, Dorn R, Reuter G. SET domain proteins modulate chromatin domains in eu- and heterochromatin. Cell Mol Life Sci 1998;54 (1):80–93.https://doi.org/10.1007/s000180050127.
[12] Lee S-H, Oshige M, Durant ST, Rasila KK, Williamson EA, Ramsey H, et al. The SET domain protein Metnase mediates foreign DNA integration and links integration to nonhomologous end-joining repair. Proc Natl Acad Sci U S A 2005;102(50):18075–80.https://doi.org/10.1073/pnas.0503676102.
[13] Cosby RL, Judd J, Zhang R, Zhong A, Garry N, Pritham EJ, et al.
Recurrent evolution of vertebrate transcription factors by transposase capture. Science (80-) 2021;371:eabc6405. https://doi.org/10.1101/
2020.05.07.082677.
[14] Jeyaratnam DC, Baduin BS, Hansen MC, Hansen M, Jørgensen JM, Aggerholm A, et al. Delineation of known and new transcript variants of the SETMAR (Metnase) gene and the expression profile in hematologic neoplasms. Exp Hematol 2014;42(6):448–456.e4. https://doi.org/10.1016/
j.exphem.2014.02.005.
[15] Sharma N, Speed MC, Allen CP, Maranon DG, Williamson E, Singh S, et al.
Distinct roles of structure-specific endonucleases EEPD1 and Metnase in replication stress responses. NAR Cancer 2020;2:1–14. https://doi.org/
10.1093/narcan/zcaa008.
[16] Wray J, Williamson EA, Royce M, Shaheen M, Beck BD, Lee S-H, et al. Metnase mediates resistance to topoisomerase II inhibitors in breast cancer cells. PLoS ONE 2009;4(4):e5323.https://doi.org/10.1371/journal.pone.0005323.
[17] Tellier M, Chalmers R. Human SETMAR is a DNA sequence-specific histone- methylase with a broad effect on the transcriptome. Nucleic Acids Res 2019;47:122–33.https://doi.org/10.1093/nar/gky937.
[18] Antoine-Lorquin A, Arnaoty A, Asgari S, Batailler M, Beauclair L, Belleannée C, et al. First landscape of binding to chromosomes for a domesticated mariner transposase in the human genome: diversity of genomic targets of SETMAR isoforms in two colorectal cell lines. BioRxiv 2017.https://doi.org/10.1101/
115030.
[19] Heinz N, Schambach A, Galla M, Maetzig T, Baum C, Loew R, et al. Retroviral and transposon-based tet-regulated all-in-one vectors with reduced background expression and improved dynamic range. Hum Gene Ther 2011;22(2):166–76.https://doi.org/10.1089/hum.2010.099.
[20] Mátés L, Chuah MKL, Belay E, Jerchow B, Manoj N, Acosta-Sanchez A, et al.
Molecular evolution of a novel hyperactive Sleeping Beauty transposase enables robust stable gene transfer in vertebrates. Nat Genet 2009;41 (6):753–61.https://doi.org/10.1038/ng.343.
[21] Kim D, Langmead B, Salzberg SL. HISAT: a fast spliced aligner with low memory requirements. Nat Methods 2015;12(4):357–60. https://doi.org/
10.1038/nmeth.3317.
[22] Li H, Handsaker B, Wysoker A, Fennell T, Ruan J, Homer N, et al. The Sequence Alignment/Map format and SAMtools. Bioinformatics 2009;25(16):2078–9.
https://doi.org/10.1093/bioinformatics/btp352.
[23] Ramírez F, Ryan DP, Grüning B, Bhardwaj V, Kilpert F, Richter AS, et al. deepTools2:
a next generation web server for deep-sequencing data analysis. Nucleic Acids Res 2016;44(W1):W160–5.https://doi.org/10.1093/nar/gkw257.
[24] Zhang Y, Liu T, Meyer CA, Eeckhoute J, Johnson DS, Bernstein BE, et al. Model- based Analysis of ChIP-Seq (MACS). Genome Biol 2008;9(9):R137.https://doi.
org/10.1186/gb-2008-9-9-r137.
[25] Quinlan AR, Hall IM. BEDTools: A flexible suite of utilities for comparing genomic features. Bioinformatics 2010;26:841–2. https://doi.org/10.1093/
bioinformatics/btq033.
[26] Heinz S, Benner C, Spann N, Bertolino E, Lin YC, Laslo P, et al. Simple Combinations of Lineage-Determining Transcription Factors Prime cis- Regulatory Elements Required for Macrophage and B Cell Identities. Mol Cell 2010;38(4):576–89.https://doi.org/10.1016/j.molcel.2010.05.004.
[27] Michelman-Ribeiro A, Mazza D, Rosales T, Stasevich TJ, Boukari H, Rishi V, et al.
Direct measurement of association and dissociation rates of DNA binding in live cells by fluorescence correlation spectroscopy. Biophys J 2009;97 (1):337–46.https://doi.org/10.1016/j.bpj.2009.04.027.
[28] Robinson JT, Thorvaldsdóttir H, Winckler W, Guttman M, Lander ES, Getz G, et al. Integrative genomics viewer. Nat Biotechnol 2011;29(1):24–6.https://
doi.org/10.1038/nbt.1754.
[29] Buels R, Yao E, Diesh CM, Hayes RD, Munoz-Torres M, Helt G, et al. JBrowse: A dynamic web platform for genome visualization and analysis. Genome Biol 2016;17(1).https://doi.org/10.1186/s13059-016-0924-1.
[30] Haarhuis JHI, van der Weide RH, Blomen VA, Yáñez-Cuna JO, Amendola M, van Ruiten MS, et al. The Cohesin Release Factor WAPL Restricts Chromatin Loop Extension. Cell 2017;169(4):693–707.e14. https://doi.org/10.1016/
j.cell.2017.04.013.
[31] Kim D, Pertea G, Trapnell C, Pimentel H, Kelley R, Salzberg SL. TopHat2:
accurate alignment of transcriptomes in the presence of insertions, deletions and gene fusions. Genome Biol 2013;14(4):R36.https://doi.org/10.1186/gb- 2013-14-4-r36.
4040
[32] Trapnell C, Hendrickson DG, Sauvageau M, Goff L, Rinn JL, Pachter L.
Differential analysis of gene regulation at transcript resolution with RNA- seq. Nat Biotechnol 2013;31(1):46–53.https://doi.org/10.1038/nbt.2450.
[33] Essletzbichler P, Konopka T, Santoro F, Chen D, Gapp BV, Kralovics R, et al.
Megabase-scale deletion using CRISPR/Cas9 to generate a fully haploid human cell line. Genome Res 2014;24(12):2059–65. https://doi.org/10.1101/
gr.177220.114.
[34] Tate JG, Bamford S, Jubb HC, Sondka Z, Beare DM, Bindal N, et al. COSMIC: The Catalogue Of Somatic Mutations In Cancer. Nucleic Acids Res 2019;47:D941–7.
https://doi.org/10.1093/nar/gky1015.
[35] Alexandrov LB, Jones PH, Wedge DC, Sale JE, Campbell PJ, Nik-Zainal S, et al.
Clock-like mutational processes in human somatic cells. Nat Genet 2015;47 (12):1402–7.https://doi.org/10.1038/ng.3441.