Food Chemistry 357 (2021) 129757
Available online 9 April 2021
0308-8146/© 2021 The Author(s). Published by Elsevier Ltd. This is an open access article under the CC BY-NC-ND license
Data sharing in PredRet for accurate prediction of retention time:
Application to plant food bioactive compounds
Dorrain Yanwen Low
a,*, Pierre Micheau
a, Ville Mikael Koistinen
b,c, Kati Hanhineva
b,c,ac, L ´ aszl o Abrank ´ o ´
d, Ana Rodriguez-Mateos
e, Andreia Bento da Silva
f,g, Christof van Poucke
h, Conceiç ˜ ao Almeida
f, Cristina Andres-Lacueva
i,j, Dilip K. Rai
k, Esra Capanoglu
l,
Francisco A. Tom ´ as Barber ´ an
m,n, Fulvio Mattivi
o,p, Gesine Schmidt
q, G ¨ ozde Gürdeniz
r, Kate ˇ rina Valentov ´ a
s, Letizia Bresciani
t, Lucie Petr ´ askov ´ a
s, Lars Ove Dragsted
r, Mark Philo
u, Marynka Ulaszewska
o,2, Pedro Mena
v, Raúl Gonz ´ alez-Domínguez
i,j, Rocío Garcia-Villalba
m, Senem Kamiloglu
l,w, Sonia de Pascual-Teresa
x, St ´ ephanie Durand
y, Wieslaw Wiczkowski
z, Maria Ros ´ ario Bronze
f,aa,ab, Jan Stanstrup
r,1, Claudine Manach
a,1aUniversit´e Clermont Auvergne, INRAE, UNH, F-63000 Clermont Ferrand, France
bInstitute of Public Health and Clinical Nutrition, University of Eastern Finland, FI-70211 Kuopio, Finland
cDepartment of Biochemistry, University of Turku, FI-20014 Turun yliopisto, Finland
dDepartment of Applied Chemistry, Faculty of Food Science, Szent Istv´an Egyetem, 29-43 Villanyi Street, 1118 Budapest, Hungary
eDepartment of Nutritional Sciences, School of Life Course Sciences, King’s College London, SE1 9NH London, United Kingdom
fInstituto de Tecnologia Química e Biol´ogica, Universidade Nova de Lisboa, Av. da República, 2780-157 Oeiras, Portugal
gFaculty of Pharmacy, University of Lisbon, Avenida Professor Gama Pinto, 1649-003 Lisbon, Portugal
hTechnology and Food Science Department, Flanders Research Institute for Agriculture Fisheries and Food (ILVO), Brusselsesteenweg 370, B-9090 Melle, Belgium
iNutrition, Food Science and Gastronomy Department, Pharmacy Faculty, University of Barcelona, Av Joan XXlll, 08028 Barcelona, Spain
jCIBER Fragilidad y Envejecimiento Saludable (CIBERfes), Instituto de Salud Carlos III, 28029 Madrid, Spain
kDepartment of Food BioSciences, Teagasc Food Research Centre Ashtown, Dublin D15 KN3K, Ireland
lDepartment of Food Engineering, Faculty of Chemical and Metallurgical Engineering, Istanbul Technical University, 34469 Maslak, Istanbul, Turkey
mDepartment of Food Science and Technology, CEBAS-CSIC, Campus Universitario de Espinardo, edf 25, 30100 Murcia, Spain
nDepartment of Biotechnology, College of Science, Taif University, Taif 26571, Saudi Arabia
oDepartment of Food Quality and Nutrition, Metabolomics Unit, Research and Innovation Centre, Fondazione Edmund Mach, 38010 San Michele all’Adige, Italy
pDepartment of Cellular, Computational and Integrative Biology, CIBIO, University of Trento, 38123 Trento, Italy
qDepartment of Food and Health, Nofima, Norwegian Institute of Food, Fisheries and Aquaculture Research, PB 210, NO-1433 Ås, Norway
rDepartment of Nutrition, Exercise and Sports, University of Copenhagen, Frederiksberg DK-1985, Denmark
sLaboratory of Biotransformation, Institute of Microbiology of the CAS, Vídeˇnsk´a 1083, CZ-142 20 Prague, Czechia
tHuman Nutrition Unit, Department of Veterinary Science, University of Parma, Via Volturno, 39, 43125 Parma PR, Italy
uQuadram Institute Biosciences, Norwich Research Park NR4 7 UQ, United Kingdom
vHuman Nutrition Unit, Department of Food and Drug, University of Pharma, Via Volturno, 39, 43125 Parma PR, Italy
wScience and Technology Application and Research Center (BITUAM), Bursa Uludag University, 16059 Gorukle, Bursa, Turkey
xDepartment of Metabolism and Nutrition, Institute of Food Science, Technology and Nutrition (ICTAN-CSIC), Jose Antonio Novais 10, 28040 Madrid, Spain
yPlateforme d’Exploration du M´etabolisme, MetaboHUB Clermont, Universit´e Clermont Auvergne, INRAE, UNH, F-63000 Clermont Ferrand, France
zInstitute of Animal Reproduction and Food Research of the Polish Academy of Sciences, Tuwima 10, 10-748 Olsztyn, Poland
aaInstituto de Biologia Experimental Tecnol´ogica, Av. da República, Quinta do Marquˆes, Edificio iBET/ITQB, 2780-157 Oeiras, Portugal
abResearch Institute for Medicines, Faculty of Pharmacy, University of Lisbon, Avenida Professor Gama Pinto, 1649-003 Lisbon, Portugal
acDepartment of Biology and Biological Engineering, Division of Food and Nutrition Science, Chalmers University of Technology, Gothenburg 412 96, Sweden
A R T I C L E I N F O
Keywords:
Predicted retention time
A B S T R A C T
Prediction of retention times (RTs) is increasingly considered in untargeted metabolomics to complement MS/MS matching for annotation of unidentified peaks. We tested the performance of PredRet (http://predret.org/) to
* Corresponding author at: Lee Kong Chian School of Medicine, Nanyang Techological University, 59 Nanyang Drive, Singapore 636921, Singapore.
E-mail address: dorrain.low@ntu.edu.sg (D.Y. Low).
1 Claudine Manach and Jan Stanstrup share last co-authorship.
2 Present address: Proteomics and Metabolomics Facility, Center for Omics Sciences, IRCCS San Raffaele Scientific Institute, Via Olgettina n.60 20132 Milan, Italy.
Contents lists available at ScienceDirect
Food Chemistry
journal homepage: www.elsevier.com/locate/foodchem
https://doi.org/10.1016/j.foodchem.2021.129757
Received 7 January 2021; Received in revised form 29 March 2021; Accepted 6 April 2021
Metabolomics
Plant food bioactive compounds Metabolites
Data sharing UHPLC
predict RTs for plant food bioactive metabolites in a data sharing initiative containing entry sets of 29–103 compounds (totalling 467 compounds, >30 families) across 24 chromatographic systems (CSs). Between 27 and 667 predictions were obtained with a median prediction error of 0.03–0.76 min and interval width of 0.33–8.78 min. An external validation test of eight CSs showed high prediction accuracy. RT prediction was dependent on shape and type of LC gradient, and number of commonly measured compounds. Our study highlights PredRet’s accuracy and ability to transpose RT data acquired from one CS to another CS. We recommend extensive RT data sharing in PredRet by the community interested in plant food bioactive metabolites to achieve a powerful community-driven open-access tool for metabolomics annotation.
1. Introduction
The dark matter in metabolomics refers to the large fraction of mo- lecular signals that are detected with untargeted analyses but remain unidentified. Part of this dark matter corresponds to the food metab- olome. Currently, >26,000 compounds have been described in foods (https://foodb.ca), and upon ingestion and digestion, these food com- ponents are further transformed into various metabolites (Scalbert et al., 2014), many of which are not identified or inventoried yet in databases (Barab´asi, Menichetti, & Loscalzo, 2020). Plant food bioactive com- pounds (also referred as dietary phytochemicals, e.g., (poly)phenols, carotenoids, glucosinolates, alkaloids) and their phase I, -II and gut microbial metabolites represent an important class of the food metab- olome that receive widespread interest for their protective health effects and more recently, for their usefulness as food intake biomarkers. They cover a large chemical space ranging from highly polar to lipophilic compounds, and their identification in untargeted methods remains a challenging feat.
Identification of unknowns in untargeted metabolomics combines multiple types of information and tools, such as matching of exact mass in compound databases, comparison of experimental to reference MSn spectral data and chromatographic retention time (RT) of authentic standards for Metabolomics Standards Initiative (MSI) level I identifi- cation, or to publicly available spectral databases for MSI level II (Sumner et al., 2007). But searches in databases often return an exces- sive number of structurally similar hypotheses (Hall et al., 2018), and purchasing all corresponding standards is not feasible due to limited availability and high cost. In the case of plant food bioactive compounds and their metabolites, identification is further challenged by the lack of commercial standards and the high structural similarity between many isomeric compounds, which makes their MS/MS spectra indistinguishable.
Leveraging orthogonal data such as RT becomes valuable for assist- ing the certainty of identification to MSI levels l and ll, by narrowing the number of plausible hypotheses within an observed RT window. Recent years have seen several approaches to adopt RT prediction models for integration into untargeted analysis workflows with varying degrees of success (McEachran et al., 2018; Witting & Bocker, 2020). Existing types ¨ of RT prediction models include i) simple algorithms based on log P or gradient back-calculation (Boswell, Schellenberg, Carr, Cohen, &
Hegeman, 2011; Abate-Pella et al., 2015), ii) monotonically constrained generalised additive model (GAM) (Stanstrup, Neumann, & Vrhovˇsek, 2015) of retention times and iii) complex in silico quantitative structure- retention relationship (QSSR) models based on combinations of molec- ular descriptors. QSSRs can be built using different machine learning approaches, such as artificial neural network, random forest and support vector regression models (Aalizadeh, Nika, & Thomaidis, 2019;
Domingo-Almenara et al., 2019; Hall et al., 2018; McEachran et al., 2018; Bouwmeester, Martens, & Degroeve, 2020; Naylor, Catrow, Maschek, & Cox, 2019; Bade et al., 2015; Tada et al., 2019; Wolfer et al., 2015). However, these prediction models are limited in their applica- tion, as RT data are specific to one chromatographic system (CS) and the models do not provide accurate predictions outside the trained conditions.
As analytical methods are not harmonised and most laboratories tend
to have their own routine semi-targeted or untargeted LC methods for covering plant food bioactive compounds in various types of matrices (serum, plasma, urine, digestive fluids, food materials), it is ideal that RT prediction models be customisable across CSs. PredRet (Stanstrup et al., 2015) represents an original approach that enables users of the scientific community to benefit from RT data sharing through its open access RT database, and obtain predictions in their own CS if the RT of a compound has been experimentally determined by another user or laboratory. In this aspect, PredRet is relevantly applicable for transposing RTs between CSs differing in mobile phase composition, gradient, flow rate and col- umn dimensions. In the framework of the COST Action POSITIVe (https://www6.inra.fr/cost-positive, FA1403), we evaluated the per- formance of PredRet to predict the RTs of plant food bioactive com- pounds and their metabolites in a multi-laboratory test involving 19 laboratories across Europe, using 24 gradient-based reversed-phase CSs.
We also expanded PredRet database with experimental RTs of 467 plant food compounds.
2. Experimental section 2.1. Chemical compounds
All participating laboratories purchased their own chemicals, differing from one laboratory to another, except that 10 laboratories previously involved in a multiplatform coverage test organised by the COST Action POSITIVe, received two common standard mixtures comprising of 56 plant food bioactive compounds (Koistinen et al., 2018). Synthesised standards (n =49) were accepted in addition to commercial standards, provided that the structure was unambiguously elucidated by NMR and MS/MS spectra and that the compounds are entered in the online platform for food compound exchange, FoodCo- mEx (https://foodcomex.org/). Depending on laboratories, chemicals were analysed in solvent or spiked in biological matrices (urine or plasma). A full list of the 467 analysed compounds is provided in Table S1, with their common name, InChI, IDs in HMDB, FooDB and PhytoHub, taxonomy, chemical structure, formula, monoisotopic mass, predicted logP and the number of CSs where they were analysed.
Experimental RT datasets containing compound name, InChI and/or chemical structure were provided by the involved laboratories. InChIs were used as unambiguous identifiers for recognition of identical com- pounds between CSs and compound names were harmonised across laboratories. For polyphenol metabolites, we applied the new reference KCC nomenclature (Kay et al., 2020). InChIs were either extracted from databases such as PhytoHub (http://phytohub.eu), PubChem (htt ps://pubchem.ncbi.nlm.nih.gov) (Kim et al., 2019), HMDB v4.0 (www.hmdb.ca) (Wishart et al., 2018) or computed from chemical structures using Marvin v19.7, 2019, ChemAxon (https://www.che maxon.com). LogP values were computed using ALOGPS v2.1 (http ://www.vcclab.org/lab/alogps/) (Tetko et al., 2005; VCCLAB, 2005) after conversion of InChIs to SMILES via InChIToSMILES (http://www.
chemspider.com/inchi.asmx) (Pence & Williams, 2010). In PredRet database, the main InChI layer containing chemical formula, atom connections and hydrogen atom sublayers is considered when matching compounds, and information after the main layer (e.g., charge, stereo- chemical and isotopic layers) is ignored.
2.2. Chromatographic systems
Experimental RT data were collected from 24 CSs across 19 labora- tories. These CSs were not intentionally optimised for the RT prediction test but rather represent the routine semi-targeted or untargeted metabolomic methods of the various laboratories. A full description of instrument, column and analytical conditions used in the 24 CSs is provided in Table 1. Overall, 15 C18 reverse-phase (RP) columns from various manufacturers were used with dimensions ranging from 0.5 to 4.6 mm (internal diameter), 50 to 250 mm (length) and 1.6 to 5 μm (particle size). HPLC or UHPLC methods were used in acidic conditions.
Water and acetonitrile acidified with formic acid (0.1–0.9%) or tri- fluoroacetic acid (0.1%) were most commonly used as mobile phases A and B, while three CSs used methanol or acetone as mobile phase B. The gradients utilised in 13 UHPLC methods consisted of linear and multi- phasic slopes with flow rates of 0.4 to 0.6 mL/min and total run times ranging from 6 to 26 min. There were four HPLC methods with multi- phasic slopes with flow rates of 0.015 to 1.5 mL/min and longer run times of 20 to 135 min. Fig. S1 shows the diversity of gradient slopes in the 24 CS.
2.3. Prediction of retention times
Experimentally measured RTs (Table S3) were entered in PredRet for the 467 compounds listed in Table S1. The number of measured RTs by CS varied from 29 in CS9 to 103 in CS14. For each CS, the compound names, InChI and experimentally measured RTs were entered into Pre- dRet web interface (http://predret.org) along with a description of the respective CS method. PredRet is then able to predict RTs for compounds that have not been previously experimentally measured in one CS but have been determined in some other CS. The prediction is achieved by constructing GAMs between all pairs of CSs in the PredRet database using the compounds that were measured in both CSs. Empirical pre- diction intervals (PI) were established via bootstrapping of GAMs, as described in more details by Stanstrup et al (2015). The model providing the prediction with narrowest PI was then used. Predictions were flag- ged as suspicious by the program if the RT is considered potentially incorrect, when the difference between experimental and predicted RTs was ≥twice the distance from the predicted RT to outer limits of the PI.
Predictions were automatically discarded if their PI widths were ≥2 min or ≥20% of the predicted RT. The total number of RT predictions be- tween CSs, as well as accuracy and coverage of PI relative to the total chromatographic run time, were compared.
2.4. Validation of predicted retention times
A validation test was conducted on CSs 1, 2, 4, 5, 14, 18, 19, and 22, which had the highest number of experimental RT values. These eight CSs comprise of UHPLC and UPLC methods varying in LC instrument and gradient, column, mobile phases, flow rate and run time. The experi- mental RT datasets of these CSs were split into training sets (80% data, n
=79, 71, 73, 67, 82, 63, 63, and 78 compounds respectively) and test sets (20% data, n = 20, 18, 18, 17, 21, 16, 16, and 19 compounds respectively). For selection of compounds in the test sets, the datasets were split into three equal sections covering the beginning, middle and end of the chromatographic run, and then 20% of the compounds were randomly selected from the three sections to ensure a uniform distri- bution of RT along the entire chromatographic run. Another criterion was to select, in the test set, the same proportion of unique compounds as in the whole dataset of the selected CSs. Validation of RT predictions for each of the eight selected CSs was performed in conditions where the complete datasets of the remaining 23 CSs were entered into the PredRet database.
3. Results and discussion
3.1. Large diversity of plant food metabolites analysed
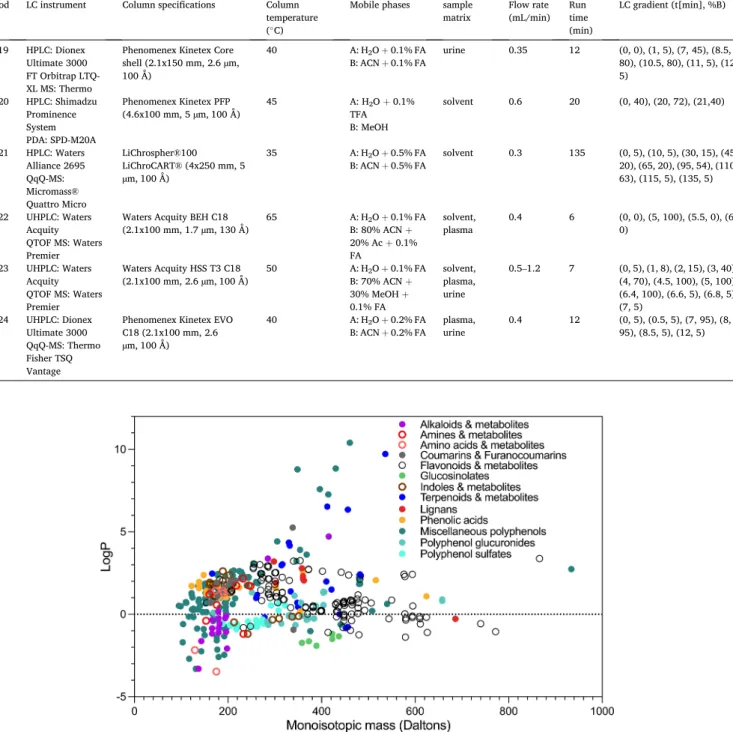
A total of 1583 experimental RT values were collected for 467 plant food compounds or related human metabolites in one or several of the 24 CSs used by the 19 participating platforms. The 467 compounds belong to >30 families including flavonoids (anthocyanins, flavonols, flavones, flavanols, flavanones, isoflavones), phenolic acids, lignans, ellagitannins, coumarins and furanocoumarins, nitrogen-containing compounds (i.e., alkaloids, amines, indoles), glucosinolates, alkylre- sorcinols, thiosulfinates, tocopherols, phytosterols, carotenoids and mono, di-, sesqui- and triterpenoids, and their human metabolites, e.g., glucuronidated and sulfated conjugates, as well as gut microbial me- tabolites. They cover a large chemical space from highly polar to lipo- philic with predicted logP values from –3.48 to 10.40 and with monoisotopic masses from 95.0371 to 934.0712 Da (Fig. 1). The PredRet database is growing continuously with addition of new compounds and associated RT data by registered users. At the time of our experiment, a limited number of plant food compounds was present in PredRet, and our datasets represented a major update for this category of compounds.
The number of CSs in which each compound was analysed is pro- vided in Table S1. Of the 467 entered compounds, 212 were analysed in one CS only, while 4′-hydroxy-3′-methoxycinnamic (ferulic), 4-hydroxy- 3-methoxybenzoic (vanillic), 3,4-dihydroxybenzoic (protocatechuic), 5- O-caffeoylquinic and 4′-hydroxycinnamic (p-coumaric) acids were most commonly measured in 20 of the 24 CSs (Fig. S2). The size of the datasets varied from 29 to 103 experimental RTs. CSs 1, 2, 4, 5, 7, 14, 17, 18, 19, 22, and 23 contained ≥75 RTs, as illustrated by their large node size in Fig. 2, in contrast to CS9 and CS16, which contained the least RT data (29 and 35 RTs, respectively). Across the platforms, CSs 2, 6, 11, 13, and 15 shared the highest compound overlap as evidenced by their highly connected nodes (Fig. 2) while still showing relatively good overlap with CSs 1, 3, 7, 14, 16, 22, and 23. Pairwise clusters of CSs 18–19 and 4–5 were observed as they shared >90% compounds simi- larity, corresponding to two analytical methods from the same platform.
3.2. Retention time prediction coverage and rate
A total of 6382 new RT predictions were obtained for the 24 CSs, with up to 667 predictions for one CS (Table 2 and Fig. S3). Compounds that were entered in PredRet prior to this study (1783 unique com- pounds, ~10% were plant food bioactive compounds) contributed to prediction of additional compounds beyond the 467 compounds entered in this study. We observed a general trend that as more experimental RTs are entered in PredRet, more RT predictions are generated for com- pounds not previously analysed. This is demonstrated in CSs 1, 2, 22, and 23 where 559, 539, 667, and 572 new RT predictions were gener- ated from 98, 89, 97 and 75 compounds entered into PredRet respec- tively (Table 2). However, RT prediction was also dependent on shape (Fig. S1) and type (i.e., UHPLC or HPLC) of the LC gradient as well as number of common compounds shared with other CSs. For example, infrequently used mobile phases may limit the predictability of a CS. The entry of 29 compounds for CS9 was not sufficient to obtain RT pre- dictions. However, despite relatively small RT datasets (35 to 46 com- pounds) were entered for CSs 11, 15 and 16, they had a high prediction rate, explained by a versatile CS and/or good combination of compounds.
3.3. Retention time prediction accuracy
PredRet provided RT predictions for compounds never analysed in the CSs but also for compounds in the entry dataset. We used the latter to compare prediction accuracy between CSs. RT predictions were highly accurate across the 24 CSs, with median prediction errors between 0.03 and 0.76 min (Table 2). As run times vary greatly across CSs (5 to 135
Table 1
Instrument and conditions of chromatographic systems used by participating platforms.
Method LC instrument Column specifications Column temperature (◦C)
Mobile phases sample
matrix Flow rate (mL/min) Run
time (min)
LC gradient (t[min], %B)
U-CS1 UHPLC: Thermo U3000 QTOF MS: Bruker Impact HD2
Waters Acquity HSS T3
(2.1x150 mm, 1.8 µm, 100 Å) 30 A: H2O +0.1% FA B: ACN +0.1% FA solvent,
plasma 0.4 26 (0, 0), (2, 0), (15, 100), (22, 100), (22.1, 0), (26, 0)
U-CS2 UHPLC: Agilent 1290
QTOF MS: Agilent 6540
Agilent Zorbax Eclipse XDB C18 (2.1x100 mm, 1.8 µm, 80 Å)
50 A: H2O +0.1% FA
B: MeOH +0.1%
FA
plasma, 0.4 16.5 (0, 2), (10, 100), (14.5, 100), (14.51, 2), (16.5, 2)
U-CS3 UHPLC: Thermo U3000 QTOF MS: Bruker Impact HD2
Waters Acquity UPLC BEH Shield RP18 (2.1x100 mm, 1.7 µm, 130 Å)
30 A: H2O +0.1% FA
B: ACN +0.1% FA solvent,
urine 0.6 26 (0, 0), (2, 0), (7, 10), (22, 95), (22.1, 0), (26, 0)
U-CS4 UHPLC: Agilent 1290 Infinity QTOF MS: Agilent 6550 iFunnel
Agilent Zorbax Eclipse Plus RRHD (2.1x50 mm, 1.8 µm, 95 Å)
30 A: H2O +0.1% FA
B: ACN +0.1% FA plasma,
urine 0.4 12 (0, 1), (5, 10), (8, 25), (9.1, 99), (10, 99), (12, 1)
U-CS5 UHPLC: Thermo Accela 1250 QTRAP MS:
Thermo Exactive
Agilent Zorbax Eclipse Plus RRHD (2.1x50 mm, 1.8 µm, 95 Å)
30 A: H2O +0.1% FA
B: ACN +0.1% FA plasma,
urine 0.4 12 (0, 1), (5, 10), (8, 25), (9.1, 99), (10, 99), (12, 1)
H-CS6 HPLC: Agilent 1260
QTOF MS: Agilent 6530
Phenomenex Synergi Hydro-
RP (2x150 mm, 4 µm, 80 Å) 30 A: H2O +0.1% FA B: ACN +0.1% FA solvent,
urine 0.5 45 (0, 5), (1, 5), (35, 45), (40, 100), (45, 100)
U-CS7 UHPLC: H-class QTOF MS: Synapt G2 S
Waters Acquity UPLC BEH Shield RP18 (2.1x150 mm, 1.7 µm, 130 Å)
40 A: H2O +0.1% FA
B: ACN +0.1% FA solvent,
urine 0.4 37.1 (0, 5), (30, 50), (31, 100), (37, 100), (37.1, 0) H-CS8 HPLC: Waters
HPLC 2695 PDA: Waters 2996
Interchim Supelcosil LC-18
(4.6x250 mm, 5 µm, 120 Å) 40 A: H2O +0.1%
TFA B: ACN +0.1%
TFA
solvent 1 50 (0,5), (45, 35), (47, 75), (49, 35), (50, 5)
H-CS9 HPLC: Agilent 1200 QTRAP MS: AB Sciex 4000
Phenomenex Kinetex PFP
(4.6x100 mm, 2.6 µm, 100 Å) 35 A: H2O +0.1%
TFA B: ACN +0.1%
TFA
solvent 1.5 32 (0, 1), (7, 7.5), (14, 7.6), (17, 10), (18.5, 12), (20, 12.5), (24, 30), (25, 90), (25.1, 1), (32, 1) H-CS10 HPLC: Waters
Alliance 2695 QTOF MS: Waters Premier
Waters Atlantis T3 (2.1x100
mm, 3 µm, 100 Å) 40 A: H2O +0.1%
TFA B: ACN +0.1%
TFA
solvent 0.3 25 (0, 10), (1, 10), (6, 40), (7, 50), (8, 50), (14, 70), (16, 80), (18, 80), (20, 10), (25, U-CS11 UHPLC: Agilent 10)
1290
QTRAP MS: Sciex 6500
Phenomenex Luna Omega Polar C18 (2.1x100 mm, 1.6 µm, 100 Å)
40 A: H2O +0.5% FA
B: ACN +0.5% FA solvent,
urine 0.5 7 (0, 5), (3, 50), (3.1, 100), (5, 100), (5.1, 5), (7, 5)
U-CS12 UHPLC: Agilent 1290
QTRAP MS: Sciex 6500
Phenomenex Luna Omega Polar C18 (2.1x100 mm, 1.6 µm, 100 Å)
40 A: H2O +0.1% FA
+ 10 mM NH4COOH, B: ACN
solvent,
urine 0.5 14 (0, 5), (8, 20), (10, 100), (12, 100), (12.1, 5), (14, 5)
H-CS13 HPLC: Agilent 1200
QTOF MS: Agilent G6530A
Phenomenex Luna C18
(4.6x150 mm, 3 µm, 100 Å) 25 A: H2O +0.1% FA B: ACN +0.1% FA solvent,
urine 0.5 65 (0, 0), (30, 30), (35, 40), (50, 80), (52, 80), (60, 0), (65, 0)
H-CS14 HPLC: Agilent 1290
QTOF MS: Agilent 6550
Agilent Poroshell 120 EC C18
(3x100 mm, 2.7 µm, 120 Å) 25 A: H2O +0.1% FA B: ACN +0.1% FA solvent,
urine 0.4 30 (0, 5), (10, 25), (20, 40), (24, 90), (25, 90), (26, 5), (30, 5)
H-CS15 HPLC: Eskigent nanoLC QTOF MS: Sciex TripleTOF 6600
Eksigent HALO C18 (0.5x50
mm, 2.7 µm, 90 Å) 35 A: H2O +0.1% FA
B: ACN +0.1% FA solvent,
urine 0.01 16 (0, 5), (12, 95), (14, 95), (16, 5)
H-CS16 HPLC: AB Sciex MicroLC 200 QTOF MS: AB Sciex 6500+
Eksigent HALO C18 (0.5x100
mm, 2.7 µm, 100 Å) 45 A: H2O +0.9% FA
B: ACN +0.9% FA solvent,
urine 0.015 5 (0, 1), (0.5, 1), (4, 95), (4.5, 1), (5, 1)
H-CS17 HPLC: Agilent 1290
QTOF MS: Agilent 6520
Phenomenex Synergi Hydro
(2x250 mm, 4 µm, 80 Å) 25 A: H2O +0.1% FA
B: ACN +0.1% FA solvent 0.2 50.1 (0, 0.5), (7, 0.5), (12, 12.5), (25, 16.3), (47, 35), (48, 65), (50, 65), (50.1, 0.5) U-CS18 HPLC: Dionex
Ultimate 3000 FT Orbitrap LTQ- XL MS: Thermo
Phenomenex Kinetex Core shell (2.1x150 mm, 2.6 µm, 100 Å)
40 A: H2O +0.1% FA
B: ACN +0.1% FA plasma 0.35 15 (0, 0), (1, 0), (12.5, 100), (14, 100), (14.2, 0), (15, 0)
(continued on next page)
min), median prediction errors were also expressed in percentage rela- tive to the total runtime, ranging from 0.3% to 1.8% (CS9 excluded).
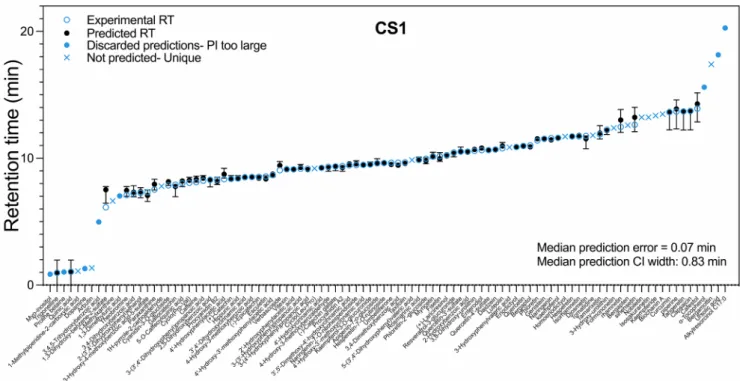
A graph comparing experimental and predicted RTs for compounds of CS1 entry dataset is given in Fig. 3 as an example. Equivalent graphs for all other CSs are provided in Fig. S4. In CS1, accurate predictions with narrow PI were obtained for most compounds with RT ranging between 6.6 and 14.2 min. Predictions for eight compounds (myo- inositol, proline betaine, dopamine, 3,4,5-trihydroxybenzoic acid (gallic acid), 1,3-dimethyluric acid, α-tocopherol, ursolic acid and alkylre- sorcinol C17:0) were discarded by PredRet algorithm as their PI widths were ≥2 min or >20% of the predicted RT. PI width is an important indicator of prediction accuracy as it represents how accurate the pro- jection models are, based on the number of experimentally known RTs in the RT range of compounds that are being projected in the pairwise CS
models (Stanstrup et al., 2015). We observed that predictions were usually missing at the beginning and end of the runs, where there tends to be a low density of known RTs, and conditions are approaching the analytical limits of the CSs (Fig. S5). In CS1, predictions were not generated before the first 1.5 min and after 14 min. For 15 compounds (1-methylpiperidine, arbutin, 1-methylxanthine, 1H-pyrrole-2-carbox- aldehyde, cyclo(Leu-Pro), 5-(3′,4′-dihydroxyphenyl)valeric acid, homoeriodictyol, tomatidine, formononetin, bergapten, nobiletin, iso- sakuranetin, kaempferide, biochanin A, and bergamottin), RT prediction was not expected, as they were not present in any other CS. Globally, PredRet performed well for CS1 with a median prediction error of 0.07 min (0.27% of runtime) and median PI width of 0.83 min. For 77 non- unique compounds entered into PredRet, 559 new predictions for compounds never analysed in this system were obtained, in the range of Table 1 (continued)
Method LC instrument Column specifications Column temperature (◦C)
Mobile phases sample
matrix Flow rate (mL/min) Run
time (min)
LC gradient (t[min], %B)
U-CS19 HPLC: Dionex Ultimate 3000 FT Orbitrap LTQ- XL MS: Thermo
Phenomenex Kinetex Core shell (2.1x150 mm, 2.6 µm, 100 Å)
40 A: H2O +0.1% FA
B: ACN +0.1% FA urine 0.35 12 (0, 0), (1, 5), (7, 45), (8.5, 80), (10.5, 80), (11, 5), (12, 5)
H-CS20 HPLC: Shimadzu Prominence System PDA: SPD-M20A
Phenomenex Kinetex PFP
(4.6x100 mm, 5 µm, 100 Å) 45 A: H2O +0.1%
TFA B: MeOH
solvent 0.6 20 (0, 40), (20, 72), (21,40)
H-CS21 HPLC: Waters Alliance 2695 QqQ-MS:
Micromass®
Quattro Micro
LiChrospher®100 LiChroCART® (4x250 mm, 5 µm, 100 Å)
35 A: H2O +0.5% FA
B: ACN +0.5% FA solvent 0.3 135 (0, 5), (10, 5), (30, 15), (45, 20), (65, 20), (95, 54), (110, 63), (115, 5), (135, 5)
U-CS22 UHPLC: Waters Acquity QTOF MS: Waters Premier
Waters Acquity BEH C18
(2.1x100 mm, 1.7 µm, 130 Å) 65 A: H2O +0.1% FA B: 80% ACN + 20% Ac +0.1%
FA
solvent,
plasma 0.4 6 (0, 0), (5, 100), (5.5, 0), (6, 0)
U-CS23 UHPLC: Waters Acquity QTOF MS: Waters Premier
Waters Acquity HSS T3 C18
(2.1x100 mm, 2.6 µm, 100 Å) 50 A: H2O +0.1% FA B: 70% ACN + 30% MeOH + 0.1% FA
solvent, plasma, urine
0.5–1.2 7 (0, 5), (1, 8), (2, 15), (3, 40), (4, 70), (4.5, 100), (5, 100), (6.4, 100), (6.6, 5), (6.8, 5), (7, 5)
U-CS24 UHPLC: Dionex Ultimate 3000 QqQ-MS: Thermo Fisher TSQ Vantage
Phenomenex Kinetex EVO C18 (2.1x100 mm, 2.6 µm, 100 Å)
40 A: H2O +0.2% FA
B: ACN +0.2% FA plasma,
urine 0.4 12 (0, 5), (0.5, 5), (7, 95), (8, 95), (8.5, 5), (12, 5)
Fig. 1. Chemical space covered by the 467 plant food metabolites entered in PredRet.
1.01 to 14.18 min.
Amongst CS7, CS8, CS9, CS14, CS17, CS20, and CS24, a common trait is the high proportion of rare plant compounds unique to their CSs, which indirectly resulted in a low number of common compounds shared with other CSs. For example, CS7 contained sesquiterpenoids not represented in other CSs, likewise for anthocyanin glycosides in CS8, urolithins and conjugated isoflavone metabolites in CS14, glucosinolates and rare flavonoids in CS17, flavonolignans (e.g., dehydrosilydianin), rare flavonoids and sulfated conjugates in CS20, and urolithins and conjugated flavonoids in CS24. Adding the RTs of these rare plant food compounds and metabolites contributes to the richness of PredRet database; however, a caveat is that these CSs themselves may not receive the benefit of good prediction coverage. In such circumstances, the user is encouraged to include common plant compounds that are also frequently represented in the PredRet database. As an example, we propose a list of 14 compounds frequently analysed in our study (≥67%
of 24 CSs), which covers a wide RT range: 4′-hydroxy-3′-methoxycin- namic acid (ferulic acid), 4-hydroxy-3-methoxybenzoic acid (vanillic acid), 5-O-caffeoylquinic acid, 4′-hydroxycinnamic acid (p-coumaric acid), 3,4-dihydroxybenzoic acid (protocatechuic acid), 3′,4′-dihydrox- ycinnamic acid (caffeic acid), 3,4,5-trihydroxybenzoic acid (gallic acid), 3′,5′-dimethoxy-4′-hydroxycinnamic acid (sinapic acid), (–)-epi- catechin, kaempferol, hippuric acid, luteolin, phloretin, and hesperetin (Table S4).
To further validate the predictive performance of GAM in PredRet, we performed an external validation test on a subset of eight CSs, splitting the experimental datasets into 80% for training sets and 20%
for test sets. The training sets were used to build GAMs between CSs in PredRet database to obtain predictions with PIs for the compounds in the test sets. Predictions were compared to experimental data to obtain the prediction error for each compound (Table S5) and the prediction statistics for each CS are provided in Table S6. Accurate predictions were achieved, with the median prediction error in the test sets ranging from 0.04 to 0.41 min across the eight CSs. The maximum absolute prediction error was 3.55 min for α-tocopherol (CS2), followed by catechol (2.45 min, CS5). It is difficult to compare the performance of PredRet with other RT prediction tools as those only allow predictions within the
same CS, while PredRet predicts RTs from one CS to another CS differing in mobile phase composition, gradient and flow rate.
Despite accurate models being built for the CSs, we observed that early- and late-eluting compounds were generally omitted from pre- dictions, likely due to their extreme polarity. Compounds unique to respective CSs (e.g., nobiletin in CS1, 2′,5′-dihydroxyphenylacetic acid in CS2 and 9-hydroxy-urolithin-3-glucuronide (isourolithin A glucuro- nide) in CS14) did not obtain RT predictions as well as compounds that did not have sufficient RT data density in the RT area (e.g., N-(3- hydroxybenzoyl)glycine (2-furoylglycine) in CS19 and pinoresinol in CS22). Between 14 and 39% of the compounds in the CSs of the vali- dation (test) set had experimental RTs that fall outside the estimated PI, showing that the PIs should be interpreted with caution, as previously noted in the original paper describing PredRet. The practical implication is that a proposed annotation for an experimental RT cannot be completely discarded even if the RT falls outside the proposed annota- tion’s PI. A few limitations of PredRet were identified in our study that may be corrected in the future. Firstly, users have no information about the standards that have been considered for providing predictions in their CS: e.g., commercial or synthesised standard, analysed in solvent or spiked in a biological matrix. Secondly, PredRet algorithm recognises the entered compounds based on the main InChI layer only and there- fore stereochemical information is ignored during RT prediction.
3.4. Application of PredRet predictions for identification of plant food compounds in metabolomic studies
The effectiveness of RT prediction using PredRet allowed the distinction of isomeric compounds. In Fig. 4A, 3-(3′,4′-dihydrox- yphenyl)propanoic (dihydrocaffeic) acid with a predicted RT of 8.3 min (PI: 8.1 to 8.5 min) could be distinguished from its isomers, 4′-hydroxy- 3′-methoxyphenylacetic acid (homovanillic) acid (PI: 8.5 to 9.0 min) and 3,4-dimethoxybenzoic acid (veratric) acid (PI: 9.3 to 9.6 min). In Fig. 4B, the predicted RTs of fisetin (PI: 9.8 to 10.7 min), kaempferol (PI:
11.4 to 12 min) and luteolin (PI: 10.6 to 11.3 min) were also clearly distinguished, except for the narrow overlap in the PIs of luteolin and fisetin (10.6 to 10.7 min). This is particularly useful as an orthogonal parameter to eliminate hypotheses when identifying unknown features with the same m/z in untargeted metabolomics studies. In addition, as RTs of flavonoid conjugates (glycosides, glucuronides) differ from that of their aglycones, prediction of RT may help to distinguish between aglycones truly present in the samples and detected aglycones that are generated during the analysis as in-source fragments of glycosides or glucuronides.
Another useful application of PredRet is aiding in annotation of rare plant food compounds in untargeted metabolomics studies, when the standards are not commercially available or difficult to synthesise. As soon as a user enters experimental data for a rare plant food compound in a CSs, PredRet provides RT prediction with PI for this compound in CSs where it has not been experimentally measured. For example, the contribution of tomatidine’s experimental RT (11.8 min) from CS1 enabled the prediction of RTs in 15 other CSs, while formononetin (CS1), 8-hydroxy-urolithin-3-sulfate (CS14) and 8-deoxylactucin (CS7) enabled the prediction of RTs in 13 other CSs. To optimise this process, it is crucial that users who entered experimental RTs for rare compounds also enter experimental RTs for common compounds such as those suggested above.
4. Conclusion
PredRet, based on pairwise GAMs, was demonstrated to be a useful tool for obtaining a good number and highly accurate RT predictions for plant food bioactive compounds and their metabolites. Its use in untargeted metabolomics studies can definitely help for tentative iden- tification, by eliminating hypotheses that do not fall within the pre- dicted RT range, or when commercial standards are not readily Fig. 2. Network map illustrating compound coverage overlap. Size of node
represents the number of compounds present in the dataset while the thickness and colour of edges represent the number of common compounds between the paired datasets. The thicker the edge, the larger number of common com- pounds. Edge colours and denote low (<10) and high (>60) similarity of compounds, respectively. E: number of RT data entered into PredRet; P:
number of new RT predictions made.
FoodChemistry357(2021)129757
7
Table 2
Statistics of PredRet retention time predictions for 24 liquid chromatographic systems (CSs) with an entry dataset of 467 plant compounds.
Prediction statistics CS 1 CS 2 CS 3 CS 4 CS 5 CS 6 CS 7 CS 8 CS 9 CS
10 CS
11 CS
12 CS
13 CS
14 CS
15 CS
16 CS
17 CS
18 CS
19 CS
20 CS
21 CS
22 CS
23 CS
24
# Experimental RTs (# non-unique compounds)
98 (76) 89 (78) 47
(47) 90 (88) 83
(83) 46 (46) 84
(65) 51 (44) 29
(22) 57 (47) 46
(45) 43 (43) 49
(49) 103 (75) 48
(48) 35 (35) 75
(50) 79 (79) 79
(79) 68 (38) 53
(46) 97 (83) 75
(59) 54 (40)
# Predictions made 623 603 245 323 215 152 157 91 4 309 518 241 131 309 466 314 198 387 366 45 278 744 627 96
# Predictions made where experimental RTs are unknown
559 539 216 262 157 113 111 69 3 272 479 203 100 252 429 286 156 313 293 27 240 667 572 67
Total runtime (min) 26 16.5 26 12 12 45 37.1 50 32 25 7 14 65 30 16 5 50.1 15 12 20 135 6 7 12
Median prediction
error1 (min) 0.07 0.10 0.19 0.12 0.15 0.23 0.41 0.76 NA 0.11 0.04 0.10 0.28 0.19 0.05 0.04 0.52 0.04 0.05 0.36 0.68 0.03 0.03 0.20 Median prediction
error1 (% of total run time)
0.27 0.61 0.73 1.00 1.25 0.51 1.11 1.52 NA 0.41 0.57 0.67 0.43 0.63 0.31 0.80 1.04 0.27 0.25 1.80 0.45 0.50 0.43 1.60
95% percentile prediction error1 (min)
0.39 0.51 0.71 0.41 0.51 0.81 1.66 1.79 NA 0.59 0.20 0.34 3.02 0.43 0.17 0.17 3.29 0.09 0.13 0.74 4.33 0.13 0.20 0.89
Max prediction error2
(min) 0.59 0.88 1.12 0.48 0.78 1.11 2.48 2.15 NA 1.89 0.40 0.38 3.73 0.57 0.36 0.28 4.49 0.13 0.15 0.89 5.37 0.63 0.36 1.12
Median width of 95%
CI 0.83 0.73 1.34 1.22 1.10 1.91 2.15 3.86 NA 1.25 0.47 0.99 2.94 1.54 0.85 0.48 4.67 0.73 0.93 1.69 8.78 0.33 0.56 1.01
95% percentile of
95% CI width (min) 1.97 1.65 2.42 1.92 1.90 4.48 3.61 6.63 NA 1.89 1.74 1.93 6.83 2.65 1.75 1.73 8.52 1.71 1.71 2.69 15.7 1.14 1.58 1.61 Max width of 95% CI
(min) 2.45 1.96 3.33 1.99 2.00 5.43 5.16 7.43 NA 2.10 2.00 2.05 8.92 3.60 1.96 1.97 9.75 2.00 2.00 2.96 17.3 1.90 1.94 1.90
# Flagged
compounds2 0 0 1 0 0 0 0 0 0 0 0 0 0 0 0 0 0 0 0 0 0 0 0 0
1Based on compounds for which the experimental RT is known. NA =non-applicable. 2Compounds are flagged as suspicious by PredRet if the retention time (RT) is considered to be potentially incorrect, when the difference between the experimental RT and predicted RT is ≥twice the distance from the predicted RT to the outer limits of the prediction interval. CI, confidence interval.
Low et al.
available. PredRet predictions are precise enough to distinguish struc- tural isomers. Our data sharing initiative and multi-laboratory study contributed to the expansion of the PredRet database with >1500 experimental RTs in 24 CSs for >467 plant food bioactive compounds and their metabolites (>30 families). Importantly, as more experimen- tally known RTs are entered, more RT predictions are generated and accuracy of the predictions increases. The PredRet database has grown considerably since its introduction and now contains 15,000 RT entries across 68 CSs. Overall, the database covers 4000 unique compounds, beyond plant food bioactive compounds. In comparison, spectral li- braries such as the MassBank of North America (MoNa), contain mass spectra for >200,000 compounds, so there remains a large potential for RT sharing. If sufficiently developed to allow accurate RT prediction in any CSs, PredRet would facilitate comparisons between-studies and minimise the need to develop a consensus LC–MS method for plant food compounds. We thus invite the scientific community to contribute to the community-driven open access PredRet database as part of the global effort for annotation of the dark matter of metabolomes. We suggest that sharing of RT as well as collisional cross section data should be as commonplace in the future as sharing of MS/MS data to provide enough
orthogonal data for unambiguous identification in metabolomics.
CRediT authorship contribution statement
Dorrain Yanwen Low: Conceptualization, Formal analysis, Inves- tigation, Visualization, Data curation, Writing - original draft, Supervi- sion. Pierre Micheau: Software, Formal analysis, Investigation, Visualization, Data curation, Writing - review & editing. Ville Mikael Koistinen: Resources, Writing - review & editing. Kati Hanhineva:
Resources, Writing - review & editing. Laszl´ o Abrank´ ´o: Resources, Writing - review & editing. Ana Rodriguez-Mateos: Resources, Writing - review & editing. Andreia Bento da Silva: Resources, Writing - review
& editing. Christof van Poucke: Resources, Writing - review & editing.
Conceiçao Almeida: Resources, Writing - review ˜ & editing. Cristina Andres-Lacueva: Resources, Writing - review & editing. Dilip K. Rai:
Resources, Writing - review & editing. Esra Capanoglu: Resources, Writing - review & editing. Francisco A. Tom´as Barber´an: Resources, Writing - review & editing. Fulvio Mattivi: Resources, Writing - review
& editing. Gesine Schmidt: Resources, Writing - review & editing.
Gozde Gürdeniz: ¨ Resources, Writing - review & editing. Kateˇrina Fig. 3. Retention time (RT) prediction accuracy and coverage of 98 compounds with experimentally known RTs in Chromatographic System (CS) 1. Refer to Supporting Information Tables 3 and 4 for more details of individual compounds.
Fig. 4.Retention time (RT) prediction for isomers A) 3,4-dimethoxybenzoic (veratric acid), 4′-hydroxy-3′-methoxyphenylacetic (homovanillic) acid and 3-(3′,4′- dihydroxyphenyl)propanoic (dihydrocaffeic) acid, and B) kaempferol, luteolin and fisetin in CS1. Coloured areas represent the prediction interval width.
Valentova: Resources, Writing - review ´ & editing. Letizia Bresciani:
Resources, Writing - review & editing. Lucie Petr´askov´a: Resources, Writing - review & editing. Lars Ove Dragsted: Resources, Writing - review & editing. Mark Philo: Resources, Writing - review & editing.
Marynka Ulaszewska: Resources, Writing - review & editing. Pedro Mena: Resources, Writing - review & editing. Raúl Gonz´alez-Domí- nguez: Resources, Writing - review & editing. Rocío Garcia-Villalba:
Resources, Writing - review & editing. Senem Kamiloglu: Resources, Writing - review & editing. Sonia de Pascual-Teresa: Resources, Writing - review & editing. Stephanie Durand: ´ Resources, Writing - review & editing. Wieslaw Wiczkowski: Resources, Writing - review &
editing. Maria Ros´ario Bronze: Resources, Writing - review & editing.
Jan Stanstrup: Conceptualization, Software, Formal analysis, Investi- gation, Data curation, Writing - review & editing. Claudine Manach:
Conceptualization, Formal analysis, Investigation, Visualization, Data curation, Writing - original draft, Supervision.
Declaration of Competing Interest
The authors declare that they have no known competing financial interests or personal relationships that could have appeared to influence the work reported in this paper.
Acknowledgements
The authors acknowledge networking support by the European Cooperation in Science and Technology (COST) Action FA 1403 POSI- TIVe (Interindividual Variation in Response to Consumption of Plant Food Bioactives and Determinants Involved). Dorrain Low has received the support of EU H2020 in the framework of the FP7-Marie Curie- COFUND People Programme, through award of the AgreenSkills+ Fellowship (grant number 609398) and Nanyang Technological Uni- versity, Singapore, through award of the Presidential Postdoctoral Fellowship (grant number 001991-00001). The MetaboHUB French infrastructure has supported the INRAE platform (PFEM, MetaboHUB- Clermont) involved in this work (grant number ANR-INBS-0010).
Kateˇrina Valentova and Lucie Petr´ ´askova acknowledge financial sup-´ port from the Czech Science Foundation (grant number 19-00043S). The Faculty of Pharmacy of Lisbon University acknowledges FUNDAÇAO ˜ PARA A CIˆENCIA E TECNOLOGIA and PORTUGAL 2020 for financial support of the Portuguese Mass Spectrometry Network (grant number LISBOA-01-0145-FEDER-402-022125). Kati Hanhineva and Ville Kois- tinen have received funding from the Academy of Finland (grant numbers 277986 and 312550), Lantm¨annen Foundation and EU H2020 FP7-Marie Curie-COFUND MoRE Programme (grant number 754412).
Biocenter Finland has financially supported the LC-MS metabolomics unit of University of Eastern Finland. Cristina Andres-Lacueva and Raúl Gonz´alez-Domínguez thank CIBERFES and ISCIII projects AC19/00111 and AC19/00096 (co-funded by FEDER Program from EU, “A way to make Europe”), Generalitat de Catalunya’s Agency AGAUR (grant number 2017SGR1546), “Juan de la Cierva” program from MINECO (grant number IJC2019-041867-I) and ICREA Academia award 2018.
Francisco A. Tom´as-Barber´an has received financial support from the Spanish National Research program (grant numbers AGL-2015-73107- EXP/AEI, CSIC 201870E014) and Fundaci´on Seneca Regi´on de Murcia (grant number 19900/GERM/15). Gesine Schmidt acknowledges sup- port through the Norwegian Agriculture and Food Industry Research Funds (grant number 262300). Lars Dragsted and Jan Stanstrup thank the Carlsberg Foundation for a Semper Ardens grant to support this work. Laszl´ o Abrank´ ´o acknowledges the Hungarian Academy of Sci- ences for the Janos Bolyai Scholarship, and support of the EU and ESF ´ co-financed project of SZIU (grant number EFOP-3.6.3-VEKOP-16-2017- 00005). Sonia de Pascual-Teresa thanks the Spanish MINECO for financial support (grant number AGL2016-76832-R). Dilip K. Rai ac- knowledges Teagasc for the financial support through the Walsh Fellowship (grant number 2016038).
Appendix A. Supplementary data
Supplementary data to this article can be found online at https://doi.
org/10.1016/j.foodchem.2021.129757.
References
Aalizadeh, R., Nika, M.-C., & Thomaidis, N. S. (2019). Development and application of retention time prediction models in the suspect and non-target screening of emerging contaminants. Journal of Hazardous Materials, 363, 277–285. https://doi.org/
10.1016/j.jhazmat.2018.09.047.
Abate-Pella, D., Freund, D. M., Ma, Y., Sim´on-Manso, Y., Hollender, J., Broeckling, C. D.,
… Boswell, P. G. (2015). Retention projection enables accurate calculation of liquid chromatographic retention times across labs and methods. Journal of
Chromatography A, 1412, 43–51. https://doi.org/10.1016/j.chroma.2015.07.108.
Bade, R., Bijlsma, L., Miller, T. H., Barron, L. P., Sancho, J. V., & Hern´andez, F. (2015).
Suspect screening of large numbers of emerging contaminants in environmental waters using artificial neural networks for chromatographic retention time prediction and high resolution mass spectrometry data analysis. Science of the Total Environment, 538, 934–941.
Barabasi, A.-L., Menichetti, G., & Loscalzo, J. (2020). The unmapped chemical ´ complexity of our diet. Nature Food, 1(1), 33–37. https://doi.org/10.1038/s43016- 019-0005-1.
Boswell, P. G., Schellenberg, J. R., Carr, P. W., Cohen, J. D., & Hegeman, A. D. (2011).
Easy and accurate high-performance liquid chromatography retention prediction with different gradients, flow rates, and instruments by back-calculation of gradient and flow rate profiles. Journal of Chromatography A, 1218(38), 6742–6749. https://
doi.org/10.1016/j.chroma.2011.07.070.
Bouwmeester, R., Martens, L., & Degroeve, S. (2020). Generalized calibration across liquid chromatography setups for generic prediction of small-molecule retention times. Analytical Chemistry, 92(9), 6571–6578. https://doi.org/10.1021/acs.
analchem.0c0023310.1021/acs.analchem.0c00233.s001.
Domingo-Almenara, X., Guijas, C., Billings, E., Montenegro-Burke, R., Uritboonthai, W., Aisporna, A., … Siuzdak, G. (2019). The METLIN small molecule dataset for machine learning-based retention time prediction. Nature Communications, 10(5811), 1–9.
https://doi.org/10.1038/s41467-019-13680-7.
Hall, L. M., Hill, D. W., Bugden, K., Cawley, S., Hall, L. H., Chen, M.-H., & Grant, D. F.
(2018). Development of a reverse phase HPLC retention index model for nontargeted metabolomics using synthetic compounds. Journal of Chemical Information and Modeling, 58(3), 591–604.
Kay, C. D., Clifford, M. N., Mena, P., McDougall, G. J., Andres-Lacueva, C., Cassidy, A., … Crozier, A. (2020). Recommendations for standardizing nomenclature for dietary (poly)phenol catabolites. The American Journal of Clinical Nutrition, 112(4), 1051- 1068. doi: 10.1093/ajcn/nqaa204.
Kim, S., Chen, J., Cheng, T., Gindulyte, A., He, J., He, S., … Bolton, E. E. (2019).
PubChem 2019 update: improved access to chemical data. Nucleic Acids Research, 47, 1102-1109. doi: 10.1093/nar/gky1033.
Koistinen, V. M., da Silva, A. B., Abrank´o, L., Low, D., Villalba, R. G., Barber´an, F. T., … Bronze, M. R. (2018). Interlaboratory coverage test on plant food bioactive compounds and their metabolites by mass spectrometry-based untargeted metabolomics. Metabolites, 8(3), 46. https://doi.org/10.3390/metabo8030046.
McEachran, A. D., Mansouri, K., Newton, S. R., Beverly, B. E. J., Sobus, J. R., &
Wiliiams, A. J. (2018). A comparison of three liquid chromatography (LC) retention time prediction models. Talanta, 182, 371–379. https://doi.org/10.1016/j.
talanta.2018.01.022.
Naylor, B., Catrow, L., Maschek, A., & Cox, J. (2019). QSRR automator: A tool for automating retention time prediction in lipidomics and metabolomics. Metabolites, 10(237), 1–15. https://doi.org/10.3390/metabo10060237.
Pence, H. E., & Williams, A. (2010). ChemSpider: An online chemical information resource. Journal of Chemical Education, 87(11), 1123-1124. doi: 10.1021/
ed100697w.
Scalbert, A., Brennan, L., Manach, C., Andres-Lacueva, C., Dragsted, L. O., Draper, J., … Wishart, D. S. (2014). The food metabolome: a window over dietary exposure.
American Journal of Clinical Nutrition, 99(6), 1286-1308.
Stanstrup, J., Neumann, S., & Vrhovˇsek, U.k. (2015). PredRet: Prediction of retention time by direct mapping between multiple chromatographic systems. Analytical Chemistry, 87(18), 9421–9428. https://doi.org/10.1021/acs.analchem.5b02287.
Sumner, L., Amberg, A., Barrett, D., Beale, M. H., Beger, R., Daykein, C. A., … Viant, M. R. (2007). Proposed minimum reporting standards for chemical analysis Chemical Analysis Working Group (CAWG) Metabolomics Standards Initiative (MSI). Metabolomics, 3(3), 211–221. https://doi.org/10.1007/s11306-007-0082-2.
Tada, I., Tsugawa, H., Meister, I., Zhang, P., Shu, R., Katsumi, R., … Chaleckis, R. (2019).
Creating a reliable mass spectral-retention time library for all ion fragmentation- based metabolomics. Metabolites, 9(11), 251. https://doi.org/10.3390/
metabo9110251.
Tetko, I. V., Gasteiger, J., Todeschini, R., Mauri, A., Livingstone, D., Ertl, P., … Prokopenko, V. V. (2005). Virtual computational chemistry laboratory – Design and description. Journal of Computer-Aided Molecular Design, 19(6), 453–463. https://doi.
org/10.1007/s10822-005-8694-y.
VCCLAB. (2005). Virtual Computational Chemistry Laboratory. Retrieved from: http://
www.vcclab.org Accessed.
Wishart, D. S., Feunang, Y. D., Marcu, A., Guo, A. C., Liang, K., V´azquez-Fresno, R., … Scalbert, A. (2018). HMDB 4.0: the human metabolome database for 2018. Nucleic Acids Research, 46, 608-617. https://doi.org/10.1093/nar/gkx1089.
Witting, M., & B¨ocker, S. (2020). Current status of retention time prediction in metabolite identification. Journal of Separation Science, 43(9-10), 1746–1754.
https://doi.org/10.1002/jssc.v43.9-1010.1002/jssc.202000060.
Wolfer, A. M., Lozano, S., Umbdenstock, T., Croixmarie, V., Arrault, A., & Vayer, P.
(2015). UPLC-MS retention time prediction: A machine learning approach to metabolite identification in untargeted profiling. Metabolites, 12(8), 1–13.