https://doi.org/10.1007/s11030-021-10343-y ORIGINAL ARTICLE
Analysis of the uncharted, druglike property space by self‑organizing maps
Gergely Takács1,2 · Márk Sándor2 · Zoltán Szalai2 · Róbert Kiss2 · György T. Balogh1,3
Received: 4 June 2021 / Accepted: 15 October 2021
© The Author(s) 2021
Abstract
Physicochemical properties are fundamental to predict the pharmacokinetic and pharmacodynamic behavior of drug can- didates. Easily calculated descriptors such as molecular weight and logP have been found to correlate with the success rate of clinical trials. These properties have been previously shown to highlight a sweet-spot in the chemical space associated with favorable pharmacokinetics, which is superior against other regions during hit identification and optimization. In this study, we applied self-organizing maps (SOMs) trained on sixteen calculated properties of a subset of known drugs for the analysis of commercially available compound databases, as well as public biological and chemical databases frequently used for drug discovery. Interestingly, several regions of the property space have been identified that are highly overrepresented by commercially available chemical libraries, while we found almost completely unoccupied regions of the maps (commer- cially neglected chemical space resembling the properties of known drugs). Moreover, these underrepresented portions of the chemical space are compatible with most rigorous property filters applied by the pharma industry in medicinal chemistry optimization programs. Our results suggest that SOMs may be directly utilized in the strategy of library design for drug discovery to sample previously unexplored parts of the chemical space to aim at yet-undruggable targets.
Graphic abstract
Keywords Self-organizing maps · Compound libraries · Physicochemical properties · Chemical space · Druglikeness
Introduction
The selection of molecules based on calculated properties (a.k.a. virtual screening) is a fundamental approach which is widely applied at various stages of drug discovery to reduce its costs and time consumption. Such methods run calcula- tions/simulations on a digital representation of a molecule vs. running real experiments on the physical sample. A large number of molecular representations/descriptors have been
* Róbert Kiss rkiss@mcule.com
* György T. Balogh
balogh.gyorgy@vbk.bme.hu
Extended author information available on the last page of the article
reported that capture some key features of the molecules that may be relevant at different stages of the drug discovery pro- cess [1–9] These descriptors widely vary in their accuracy (correlation with experimental results), and their prediction method in terms of cost and time demands.
Most drug targets have some unique characteristics that can be used to define the structural/property space of com- pounds with selective inhibitory/agonist effects. On the other hands, orally administered drugs typically share some com- mon properties that correlate with a desirable ADMET pro- file. Physicochemical properties are of outstanding impor- tance as they have been shown to highly correlate with the pharmacokinetic (PK) profile of drug and drug-like com- pounds. In their landmark paper, Lipinski et al. [1] showed that a few simple rules based on physicochemical properties (rule-of-five, Ro5) can effectively select compounds for drug availability, especially in terms of PK; thus, the concept of druglikeness has been born. Since most of these properties can be calculated very cost- and time-efficiently, they can be easily integrated into any drug discovery workflow aim- ing for an orally available drug. Since the publication of Ro5 many similar rules and algorithm has been developed to further improve such property-based filters focusing on different approaches (e.g., fragments) [10], stages of devel- opment (e.g., lead-likeness) [11, 12] and the physiological compartment of the target (e.g., MPO for CNS drug develop- ment) [13]. While the effect of individual physicochemical properties and their linear combinations on the PK profile of molecules have been extensively studied, there has been less published analysis on more complex property profiles.
For example, Ro5, Ro3 [10] and Pfizer’s CNS MPO [14], three widely used parameters derived from physicochemi- cal properties assume that the desirability of the individual properties does not depend on each other. In other words, the desirable and undesirable property ranges are defined indi- vidually, and thus, they are independent. As a consequence, two unfavorable properties can never have a favorable con- tribution to the Ro5, Ro3 or MPO combined parameters. As an example, if compound “A” has unfavorable lipophilicity (logP > 5) and compound “B” has an unfavorable number of H-bond acceptors (HBA > 10), compound C with logP > 5 and HBA > 10 will be—by definition—unfavorable. How- ever, there might be certain property combinations that do not pass Ro5 but are still favored and thus they are worth to explore. In fact, there is a significant number of approved, orally administered drugs which are beyond Ro5. Moreover, there are several explanations for physicochemical properties that allow these drugs to compensate for their unfavorable properties including the formation of intramolecular hydro- gen bonding and macrocyclization [15], 16. Consequently, for the analysis of drugs in property space, it is more ade- quate to apply approaches and methods that can effectively capture unusual, but favorable property combinations too
[17]. This could potentially lead to the discovery of novel ligands against difficult targets currently considered as undruggable [18–20].
Some methods that are capable of identifying complex property profiles include self-organizing maps (SOM) [21–23], principal component analysis (PCA) [24], genera- tive topographical mapping (GTM) [25] stochastic neighbor embedding (SNE) [26], etc.
All of these methods have been already applied in some context to chemical space navigation/chemography; how- ever, the majority of these studies have been focusing on structural patterns and motifs.
Since physicochemical properties are fundamental in pre- dicting pharmacological properties and are widely used for classification and filtering datasets, our aim was to carry out a comprehensive analysis and examine the purchasable compound libraries in the physicochemical space and check if there are significant underrepresented/overrepresented regions. As a common and easily interpretable dimension reduction algorithm, we have chosen to use self-organizing maps. SOMs are classified as machine learning algorithms.
They were introduced by Kohonen et al. [21] and since then they have been applied for chemical space navigation, dis- crimination of libraries for various targets based on a variety of structural elements or properties [27–34] It is a widely known method that is easily interpretable and visualizable.
To the best of our knowledge, however, SOMs have not been applied for the analysis and comparison of various supplier catalogs and thereby for the exploration and exploitation of currently unpopulated parts of the purchasable and drug- like chemical space using physicochemical properties as descriptors. The approach of SOM is completely transparent compared to deep neural networks in the sense that no hid- den layers or various weighting methods are applied. Con- sequently, they can be easily applied for data representation and visualization. Initially, random property values for all analyzed properties are assigned to each point (neuron) of the 2-dimensional map. In each iteration, one element of the training dataset is paired to the neuron with the lowest Euclidian distance from the current element, and the paired neuron and its neighborhood are adjusted to become more similar to that element (learning). The pairing and learn- ing steps are executed multiple times for the training set, while both the learning rate (modifying coefficient) and the learning distance (size of the neighborhood) are gradually decreased. In the resulting map, the elements of the training set are homogeneously distributed. Any new datasets to be analyzed can be placed onto the map, where each element of the dataset will be assigned to the most similar point of the map (i.e., the point with the lowest Euclidian distance from the element). Some of the key advantages of SOMs include that they can be applied to a large number of vari- ables, and they represent the physicochemical property space
as a continuous, easily interpretable and intuitive map with- out any data loss. These characteristics made it the method of choice for our purposes compared to PCA, GTM or SNE.
Nevertheless, some more complex models and algorithms may also be suitable for our goals, but they would come at a cost of losing some level of interpretability and transpar- ency—in comparison to self-organizing maps.
In SOM, the neurons of the maps represent complex prop- erty profiles unlike the simple linear combinations such as Ro5, and thus, they should be able to identify unusual but druglike physicochemical property concurrences that might enable the targeting of yet-undruggable sites. For example, there are a lot of allosteric sites on macromolecules that are yet unexplored, and it has been shown that such sites accom- modate molecules with different pharmacokinetic profiles compared to those binding to orthosteric sites. In particular, allosteric ligands represent one of the most promising strat- egies to target kinases and GPCRs selectively [35]36. The shortages of chemical space characterization by MPO, Ro5 and similar approaches are reflected by several known drugs with unusual and complex property profiles filtered out by such filters [37]1516.
Numerous articles have been published in the last decades that aimed to develop a method that is capable to navigate in chemical space and identify unpopulated parts. The major- ity of these studies applied novel or enhanced algorithms and presented a few representative examples of such under- represented or very unique chemical space areas. [38–40]
For example, Zabolotna et al. concluded that a few struc- tural elements are common in the overpopulated parts (e.g., amides and sulfonamides) but found no difference between tangible and in-stock libraries [41]. The studies used dif- ferent databases (ChEMBL, PubChem [42]) and compared different even more libraries (ChEMBL, PubChem, GDB [43], etc.); thus, they are difficult to compare. Nevertheless, their findings suggest that the analyzed databases represent a significant heterogeneity that could be potentially exploited in ligand design.
In this study, we analyzed two main types of compound sources in physicochemical property space: (i) compounds with reported bioactivity data primarily generated during drug discovery and (ii) commercially available compounds primarily designed for drug discovery. In particular, we chose sixteen physicochemical properties widely applied for library filtering by the pharmaceutical industry. SOMs were developed to homogeneously represent approved drugs in this property space. The analysis of the distributions led to the identification of underrepresented regions that resem- ble the property profile of approved drugs that were rigor- ously filtered by and thus compatible with Ro5 and further medicinal chemistry filters. Our findings reveal that a sig- nificant portion of the chemical space that is compatible with all rigorous property filters is still underrepresented by
commercially available libraries. The developed SOMs can be directly utilized in the chemical library design for drug discovery, and thus, they provide a useful tool for research groups as well as chemical suppliers to exploit unidentified but potentially drug-like chemical spaces.
Results and discussion
There is an ongoing debate on whether Ro5 or similar phys- icochemical property-based parameters should be applied and at which stage of drug discovery. On one hand, such filters can be extremely useful to minimize PK and toxicity issues during development, and thus, in case, there are a sufficient number of hits/leads it is suggested to prioritize them by such criteria. On the other hand, since pharmaco- dynamics (PD) behavior cannot be adequately described by just a few simple rules of thumbs, the application of such filters inevitably results in false negatives and false positives.
While the false negatives are typically not considered as a major drawback of the application of Ro5, false positives are frequently interpreted as lost opportunities by opponents.
In our study, we analyzed the distribution of the following four chemical databases in the multidimensional property space of sixteen physicochemical properties using SOMs:
the bioactivity database of ChEMBL [44] (version 23), the stock (Supplier #1 stock) and virtual (Supplier #2 virtual) databases of one of the largest chemical suppliers and the stock database of a chemical marketplace that integrates multiple supplier catalogs (Mcule stock [45]). We used the DrugBank [46] database of approved drugs as a reference to identify under- and overrepresented regions of the chemi- cal space. First, we filtered all databases by Ro5 (Table S1) as well as by a more rigorous property filtering workflow (referred as Strict filter (Table S1) below) developed based on the instructions of large pharmaceutical companies. The primary aim of the Strict filter was to minimize compounds with any unsuitable properties or liabilities that can lead to issues during optimization.
Although a significant portion of approved drugs (1248 with min two violations and 2377 with min one violation) is filtered out by Ro5 (Table 1), the majority of them are not orally administered drugs, and therefore, they are not con- sidered as false positives. The ratio of filtered compounds is even larger in case of the Strict filter (Fig. 1c and d). Appar- ently, this filter has a lot of false positives (only 9.7% of approved drugs survived the filtering). Nevertheless, the aim of such a filter is to minimize the vast number of purchasable compounds to be acquired by a pharma company to the most valuable ones with minimized risk of an undesired ADMET profile. Altogether, 90% of approved drugs failed on at least one of the Strict filter rules. Interestingly, while the elimi- nation rate by Strict filter in DrugBank and ChEMBL was
relatively high (90% and 86%, respectively), a significantly smaller portion of the Supplier #1 stock (66%), Supplier #1 virtual (66%) and Mcule stock (71%) were discarded sug- gesting the adaptation of supplier catalogs to the require- ments of the pharma industry.
In fact, supplier catalogs are frequently filtered against criteria such as molar mass, polar surface area (PSA), H-bond acceptors (HBA), and H-bond donors (HBD). Con- sequently, there is a significantly lower elimination rate of these filters in the Supplier #1 stock, Supplier #1 virtual and Mcule stock libraries. The four property filters that elimi- nated the largest portion of approved drugs are as follows (elimination rates in %): minimum number of aliphatic rings (47%), maximum of logP (37%), maximum of PSA (29%) and maximum number of chiral centers (26%). Interestingly, the aliphatic ring filter showed a significantly larger elimi- nation rate of approved drugs vs. other libraries suggesting that although there is a trend for a higher preference for aliphatic vs. aromatic rings by the pharma industry, this is not a requirement for drug approval. Nevertheless, planar (aromatic, low fsp3) compounds tend to aggregate and to be identified as false positives in, e.g., cell-based screening assays, and thus, their exclusion is justified by the associated higher risk [47]. Similarly, the higher elimination rate of the maximum number of chiral centers filter in the approved drug library indicates that higher number of chiral centers does not imply a higher chance for failure in clinical tri- als, but the separation of the different stereoisomers makes the medicinal chemistry optimization more difficult. The strongest three filters of the commercial libraries and their elimination rates are as follows: minimum number of ali- phatic rings (Supplier #1 stock: 39%, Supplier #1 virtual:
32%, Mcule stock: 39%), maximum of logP (Supplier #1 stock: 35%, Supplier #1 virtual: 40%, Mcule stock: 44%) and the minimum fraction of sp3 carbon atoms (Supplier
#1 stock: 18%, Supplier #1 virtual: 8%, Mcule stock: 23%).
The high numbers for the aliphatic ring and fsp3 filters sug- gest that the industry is still in the process to adapt to the recent trend of favoring compounds with more pronounced 3D characteristics. Nevertheless, the high elimination rate of logP is surprising after the decades of the publication of Ro5 and several other studies [48]49 highlighting the correlation
of high lipophilicity with promiscuity (unspecific binding) and toxicity issues. It has to be mentioned that the absolute value of the elimination rate of max. logP was the highest in ChEMBL (59%) compared to the other libraries (Sup- plier #1 stock (35%), Supplier #1 virtual (40%), Mcule stock (44%) and DrugBank (37%)) (Fig. 1c). A similar trend was observed for the logP filter in case of Ro5 (Fig. 1a). This suggests that approved drugs indeed have a sweet-spot for logP, while ChEMBL database contains a higher number of
“tool” compounds with a less favorable PK profile but still sufficient for target validation.
It is important to mention that the commercially available compounds have not been exclusively designed for drug dis- covery and thus can serve multiple purposes. Nevertheless, drug discovery represents currently the largest market for chemical libraries, and thus, it is the main driving force of the chemical library provider industry. Another important factor that may have affected our results and analysis is that there is no standard calculation of certain properties that may partially explain, e.g., the large number of compounds discarded due to high logP.
After the analysis of the property filters, our primary goal was to investigate whether the chemical space compatible with the Strict filter (i.e., interest of the pharma industry) still contains significant unexploited regions. If it does, such regions are of high potential as they represent compounds with a minimal chance for undesired pharmacokinetics, and thus, they should be pursued with higher priority over-fil- tered out ones. If it does not, the results suggest that strict property filters may need to be softened in order to improve the sampling of unexplored portions of the property space. It is important to mention that the chemical space filtered out by Strict filter should still contain numerous potential drug candidates; however, they have a higher risk of failure in medicinal chemistry optimization. Consequently, the inten- tion of our analysis was not to cover the complete chemical space of drugs, but to focus on a subset with the lowest risk, i.e., to minimize false positives.
We trained a self-organizing map (SOM) using the prop- erties of approved drugs filtered by Strict filter. This resulted in a map where the drugs were homogeneously distributed, and their calculated physicochemical properties formed
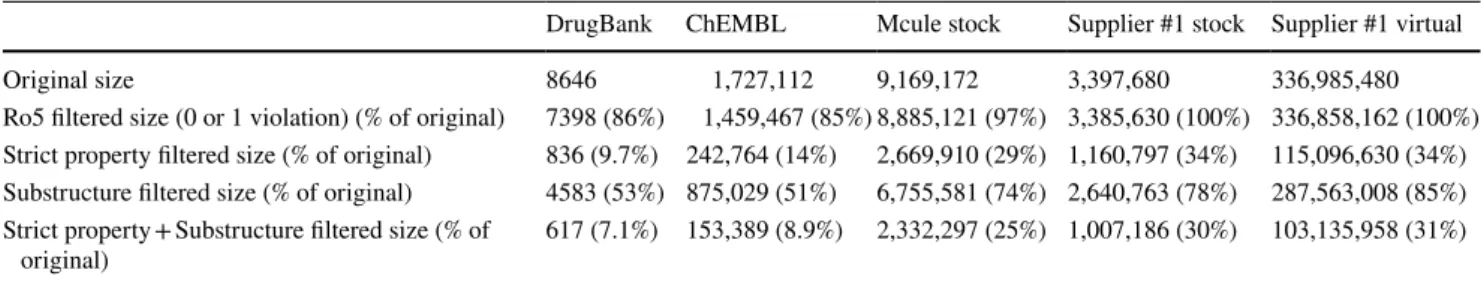
Table 1 Size of the unfiltered and filtered databases by Ro5, Strict property filter, substructural SMARTS and Lilly filters and their combination DrugBank ChEMBL Mcule stock Supplier #1 stock Supplier #1 virtual
Original size 8646 1,727,112 9,169,172 3,397,680 336,985,480
Ro5 filtered size (0 or 1 violation) (% of original) 7398 (86%) 1,459,467 (85%) 8,885,121 (97%) 3,385,630 (100%) 336,858,162 (100%) Strict property filtered size (% of original) 836 (9.7%) 242,764 (14%) 2,669,910 (29%) 1,160,797 (34%) 115,096,630 (34%) Substructure filtered size (% of original) 4583 (53%) 875,029 (51%) 6,755,581 (74%) 2,640,763 (78%) 287,563,008 (85%) Strict property + Substructure filtered size (% of
original) 617 (7.1%) 153,389 (8.9%) 2,332,297 (25%) 1,007,186 (30%) 103,135,958 (31%)
cliffs and valleys (see the distribution of each property in Figure S1. in Supporting Information).
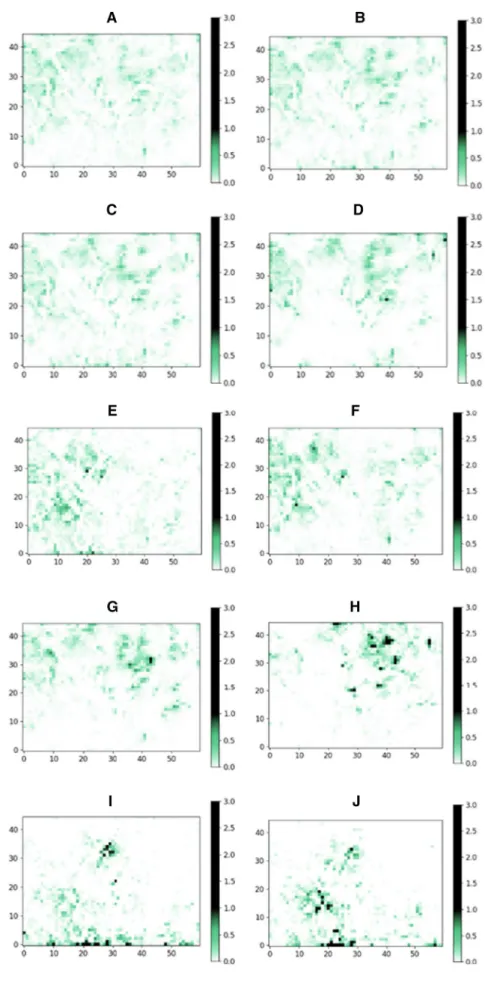
Ten libraries were chosen for this analysis: six supplier’s stock catalogs and one supplier’s virtual catalog, the data- base of Mcule (chemical marketplace) and ChEMBL (bioac- tivity database). Each library was filtered by Strict filter, and the remaining compounds were placed onto the SOM trained by the approved drugs set prefiltered by Strict filter. In case of the ideal sampling of the property space, we expect a homogenous distribution of the molecules. The distributions, however, were found to be surprisingly heterogeneous: The majority of the maps were largely underrepresented (white) and some largely overrepresented regions (black, dark green) could be identified (Fig. 2). These results suggest that there are many, druglike property profiles that are currently under- represented in the purchasable chemical space. These yet- unexplored regions might contain ligands for those targets that require novel and uncommon approaches to target. Such regions of the chemical space comply with all the strictest pharma industry criteria and therefore represent an oppor- tunity for drug discovery. The individual distributions of supplier catalogs showed heterogeneity to a different extent.
We introduced map heterogeneity score to characterize and quantify the heterogeneity of the individual databases and their regions calculated as the number of largely overrepre- sented (average number of molecules per grid point *5) and largely underrepresented (average number of molecules per grid point / 5) regions (grid points) divided by the number of all grid points (Table 2).
The most homogenous distribution (representing the most heterogenous library) was observed for ChEMBL, a collection of compounds described in scientific publications generated by a large number of independent research groups worldwide. This was also reflected in the lowest map het- erogeneity score. In case of ChEMBL, only 66 grid points were overrepresented containing only 15% of the molecules of the whole database. Furthermore, we identified only 766 grid points (containing 28% of the molecules) as underrepre- sented. ChEMBL was followed by the commercial chemical marketplace database (Mcule stock) in line with expecta- tions that the combination of supplier catalogs yields a more diverse representation of the chemical space compared to single supplier catalogs (Fig. 3). The number of drug mol- ecules residing in these regions represent 23% (195) of all drugs used to build the corresponding SOM.
The least diverse libraries were identified among the sup- pliers’ individual catalogs, which may be reasoned by the fact that suppliers typically synthesize several analogs for the same scaffold for individual projects; thus, such com- pounds may be less diverse compared to, e.g., ChEMBL.
Furthermore, suppliers are working under time pressure and thus fewer step, robust reactions, cost-effective synthesis and availability of stock building blocks are critical for them to
fulfill orders on time. On the other hands, these factors may have a negative impact on the in-house chemical diversity [50]. Interestingly, the analyzed virtual catalog of Supplier
#1 showed less diversity and a more heterogeneous distri- bution over the map with highly overrepresented regions compared to the stock catalog of Supplier #1. This may be reasoned by the fact that while such enumerated virtual libraries can result in magnitudes higher number of poten- tially synthesizable molecules, they are based on a limited set of building blocks and reaction rules. Thus, their diver- sity is limited at least when compared to the same supplier’s stock catalog. Nevertheless, the analyzed virtual library of Supplier #1 was still more diverse than the majority of the other supplier’s analyzed stock libraries. Interestingly, we could not find a correlation between diversity and the size of the chemical libraries (Table 2).
These results suggest that the combination of a chemical marketplace and the concept of virtual libraries (i.e., a com- bination of diverse stock building blocks and robust chemi- cal reactions) could yield a very large and diverse database and thus better coverage of the druglike chemical space.
Since the results indicated large unexplored property regions, we wanted to confirm whether they represent real opportunities and they do not correspond to non-druglike property profiles from another perspective. For example, the presence of liable substructures can increase the chances of false positives and/or toxicity and such residues may not be identified by Strict filter. In fact, in a typical workflow of library design, physicochemical property filters are applied in combination with SMARTS-based substructural filters.
We therefore postfiltered the approved drug set already pro- cessed by Strict filter against a set of unwanted substructures described in the literature (referred as SMARTS and Lilly filters) [51–53] The distribution of the underrepresented regions was compared in the presence and absence of such postfiltering of the unwanted substructures on the ChEMBL dataset. (Fig. 4).
In fact, a positive correlation could be identified between the overrepresented regions and the regions enriched by unwanted substructures suggesting that the underrepresented regions are not enriched in compounds containing residues of increased risk. We have compared the total number of molecules and the number of those that contained unwanted substructures. We have found that their ratio was higher than the expected value of the given grid points in 332 (covering 2586 molecules) underrepresented and 26 overrepresented (covering 16,153 molecules) points. The ratio of under/over- represented grid points was 11.6:1 that elevated slightly to 12.8:1—not a significant difference but substructural filters must be applied with additional care. Another analysis was also carried out to further confirm the druglikeness of the identified underrepresented regions of property space. As described above, ChEMBL showed the most homogenous
distribution of compounds on the map trained on approved drugs. ChEMBL is a bioactivity database containing valua- ble experimental data and information on which compounds were identified as active or inactive by experimental biologi- cal screening against macromolecular targets. We therefore extracted compounds from the ChEMBL database reported as active (pChEMBL > 6) on maximum 1 (i), maximum 2 (ii), or minimum 10 (iii) unique and different targets (mul- tiple activities on the same target considered as one activ- ity). In case, the underrepresented regions of the maps were featuring non-selective, promiscuous compounds we would expect more examples of group (iii) than groups (i) or (ii) on the underrepresented regions. We have compared the distri- bution of the full ChEMBL database (see Fig. 2a) with the distribution of the promiscuous molecules (Fig. 5).
While only one promiscuous grid point was identified as an underrepresented grid point containing 16 molecules (0.37% of all the ChEMBL molecules in underrepresented areas), we found three promiscuous grid points which were also identified as overrepresented corresponding to 2,156 molecules (5.15% of all ChEMBL molecules in overrepre- sented areas). From another perspective, the ratio of over- and underrepresented grid points of the total ChEMBL database was 66:766, while the ratio of over- and under- represented grid points of promiscuous ChEMBL molecules was 3:1. In summary, an opposite trend (enrichment of selec- tive ligands) was found suggesting that the underrepresented areas could be indeed populated by druglike compounds, and thus, they are of great potential.
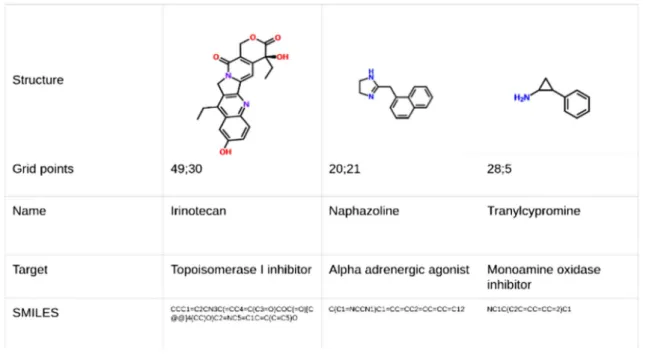
Exemplary approved drugs residing in underrepresented property profile regions are shown in Fig. 6 and a more com- prehensive overview of one of the largest underrepresented regions in Fig. 7.
We have selected an exemplary neighboring over- and an underrepresented region of Mcule stock database ([[37:41];[20;24]] and [[38;42];[8;12]], respectively) to analyze their physicochemical property profile differences in more detail. These regions have a similar distribution of some properties while they greatly differ in others— (Fig. 8).
By comparing these two regions covering 16–16 gridpoints, we can see how these molecules differ from each other at the level of physicochemical properties. Notable differences can be seen in the number of rotatable bonds, carbon atoms and H-bond acceptors (Fig. 8a and b) (lower in case of the underrepresented molecules). PSA and molar mass (Fig. 8e and f) are lower too.
In contrast, halogen atom counts slightly different, while other properties such as heteroatom ratio (Fig. 3c and D) and
H-bond donors are equivalent. In case of logP, we can see a moderate decrease in the over-versus to the underrepresented regions, but it is interesting to see the wide range in case of that property in the overrepresented regions. Comparing these distributions to the Ro5 filters, we can conclude that both examined regions comply with all the Ro5 rules and Ro5 were not able to distinguish them. The logP and molar mass distributions of the overrepresented set (left side) seem to fall a little closer to the Ro5 criteria: 500 vs. 330 and 5 versus 2.5, respectively. The biggest observed difference is in the number of H-bond donors but even this number in case of the overrepresented regions (~ 6) is far from the maximum (10) and the molecules identified in the under- represented region have an even lower average value of 4.
Conclusion
We analyzed the chemical space of approved drugs using self-organizing maps by means of sixteen widely used physicochemical parameters. The analysis of compounds described previously in drug discovery research programs (ChEMBL database) as well as compounds manufactured for drug discovery (individual supplier’s stock and virtual catalogs and the Mcule chemical marketplace database) revealed that there are still significant areas of the druglike property space that are yet unexplored. Furthermore, it has been shown that these regions represent compounds which are (i) compatible with very rigorous property filtering, (ii) not enriched in unwanted substructures, (iii) nor in potential promiscuous false positives. The presence of such property profiles emphasizes the need for commercially or otherwise accessible libraries representing these yet-unexplored por- tions of chemical space. Furthermore, our results suggest that in case of a sufficient number of hits/leads, it makes a lot of sense to prioritize compounds by Ro5, our described Strict filter or similar rules as there is still a lot to discover within such filtered space. On the other hands, in case the number of hits/leads are limited, it is suggested to investi- gate compounds beyond Ro5 as well [54], but one should be prepared for a longer development time and a higher risk of failure. Our presented approach based on self-organizing maps (SOMs) is well suited for the multiparameter analysis of the physicochemical parameter space and can identify property profiles that are otherwise missed by traditional fil- ters such as Ro5 or Ro3 and they can thereby minimize false negatives and false positives of in silico ADMET screen- ing. It has to be mentioned that the chemical space can be represented in an infinite number of ways, and in our study, we analyzed compounds from one aspect only: by sixteen physicochemical parameters. Nevertheless, these included descriptors most frequently applied by the industrial drug research programs. The results suggest that a virtual library
Fig. 1 Elimination rates of the individual filters of Ro5 and the dif- ferent numbers of violations (a, b) and the elimination rates of the applied Strict filters (c, d) on the analyzed databases. Exact numbers can be found in Supporting Information (Table S2)
◂
Fig. 2 ChEMBL database (a), the chemical marketplace Mcule stock library (b) Supplier
#1 stock library (c), and the Supplier #1 virtual library (d), Supplier #2 (e), Supplier #3 (f), Supplier #4 (g), Supplier #5 (h), Supplier #6 (i) and Supplier #7 (j) placed on a self-organizing map trained on approved drugs filtered by Strict filter. The values (therefore colors) of each grid points are the percent of molecules of the given database that are assigned to that point based on their properties. Maxi- mum values in all heatmaps were set to 3.0 which is the highest value occurred in either of the databases. The green parts of the colorbars and the maps indicate the “ideal” num- ber of molecules falling to one point—in a case of a completely heterogenic database
based on the combination of an extensive and diverse set of stock building blocks and robust reactions can result in better sampling and could effectively populate the identified under- represented regions. Such a library may be able to address difficult drug discovery targets associated with yet-unmet medical needs.
Experimental section
DatabasesThe supplier databases have been downloaded in either SMILES or SDF format. DrugBank (version: 5.0.10.) was downloaded in SDF format. For ChEMBL database, we used version 23 and where applicable we filtered it by the activity notations (pChEMBL > 6 and the activity comment is “active”). The records have been converted to SMILES, and structures were ionized at their physiological (pH = 7.4) state using Indigo toolkits. Mcule stock and supplier
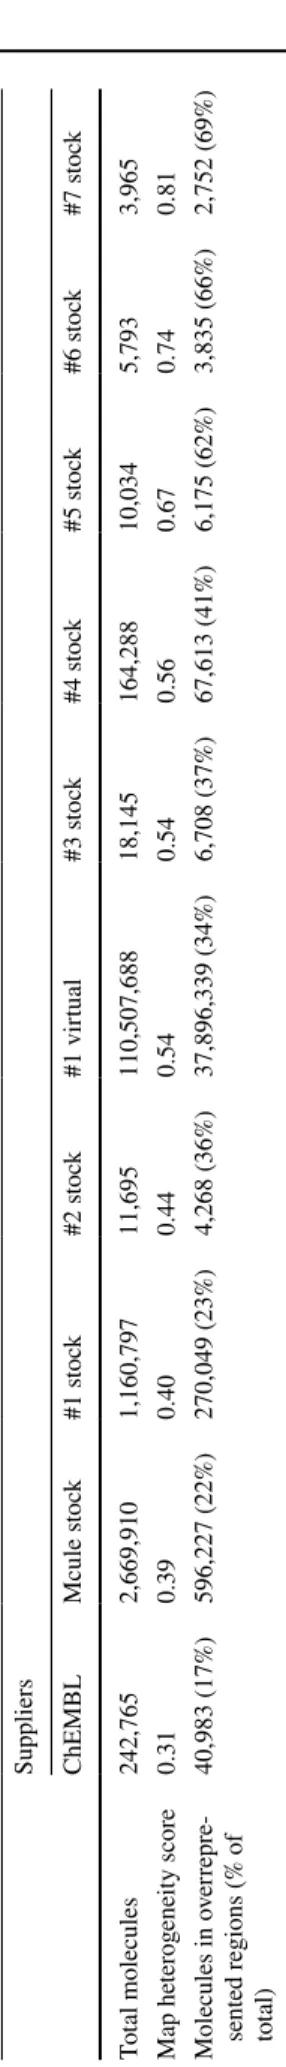
Table 2 Map heterogeneity scores of different supplier libraries and the number of molecules at overrepresented grid points of the map Suppliers ChEMBLMcule stock#1 stock#2 stock#1 virtual#3 stock#4 stock#5 stock#6 stock#7 stock Total molecules242,7652,669,9101,160,79711,695110,507,68818,145164,28810,0345,7933,965 Map heterogeneity score0.310.390.400.440.540.540.560.670.740.81 Molecules in overrepre- sented regions (% of total)
40,983 (17%)596,227 (22%)270,049 (23%)4,268 (36%)37,896,339 (34%)6,708 (37%)67,613 (41%)6,175 (62%)3,835 (66%)2,752 (69%)
Fig. 3 Number of overrepresented and underrepresented grid points of various libraries placed on the map (a) and map heterogeneity scores and the percent of libraries in overrepresented grid points (b)
catalogs were downloaded and extracted from Mcule web- site (03/11/2020 https:// mcule. com/ datab ase/).
Filters
The Ro5 filters applied in our study were identical with the ones in the original publication [1] (Table S1). Our Strict filter was defined based on our industrial pharma part- ners’ feedback—see Table S1. For the elimination of the promiscuous and problematic substructures—as we called SMARTS filtering we used both Open Babel [55] and Indigo [56] and eventually applied the stricter of the two as we have noticed slight differences in their output. Furthermore, we used Lilly Medchem Rules as a standalone application for the most accurate elimination of such substructures. We have
also contributed to the application with the addition of the feature to process files containing multiple SMARTS pat- terns. Settings were as follows:
For the generation of the physicochemical properties, the SDF input files were applied. For those properties available in Open Babel (halogen atom count, heteroatom count, chi- ral center count, rotatable bonds, H-bond donors, H-bond acceptors, aromatic rings, molar mass, logP, PSA, heteroatom ratio, aliphatic rings), we used the Open Babel functions using
Fig. 4 Distributions of mol- ecules that failed the unwanted substructural filters (a) and the full ChEMBL database (b) (identical to Fig. 2a)
Fig. 5 Distributions of selective (1 target) (a), fairly selective (targets = 2) (b), non-selective (2 < targets) (c) and particularly promiscuous (10 < targets) (d) compounds
Fig. 6 Examples of approved drugs with underrepresented property profiles
Fig. 7 Property distributions of the grid points [35–45; 5–15] of the generated SOMs represented by 37 drugs (4 exemplified in Fig. 8d). Boxes cover the 2nd and 3rd quartile of the data, while lines cover 1st and 4th quartiles
Fig. 8 The property distribution of molecules residing on an over- represented region [37:41];[20;24] is shown on the left (a, c and e) and the properties of molecules residing on a neighboring underrep-
resented region [38;42];[8;12] are shown on the right (b, d and f).
Boxes cover the 2nd and 3rd quartile of the data, while lines cover 1st and 4th quartiles
default parameters. For the remaining properties (acidic group count; basic group count; carbon atom count, fsp3), we cre- ated our own SMARTS definitions and counted the number of matching atoms for each molecule:
The generated SDF files have been converted to CSV and LRN files. (The latter was used as the input for generating the self-organized maps by Somoclu.)
Self‑organized maps (SOMs)
To generate self-organized maps, we applied Somoclu [57], implementation. Before the training of our self-organized maps, we had to collect the highest and lowest values for each property present in our initial sets that was dependent of the filtering methods used. For example, without property filtering, we had an extremely high number of chiral centers and molar mass values in certain datasets. Using these maxi- mum and minimum values, we have normalized each prop- erty to a range of 0–1. Using the Somoclu implementation of a self-organizing map algorithm, we have created a map of 60 × 45 grid points—each of them had 16 dimensions.
The size of 60 × 45 was sufficiently small to be trainable with our training datasets and the “deployment” of the big datasets could be achieved within a few hours on a standard computer (4 core CPU: i5-8250U; 8 GB RAM). The 60 × 45 mapsize was also sufficiently high for detailed comparison of the databases. Furthermore, choosing a not symmetrical map is beneficial for the visual evaluation and comparison.
During training, the 16 dimensions (properties) have been first filled with random values between 0 and 1. For the training of the maps, we have used the appropriate (prop- erty filtered) version of the DrugBank database. During the training process, each molecule of the training set was intro- duced to the map and the most similar grid point (using Euclidean distance calculation) was chosen as the winning node. This node and its neighbors were then modified to be more similar to the molecule introduced to them. This pro- cess was repeated for every molecule of the dataset in every epoch. In every following epoch, both the learning rate and
the learning neighborhood area were lowered. The SOMs used in our study were trained for 500 epochs.
As a result, we got a map where the drugs—filtered by Strict filter—were evenly distributed. On these maps, we examined the distribution of the collected compound librar- ies (ChEMBL, Mcule stock, Supplier #1 stock, Supplier #1 virtual and Supplier #2-#7 catalogs). Each molecule of the catalogs was introduced to every gridpoint of the map and was assigned to the one with the lowest Euclidian distance (calculated between the 16 parameters of the molecules and the gripdpoints). Based on the number of molecules assigned to each gridpoint over- and underrepresented regions of the commercial and non-commercial databases were identified. Underrepresented gridpoints were defined as follows: number of molecules on gridpoint < (total num- ber of molecules/2700/5). Overrepresented gridpoints were defined as follows: number of molecules on gridpoint > (all molecules/2700 * 5). Furthermore, we calculated map het- erogeneity scores to characterize the heterogeneity of SOMs’
physicochemical property distributions as follows: ((number of overrepresented gridpoints + number of underrepresented gridpoints)/total number of gridpoints), thus the lower the map heterogeneity score, the higher the diversity of the database.
The heatmaps and Figure S1 were created by using mat- plotlib [58] functions.
Supplementary Information The online version contains supplemen- tary material available at https:// doi. org/ 10. 1007/ s11030- 021- 10343-y.
Funding Open access funding provided by Budapest University of Technology and Economics. Project no. 1010984 has been imple- mented with the support provided from the National Research, Devel- opment and Innovation Fund of Hungary, financed under the KDP-2020 funding scheme. This project has received funding from the European Union’s Horizon 2020 research and innovation program under grant agreement No 777828.
Declarations
Conflict of interest The authors have no relevant financial or non-fi- nancial interests to disclose.
Open Access This article is licensed under a Creative Commons Attri- bution 4.0 International License, which permits use, sharing, adapta- tion, distribution and reproduction in any medium or format, as long as you give appropriate credit to the original author(s) and the source, provide a link to the Creative Commons licence, and indicate if changes were made. The images or other third party material in this article are included in the article's Creative Commons licence, unless indicated otherwise in a credit line to the material. If material is not included in the article's Creative Commons licence and your intended use is not permitted by statutory regulation or exceeds the permitted use, you will need to obtain permission directly from the copyright holder. To view a copy of this licence, visit http:// creat iveco mmons. org/ licen ses/ by/4. 0/.
References
1. Lipinski CA, Lombardo F, Dominy BW, Feeney PJ (2001) Experi- mental and computational approaches to estimate solubility and permeability in drug discovery and development settings1PII of original article: S0169–409X(96), 00423–1. The article was origi- nally published in Advanced Drug Delivery Reviews 23 (1997) 3. Adv Drug Deliv Rev 46:3–26. https:// doi. org/ 10. 1016/ S0169- 409X(00) 00129-0
2. Lipinski CA (2004) Lead- and drug-like compounds: the rule-of- five revolution. Drug Discov Today Technol 1:337–341. https://
doi. org/ 10. 1016/j. ddtec. 2004. 11. 007
3. Oprea TI (2000) Current trends in lead discovery: Are we looking for the appropriate properties? Mol Divers 5:199–208. https:// doi.
org/ 10. 1023/A: 10213 68007 777
4. Veber DF, Johnson SR, Cheng HY, Smith BR, Ward KW, Kopple KD (2002) Molecular properties that influence the oral bioavail- ability of drug candidates. J Med Chem 45:2615–2623. https://
doi. org/ 10. 1021/ jm020 017n
5. Hughes JD, Blagg J, Price DA, Bailey S, Decrescenzo GA, Devraj RV, Ellsworth E, Fobian YM, Gibbs ME, Gilles RW, Greene N, Huang E, Krieger-Burke T, Loesel J, Wager T, Whiteley L, Zhang Y (2008) Physiochemical drug properties associated with in vivo toxicological outcomes. Bioorg Med Chem Lett 18:4872–4875.
https:// doi. org/ 10. 1016/j. bmcl. 2008. 07. 071
6. Ursu O, Rayan A, Goldblum A, Oprea TI (2011) Understanding drug-likeness. WIREs Comput Mol Sci 1:760–781
7. Matta CF (2014) Modeling biophysical and biological properties from the characteristics of the molecular electron density, electron locali- zation and delocalization matrices, and the electrostatic potential. J Comput Chem 35:1165–1198. https:// doi. org/ 10. 1002/ jcc. 23608 8. Todeschini R, Consonni V, Mannhold R (Series Editor), Kubinyi
H (Series Editor) GF (Series E (2009) Molecular Descriptors for Chemoinformatics, 2nd ed
9. Hansch C, Leo A, Hoekman D (1995) Exploring QSAR: fun- damentals and applications in chemistry and biology. American Chemical Society, Washington, DC
10. Congreve M, Carr R, Murray C, Jhoti H (2003) A ‘Rule of Three’
for fragment-based lead discovery? Drug Discov Today 8:876–
877. https:// doi. org/ 10. 1016/ S1359- 6446(03) 02831-9
11. Oprea TI, Davis AM, Teague SJ, Leeson PD (2001) Is there a dif- ference between leads and drugs? A historical perspective. J Chem Inf Comput Sci 41:1308–1315. https:// doi. org/ 10. 1021/ ci010 366a 12. Muegge I, Heald SL, Brittelli D (2001) Simple selection criteria
for drug-like chemical matter. J Med Chem 44:1841–1846. https://
doi. org/ 10. 1021/ jm015 507e
13. Wager TT, Hou X, Verhoest PR, Villalobos A (2016) Central nervous system multiparameter optimization desirability: appli- cation in drug discovery. ACS Chem Neurosci 7:767–775. https://
doi. org/ 10. 1021/ acsch emneu ro. 6b000 29
14. Wager TT, Hou X, Verhoest PR, Villalobos A (2010) Moving beyond rules: The development of a central nervous system mul- tiparameter optimization (CNS MPO) approach to enable align- ment of druglike properties. ACS Chem Neurosci 1:435–449.
https:// doi. org/ 10. 1021/ cn100 008c
15. Doak BC, Over B, Giordanetto F, Kihlberg J (2014) Oral drug- gable space beyond the rule of 5: Insights from drugs and clinical candidates. Chem Biol 21:1115–1142. https:// doi. org/ 10. 1016/j.
chemb iol. 2014. 08. 013
16. Matsson P, Doak BC, Over B, Kihlberg J (2016) Cell permeability beyond the rule of 5. Adv Drug Deliv Rev 101:42–61. https:// doi.
org/ 10. 1016/j. addr. 2016. 03. 013
17. Bickerton GR, Paolini GV, Besnard J, Muresan S, Hopkins AL (2012) Quantifying the chemical beauty of drugs. Nat Chem 4:90–98. https:// doi. org/ 10. 1038/ nchem. 1243
18. Hopkins AL, Groom CR (2002) Opinion: the druggable genome.
Nat Rev Drug Discov 1:727–730
19. Crews CM (2010) Targeting the undruggable proteome: the small molecules of my dreams. Chem Biol 17:551–555. https:// doi. org/
10. 1016/j. chemb iol. 2010. 05. 011
20. Overington JP, Al-Lazikani B, Hopkins AL (2006) How many drug targets are there? Nat Rev Drug Discov 5:993–996. https://
doi. org/ 10. 1038/ nrd21 99
21. Kohonen T (2001) Self-organizing maps. Springer Ser Inform Sci.
https:// doi. org/ 10. 1007/ 978-3- 642- 56927-2
22. Selzer P, Ertl P (2006) Applications of self-organizing neural networks in virtual screening and diversity selection. J Chem Inf Model 46:2319–2323. https:// doi. org/ 10. 1021/ ci060 0657 23. Noeske T, Sasse BC, Stark H, Parsons CG, Weil T, Schneider G
(2006) Predicting compound selectivity by self-organizing maps:
cross-activities of metabotropic glutamate receptor antagonists.
Chem Med Chem 1:1066–1068. https:// doi. org/ 10. 1002/ cmdc.
20060 0147
24. Pearson K (1901) LIII. On lines and planes of closest fit to systems of points in space. London, Edinburgh, Dublin Philos Mag J Sci 2:559–572. https:// doi. org/ 10. 1080/ 14786 44010 94627 20 25. Bishop C, Svensen M, Williams C (1997) GTM: the generative
topographic mapping. Neural Comput 10:215–234. https:// doi.
org/ 10. 1162/ 08997 66983 00017 953
26. Hinton G, Roweis ST (2002) Stochastic neighbor embedding.
In: NIPS. Citeseer, pp 833–840
27. Virshup AM, Contreras-García J, Wipf P, Yang W, Beratan DN (2013) Stochastic voyages into uncharted chemical space produce a representative library of all possible drug-like com- pounds. J Am Chem Soc 135:7296–7303. https:// doi. org/ 10.
1021/ ja401 184g
28. Su MC, Te CH (2000) Fast self-organizing feature map algorithm.
IEEE Trans Neural Netw 11:721–733. https:// doi. org/ 10. 1109/ 72.
846743
29. Schneider G, Tanrikulu Y, Schneider P (2009) Self-organizing molecular fingerprints: a ligand-based view on drug-like chemi- cal space and off-target prediction. Future Med Chem 1:213–218.
https:// doi. org/ 10. 4155/ fmc. 09. 11
30. Digles D, Ecker GF (2011) Self-organizing maps for in silico screening and data visualization. Mol Inform 30:838–846. https://
doi. org/ 10. 1002/ minf. 20110 0082
31. Ivanenkov Y, Zhavoronkov A, Yamidanov R, Osterman I, Ala- dinskiy V, Aladinskaya A, Terentiev V, Ayginin A, Kartsev V, Skvortsov D, Chemeris A, Baimiev A, Sofronova A, Malyshev A, Filkov G, Zagribelny B, Putin E, Puchinina M, Dontsova O (2019) Identification of Novel Antibacterials using Machinelearn- ing Techniques. https:// doi. org/ 10. 3389/ fphar. 2019. 00913 32. Zhang S, Li Y, Qin Z, Tu G, Chen G, Yan A (2019) SAR study
on inhibitors of GIIA secreted phospholipase A2 using machine learning methods. Chem Biol Drug Des 93:666–684. https:// doi.
org/ 10. 1111/ cbdd. 13470
33. Drgan V, Bajželj B (2021) Application of supervised SOM algo- rithms in predicting the hepatotoxic potential of drugs. Int J Mol Sci 22:4443. https:// doi. org/ 10. 3390/ ijms2 20944 43
34. Wang M, Li L, Yu C, Yan A, Zhao Z, Zhang G, Jiang M, Lu A, Gasteiger J (2016) Classification of mixtures of chinese herbal medicines based on a self-organizing map (SOM). Mol Inform 35:109–115. https:// doi. org/ 10. 1002/ minf. 20150 0115
35. Smith RD, Lu J, Carlson HA (2017) Are there physicochemi- cal differences between allosteric and competitive ligands? PLoS Comput Biol 13:1–18. https:// doi. org/ 10. 1371/ journ al. pcbi. 10058 36. Congreve M, Oswald C, Marshall FH (2017) Applying structure-13 based drug design approaches to allosteric modulators of GPCRs.
Trends Pharmacol Sci 38:837–847. https:// doi. org/ 10. 1016/j. tips.
2017. 05. 010
37. Nielsen DS, Shepherd NE, Xu W, Lucke AJ, Stoermer MJ, Fairlie DP (2017) Orally absorbed cyclic peptides. Chem Rev 117:8094–
8128. https:// doi. org/ 10. 1021/ acs. chemr ev. 6b008 38
38. Oprea TI, Zamora I, Ungell A-L (2002) Pharmacokinetically based mapping device for chemical space navigation. J Comb Chem 4:258–266. https:// doi. org/ 10. 1021/ cc010 093w
39. Virshup AM, Wipf P, Yang W, Beratan DN (2013) Stochastic Voyages into Uncharted Chemical Space Produce a Representa- tive Library of All Possible Drug-Like Compounds
40. Ovchinnikova SI, Bykov AA, Tsivadze AY, Dyachkov EP, Kireeva N V (2014) Supervised extensions of chemography approaches:
case studies of chemical liabilities assessment. J Cheminform 6 41. Zabolotna Y, Lin A, Horvath D, Marcou G, Volochnyuk DM, Var-
nek A (2021) Chemography: searching for hidden treasures. J Chem Inf Model 61:179–188. https:// doi. org/ 10. 1021/ acs. jcim. 0c009 36 42. Kim S, Chen J, Cheng T, Gindulyte A, He J, He S, Li Q, Shoe-
maker BA, Thiessen PA, Yu B, Zaslavsky L, Zhang J, Bolton EE (2020) PubChem in 2021: new data content and improved web interfaces. Nucleic Acids Res 49:D1388–D1395. https:// doi. org/
10. 1093/ nar/ gkaa9 71
43. Ruddigkeit L, Van DR, Blum LC, Reymond J (2012) Enumeration of 166 billion organic small molecules in the chemical universe database GDB-17. J Chem Inf Model 52:2864–2875
44. Mendez D, Gaulton A, Bento AP, Chambers J, De Veij M, Félix E, Magariños MP, Mosquera JF, Mutowo P, Nowotka M, Gordillo- Marañón M, Hunter F, Junco L, Mugumbate G, Rodriguez-Lopez M, Atkinson F, Bosc N, Radoux CJ, Segura-Cabrera A, Hersey A, Leach AR (2019) ChEMBL: towards direct deposition of bioassay data.
Nucleic Acids Res 47:D930–D940. https:// doi. org/ 10. 1093/ nar/ gky10 75 45. Kiss R, Sandor M, Szalai FA (2012) http:// Mcule. com: a public
web service for drug discovery. J Cheminform 4:P17–P17 . https://
doi. org/ 10. 1186/ 1758- 2946-4- S1- P17
46. Wishart DS, Knox C, Guo AC, Shrivastava S, Hassanali M, Sto- thard P, Chang Z, Woolsey J (2006) DrugBank: a comprehensive resource for in silico drug discovery and exploration. Nucleic Acids Res 34:D668–D672. https:// doi. org/ 10. 1093/ nar/ gkj067 47. Lovering F, Bikker J, Humblet C (2009) Escape from Flatland:
increasing saturation as an approach to improving clinical success.
J Med Chem 52:6752–6756. https:// doi. org/ 10. 1021/ jm901 241e 48. Tarcsay A, Nyíri K, Keseru GM (2012) Impact of lipophilic effi-
ciency on compound quality. J Med Chem 55:1252–1260. https://
doi. org/ 10. 1021/ jm201 388p
49. Leeson PD (2018) Impact of physicochemical properties on dose and hepatotoxicity of oral drugs. Chem Res Toxicol 31:494–505.
https:// doi. org/ 10. 1021/ acs. chemr estox. 8b000 44
50. Grygorenko OO, Volochnyuk DM, Ryabukhin SV, Judd DB (2020) The symbiotic relationship between drug discovery and organic chemistry. Chem A Eur J 26:1196–1237. https:// doi. org/
10. 1002/ chem. 20190 3232
51. Pearce BC, Sofia MJ, Good AC, Drexler DM, Stock DA (2006) An empirical process for the design of high-throughput screening deck filters. J Chem Inf Model 46:1060–1068. https:// doi. org/ 10.
1021/ ci050 504m
52. Baell JB, Holloway GA (2010) New substructure filters for removal of pan assay interference compounds (PAINS) from screening libraries and for their exclusion in bioassays. J Med Chem 53:2719–2740. https:// doi. org/ 10. 1021/ jm901 137j 53. Bruns RF, Watson IA (2012) Rules for identifying potentially
reactive or promiscuous compounds. J Med Chem 55:9763–9772.
https:// doi. org/ 10. 1021/ jm301 008n
54. Egbert M, Whitty A, Keserű GM, Vajda S (2019) Why some targets benefit from beyond rule of five drugs. J Med Chem 62:10005–10025. https:// doi. org/ 10. 1021/ acs. jmedc hem. 8b017 32 55. O’Boyle NM, Banck M, James CA, Morley C, Vandermeersch T,
Hutchison GR (2011) Open Babel: An open chemical toolbox. J Cheminform 3:33. https:// doi. org/ 10. 1186/ 1758- 2946-3- 33 56. Indigo Toolkit 2018. https:// lifes cience. opens ource. epam. com/
indigo/
57. Wittek P, Gao SC, Lim IS, Zhao L (2017) somoclu: An Efficient Parallel Library for Self-Organizing Maps. J Stat Software https://
doi. org/ 10. 18637/ jss. v078. i09
58. Caswell TA, Droettboom M, Lee A, Hunter J, Andrade ES de, Firing E, Hoffmann T, Klymak J, Stansby D, Varoquaux N, Nielsen JH, Root B, May R, Elson P, Seppänen JK, Dale D, Lee J-J, McDougall D, Straw A, Hobson P, Gohlke C, Yu TS, Ma E, Vincent AF, Silvester S, Moad C, hannah, Kniazev N, Ernest E, Ivanov P (2020) matplotlib/matplotlib: REL: v3.3.3. https:// doi.
org/ 10. 5281/ ZENODO. 42689 28
Publisher's Note Springer Nature remains neutral with regard to jurisdictional claims in published maps and institutional affiliations.
Authors and Affiliations
Gergely Takács1,2 · Márk Sándor2 · Zoltán Szalai2 · Róbert Kiss2 · György T. Balogh1,3
1 Department of Chemical and Environmental Process Engineering, Budapest University of Technology and Economics, Műegyetem rakpart 3, Budapest 1111, Hungary
2 Mcule.com Kft, Bartók Béla út 105-113, Budapest 1115, Hungary
3 Department of Pharmacodynamics and Biopharmacy, University of Szeged, Szeged 6720, Hungary


![Fig. 8 The property distribution of molecules residing on an over- over-represented region [37:41];[20;24] is shown on the left (a, c and e) and the properties of molecules residing on a neighboring](https://thumb-eu.123doks.com/thumbv2/9dokorg/963217.56990/12.892.90.813.75.763/property-distribution-molecules-residing-represented-properties-molecules-neighboring.webp)
