PART IV
RECEPTOR THEORY IN ENZYMOLOGY
J. M . VAN ROSSUM Department of Pharmacology, R. C. University, Nijmegen, The Netherlands
Introduction . . . . . . . . . . . 201
I. Mechanism of Enzyme Action . . . . 2 0 1 1. Affinity 202 2. The Reaction Velocity Constant . . . . . . . 208
3. The Initial Reaction Velocity . . . . 2 1 1 4. Plotting Procedures . . . . 2 1 4 II. Substrate Inhibition . . . . 2 1 6 1. Competitive Substrate Inhibition . . . . 2 1 7 2. Noncompetitive Substrate Inhibition . . . . 2 1 7 3. Uncompetitive Substrate Inhibition . . . . 2 1 9 III. Noncompetitive Interaction . . . . . . . . . 220
1. Noncompetitive Inhibition . . . 220
2. Noncompetitive Synergism . . . . 2 2 3 3. Other Ways of Noncompetitive Interaction . . . . . . 225
4. Uncompetitive Interaction . . . . . . . . 226
IV. Competitive Interaction . . . . . . . . . 228
1. Competitive Inhibition . . . . 2 2 9 2. Competitive Synergism and Competitive Dualism . . . . 232
3. Competition at Different Receptors . . . . 2 3 5 4. Irreversible Competitive Inhibition . . . . 2 3 6 V. The Receptors . . 2 3 8 1. Coenzymes and Prosthetic Groups . . . . 2 3 9 2. Transaminases . . . . . . . . . . 240
3. Hydrogenases . . . . . . . . . . . 242
4. Hydrolytic Enzymes . . . . . . . . . 243
5. Reactivators . . . . . . . . . . . 249
Conclusion . . . . . . . . . . . . 252
References . . . . . . . . . . . . 253 199
INTRODUCTION
Reactions between molecules and the concomitant changes in molecular struc- tures are fundamental to most biological processes. It is, therefore, not supris- ing that different biological sciences such as general pharmacology and enzymology are in many aspects analogous in their methods of investigation.
This chapter intends to stress this kind of analogy between sciences that are in some way related to pharmacology. All previous chapters are concerned with the action of chemical substances upon more or less complete biological systems (organisms) and each investigator necessarily assumes the existence of recep- tors. Receptors are roughly defined as those molecular structures in the biolo- gical object with which molecules of the agent react. These receptors are approximately of the size of the interacting molecule.
Enzymology is concerned with the catalytic action of enzymes or specific natural macromolecules on the transformation of certain chemical substances.
The interactional part of the macromolecular enzyme which is quite analogous to the receptor, is generally called the 4'active site." Receptor and active site will be used interchangeably in this chapter, though when little is known about the molecular configuration of the active site the word "receptor" might be preferable. Although the concept of receptor has an indefinite meaning, it is, nevertheless, of great value in the study of biological processes.
Enzymology has an advantage over pharmacology since the systems under study are better defined and the results are more accurate and often more reliable. Consequently, a more extensive analysis of the receptor, or active site, is possible.
In this chapter, receptor-substrate interactions will be discussed and a detailed description of a characteristic receptor will be given. An attempt has been made to present the subject also for those readers who are not familar with enzymology. For a more detailed picture the reader is referred to the excellent handbooks of Dixon and Webb (30) and of Boyer, Lardy, and Myrback (16).
I. MECHANISM O F ENZYME ACTIO N
Most enzyme actions are studied with known enzyme and substrate concen- trations, but when studying the action of drugs upon enzymes located in a living cell one encounters difficulties. Under these circumstances, the concen- tration of active sites, or receptors, on the surface of an enzyme is unknown and the substrate concentration in the immediate vicinity of the receptor is a function of the dose administered to the biological object. Once an adequate concentration in the vicinity of the receptor is reached, the receptor-substance interaction can take place, after which the catalytic process can be accom-
201
pushed. Hence, one can distinguish more than one step in any consideration of enzyme action (40). In general, there are at least three steps, as may be seen in Fig. 1.
The first step represents all factors or magnitudes which determine the concentration of the substrate in the immediate vicinity of receptors on the enzyme as a function of the dose applied. According to Furchgott (35), the concentration around the receptor may be referred to as the concentration in the biophase. Since enzyme actions nearly always can be studied in an isolated and well defined system, generally the first block can be left out of consideration. The substrate concentration is then directly proportional to the amount of substance administered. In studying enzyme actions in an intact animal, the features of the first step must likewise be considered. In the case of a curare-induced relaxation of striated muscle, which is antagonized by an inhibitor of the enzyme acetylcholinesterase such as physostigmine, the concentration of inhibitor in the motor end-plate is highly dependent on the mode of application. The biophase concentration, therefore, will not be linearly
drug substance ^ receptor cone, of
substance- catalytic transition transference concentration interaction receptor process products
FIG. 1. Representation of the sequence of events in enzymatic catalysis. In the first block are collected all factors that determine the concentration of the substrate or sub
stance in the direct vicinity of the active sites. The second block gives the receptor occu
pation. In the third block, the intrinsic catalytic process takes place.
related to the dose. It is interesting to note that both extracellular and intra
cellular acetylcholinesterase of the ganglionic synapse is irreversibly inhibited by a tertiary 2-diethoxyphosphonylthioethylammonium salt, while its quaternary analog is only able to inhibit the enzyme located at the external site of the cell (61, 70). The various features of the first block have been considered in detail in Part I, Section I of this work (see Volume I).
The second block represents the occupation of receptors, or active sites, on the enzyme with substrate molecules. The fraction of the total number of receptors to be occupied depends on the concentration of the substrate and its affinity towards the receptors.
The third step concerns the catalytic process in a strict sense, which takes place subsequently to the receptor occupation. For some enzyme actions this step may occur in a sequence of reactions finally leading to reaction products.
The features of the second and third block will be paid special attention in the following paragraph.
1.1. Affinity
The interaction between substrate molecules or drug molecules and active sites on the enzyme is generally a reversible physical reaction. Hydrogen bonds,
TV. RECEPTOR THEORY IN ENZYMOLOGY 203 weak covalent bonds, ionic interactions and van der Waals' forces may be involved, which have been discussed extensively by Lumry (60).
In many cases the receptor is composed of a sequence of one or more loops of amino acid chains, while in others in addition to this a prosthetic group is involved. The peptide bonds of proteins and the different side-chains of amino acids, together with a possible prosthetic group, largely determine receptor binding. In such amino acid chains the nonhydrocarbon moieties are of special importance. The chemical structure and the type of bonding of the different amino-acid side-chains is shown in Table I. The actual significance of these side-chains may depend on the amino-acid sequence and the geometric con
stellation of the enzyme. As a result of intramolecular hydrogen bonding, the enzyme proteins adopt a coiled structure referred to as the secondary or tertiary structure. This implies a geometric arrangement of the active site, which may be stabilized by additional reactions of the amino-acid side-chains of different coils, e.g., the formation of S—S bridges, and hydrogen bonding.
Increasing concentrations of a compound which competes for hydrogen bonding (such as urea), causes uncoiling of a protein and, thus, produces inactivation; after removal of the urea, the various configurations and activity may be restored (58).
T A B L E I
THE NATURE OF THE SIDE-CHAIN OF AMINO ACIDS IN PROTEINS"
Nature of
Amino acid Symbol Side-chain bonds6
Glycine Gly — Η W
Alanine Ala W
Valine Val CHg
— H C ^
^ C H3
W
Leucine Leu — C H „ — H C ^
^CHg W
Isoleucine lieu CHg
— H C ^
C H2 CHg W
Methionine Met —CH 2— C H 2—S—CH a W
Phenylalanine Phe W
Trytophan Try — C H2 W
TABLE I—continued
Nature of
Amino acid Symbol Side-chain bonds6
Serine Ser — C H2 —OH Η
Threonine Thr — H C ^ C H3
OH Η
Asparagine Asp-NH2 — C H2 — C — N H2
II 0
Η
Glutamine Glu-NH2 — C H2 —CH 2— C — N H 2
II 0
Η
Aspartic acid Asp — C H2 —COOH HE
Glutamic acid Glu — C H2 —CH2—COOH HE
Histidine His — C H2 Ν
Histidine His — C H2
U
ΗΕ
Lysine Lys — C H2 —CH 2—CH 2— C H 2" — N H2 HE Arginine Arg — C H2 —CH 2— C H 2— N H - - C — N H2
II HE
II
N H
Tyrosine Tyr — C H2 H E
Cysteine Cys-H — C H2 — S H Covalent
a Data in part from Linderstrom-Lang and Schellman (S8).
6 W , van der Waals' forces; H, hydrogen bonding, E, electrostatic attraction.
In this respect the experiments of Skou are also interesting to note (79). With acetylcholinesterase spread on the surface of a solution, Skou demonstrates that pressure has a large influence on the enzyme activity. From these experiments, it has been concluded that the orientation of the side-chain and the degree of folding is of great significance for optimal enzyme activity.
The molecular properties of the prosthetic group may be very different from those of the amino acids but they may largely contribute to the substrate- receptor bonding. For the enzyme transaminase, there are the phenolic OH- group and the aldehyde group of the coenzyme pyridoxal phosphate which are of significance for receptor occupancy (89). The α-amino group of a substrate to be transaminated combines with the aldehyde group of the prosthetic group of the receptor while aluminium is involved in a chelate bond between substrate and the phenolic OH-group. Chelate bonds with bi- or trivalent cations are
IV. RECEPTOR T H E O R Y IN E N Z Y M O L O G Y 205 often involved in receptor occupancy, especially if highly specific steric con
stellations are required, as, e.g., for transfer enzymes (53, 55).
The reversible reaction between substrate molecules (S) and receptors on the enzyme (E) may be represented by the following equation:
E+S^^ES
(κ
Β=^-\
(1)where S is the substrate concentration, Ε and ES are the concentrations of free and occupied receptors, and Κs is the dissociation of the enzyme-substrate complex.
With increasing substrate concentration, an increasing saturation of the receptors occurs, since the total number of receptors (E + ES) remains constant and equal to nS, where $ is the enzyme concentration and η the number of active sites per enzyme molecule. Actually, the nature of this saturation function is irrelevant in any consideration to enzyme action. The saturation of the receptors probably proceeds according to Langmuir's adsorption isotherm or the mass law. The usual approach of the enzyme-substrate interactions as deduced by Henry (46), Michaelis and Menten (63), Haldane (42), and others is in fact merely based upon the mass law. A different but merely empirical relation has been suggested by Schaefer (77); its use, however, has been limited to one laboratory (44, 45).
The fraction of active sites occupied by the substrate when equilibrium is reached, is according to the mass law, given by:
n~S ~ l+KBIS ( )
The affinity of the substrate for the receptors is inversely proportional to the dissociation constant. Being a parameter of both enzyme-receptors and substrate, the dissociation constant must be largely dependent on molecular properties of both substrate and active site.
In addition to physical properties of the substrate molecule, the geometric conformation is relevant. Molecular complementariness, thus, is an important factor in receptor binding, as is strongly supported by the brilliant studies of Wilson and associates (94, 95, 96) with a large number of phenolic and non- phenolic phenyltrimethyl ammonium salts. These compounds become attached to the active site of acetylcholinesterase but they cannot be split. The rather high affinity of edrophonium (94), a 3-hydroxy derivative of phenyltrialkyl- ammonium, emphasizes that a phenolic hydroxyl group is important for binding strength. It became evident that only a hydroxyl group in the 3-posi- tion in the phenyl ring considerably increases affinity. This suggests the forma
tion of hydrogen bonds between such a group in the correct conformation and a group in the active site (94). Because of resonance, the 3-OH group of 3-hydro- xyphenyltrimethylammonium will probably be in the plane of the benzene ring
so that only the two conformations shown in Fig. 2A and Β do exist. Wilson investigated which conformation is the correct one by introduction of sub- stituents in position 4 of the benzene ring which either favors conformation A or B. Introduction of a methyl group greatly favors conformation A whereas a methoxy group causes a domination of conformation B. It was found that the methyl group increased binding strength whereas the methoxy group caused a decrease. Therefore, it must be concluded that conformation A is the correct one. Studies with a large number of other rigid derivatives confirmed the con
clusion (94). The binding strength between the corresponding carbamates (Table II) and the receptor is a factor 12 times greater than that of the hydroxyl compounds, for which the strong hydrogen binding potency of the carbonyl rest is responsible. These results imply that there is a high molecular complemen
tarity for the active site in acetylcholinesterase (96).
˙ I
N M e3 N M e3
(A) ( B) FIG. 2. Possible conformations of 3-hydroxyphenyltrimethylammonium.
The large degree in binding capacity of optical isomers again stresses the complementarity factor in receptor occupation, so it is found that ( + )acetyl-j8- methylcholine is split by acetylcholinesterase but its ( — ) isomer is inactive (37). Recently, it has been found that the (-h)form has the configuration of L-lactic acid (34).
The binding strength depends on the pH of the medium, since this produces concomitant changes in the receptor and/or the substrate. The phenolic OH- group of the substances of Table II must be in the undissociated form, which follows from the smaller affinity of these phenol derivatives at pH values higher than their corresponding pi£a values. The affinity of a carbamate as, e.g., neostigmine is practically independent of the pH (90). The ammonium group of such compounds has to be in the dissociated form. The binding strength of a tertiary base as physostigmine is, therefore, influenced by the pH of the medium (90). In general, however, the behavior of the substrate is less suscep
tible to variations in pH and ionic strength than the enzyme, since the ρϋΓα
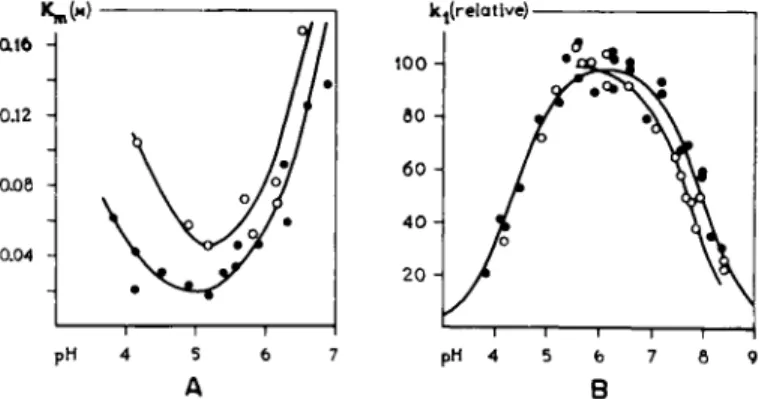
values of dissociable groups on the enzyme are mostly in the neighborhood of the pH of the biological medium. In Fig. 2, some examples are given of the pH-dependence of the affinity and also of the reaction velocity constant of the forward reaction of the enzymatic hydrolysis of dipeptides by papain (81).
IV. RECEPTOR THEORY IN ENZYMOLOGY 207 T A B L E I I
STRUCTURE AND BINDING STRENGTH TO ACETYLCHOLINE RECEPTORS OF PURIFIED ENZYME OF ELECTRIC TISSUE OF Electrophorus Electricus"
Relative binding
No. Formula strength
1 Ο
NMe1+ 8
0
NMe8"From Wilson (94).
1.6
120
7.0
370
29
3200
260 2
3
4
5
6
7
8
The affinity constant, l/Km, as presented in Fig. 3 A, is not the reciprocal of the dissociation constant K$ but a constant with a more complex meaning, to which further attention will be paid in a later paragraph (Section 1.3).
For further studies concerning the relationship between chemical structure and dissociation constant, it is necessary to determine the true Κs and not the more complicated Briggs-Haldane constant, Km (17). In some cases, it is possible to determine K$ from Km according to a procedure of Slater and Bonner (80). However, uncritical use of the procedure may lead to incorrect interpretations (30).
' 1 1 1 1 1 1 1 1 r——ι I
pH 4 5 6 7 pH 4 5 6 7 6 9
A Β
FIG. 3. The influence of the pH on Km and reaction constants. A. The Briggs-Haldane constant, Km, as a function of pH at two temperatures for the hydrolysis of carbobenzoxy- L-histidinamide (CHA) by papain. White circles: at 61.5° C; black circles: at 38°C. Note a maximum in receptor occupancy at about pH 5. B. The relative kx values as a function of pH for hydrolysis of CHA by papain at 38°C (black circles) and 61 °C (white circles).
From Smith et al. (81).
The temperature also has an influence upon the dissociation constant.
Temperature effects may provide information for the binding energy (93). In addition to influences of pH and temperature, the affinity depends on the ionic strength and the presence of certain ions and certain substances.
1.2. The Reaction Velocity Constant
Once the molecules of a substrate have been attached to the receptor on the enzyme, they can be transformed into transition products (P), according to the following equation:
ES E+P (3) The rate of formation of products Ρ is roughly proportional to the concen
tration of ES. On the other hand the reaction rate is inhibited by the products, which implies that the reaction velocity is maximal shortly after the starting point.
IV. RECEPTOR THEORY IN ENZYMOLOGY 209 Only in exceptional cases does this reaction proceed without intermediary steps. For many enzymatic reactions the initial substrate-receptor complex is rearranged and finally delivered as transition products via a certain number of intermediate steps. Such a sequence may be represented as follows:
ES (ES)2 ~ ± *.\ES)n ^ ± E+P (4)
k
2
ka knwhere (ES)n represents the intermediary steps. In any case, the rate of forma
tion of the reaction product Ρ is directly proportional to the initial enzyme- substrate complex. Whether this proportionality constant is complex or not, we shall designate it as &s. A mathematical derivation of k8 is given by Dixon and Webb (30). As a matter of fact, the rate-limiting reaction-velocity constant of Eq. 4 will mainly determine the actual value of kQ. Experiments of Winer and Schwert (97) provide evidence that, in the case of lactic-acid dehydro
genase, the dissociation of the receptor-nicotinamide-adenine-dinucleotide complex (R-NADH2) rate-limits the very complex over-all reaction, which thus determines ks.
It is noteworthy that the intrinsic activity as deduced by Ariens (4) for pharmacological actions is, to a large extent, analogous to the reaction velocity constant k&. For some pharmacological processes it maybe possible to analyze the intrinsic activity into a series of reaction velocity constants. Owing to the complexity of biological organisms, it is only possible to determine relative intrinsic activities, while for enzyme actions the reaction velocity constant can be estimated accurately and often in its absolute value.
Generally speaking, the reaction velocity, vs, is directly proportional to the concentration of substrate-receptor complex, as in:
*>s
=
K-ES (5)The maximal reaction velocity, Fs, is obtained when the total number of receptors is occupied with substrate molecules and may be given by the following equation:
Va = \nS (6)
Like the affinity, the reaction velocity constant k8 depends on the molecular properties of both receptor and substrate. Thus, ks is influenced by the ionic strength, the ionic composition, and the pH of the medium. The degree of ionization and the electron density of parts of the receptors are susceptible to changes in the pH and in other magnitudes. The influence of pH on the ka
value of some substrates is given in Fig. 4. It is evident that for different substrates the optimum is at a different pH.
That there is a difference in the pH-dependence of acetylcholine and the closely related acetylthiocholine with respect to the hydrolysis by
acetylcholinesterase, accounts for the pH-susceptibility of the substrates rather than that of the enzyme (Fig. 4C).
FIG. 4. The influence of the pH on the maximum reaction velocity ( Fs) . A. For urate and uricase. From Baum et al. (9). B. For sucrose and dextransucrase. From Brock Neely (18). C. For acetylcholine (white circles) and acetylthiocholine (black circles) and acetyl
cholinesterase. From Bergmann and Segal (15).
The reaction velocity constants for various substrates with respect to a catalytic process with the same enzyme will gradually change with the mole
cular structure of the substrate. For instance, the reaction velocity constant as
TABLE III
MOLECULAR STRUCTURE AND ACTIVITY OF CHOLINE ESTERS ON ACETYLCHOLINESTERASE OF HEMOLYZED HUMAN ERYTHROCYTES0
Code
AtCh
ACh
PrCh
BuCh
LCh
Formula ( 1 0 "5M ) (/xM/min) (relative)
Ο
C H 3— C \ g ^ ( C H 2) 2— N M e3 Ο
C H3— C \ Q / ( C H 2) 2— N M e3 Ο
C H 3— C H 2— C \ Q / ( C H 2) 2— N M e 3 Ο
C H 3— ( C H 2) 2— C \ Q / ( C H 2) 2— N M e 3 Ο
C H 3— ( C H 2) x ο — C \ Q / ( C H 2) 2— N M e 3
8.3
6.5
9.9 8.3 1.05
7.95 1.00
5.1 0.64
9 ca. 0.1 ca.0.01
a From Van Rossum and Hurkmans (73).
I V . RECEPTOR T H E O R Y I N ENZYMOLOGY 211 determined from the maximal reaction rate gradually decreases in a series of choline esters (6) (see Table III). The higher member of this series, butyryl- choline, has a low &8 as compared with acetylcholine. This compound, therefore, still has an affinity towards the specific receptors but catalysis is largely impaired. It is expected that butyrylcholine will compete with acetylcholine for the receptors if both substances are brought into contact with the enzyme and, thus, inhibit the hydrolysis of acetylcholine. In a later paragraph, further details of such a competition will be given.
Steric factors are of special importance for some enzymatic reactions with respect to the value of the reaction velocity constant ka, which stresses that one of the optical antipodes may be in a favorable position to be transformed by the enzyme, while the other may not. When studying the hydrolysis of ός,-Ν- carbethoxytyrosinamide by chymotrypsin, it wats found that only the L-isomer did behave as a substrate while the D-isomer although being attached to the active sites was unaffected (62). The D-tyrosine isomer actually did act as a competitive inhibitor.
/.3. The Initial Reaction Velocity
The reaction velocity at which transition products Ρ are formed from a substrate by the action of an enzyme, E, is directly proportional to the con
centration of receptor-substrate complex ES (see Eq. 5). After adding substrate to the enzyme, the concentration of ES increases and rapidly reaches a maxi
mum value. As soon as active sites are occupied, the enzymatic reaction starts, resulting in a decrease of substrate. The simultaneous formation of products P, furthermore, causes a product inhibition. The reaction velocity, vs, for a given substrate concentration is maximal when ES is maximal or when dES/dt equals zero. The reaction velocity at the time when dES/at equals zero has been denoted the initial reaction velocity, v$. For many enzymatic reactions the time for reaching dES/dt = 0 disappears in the time needed for mixing sub
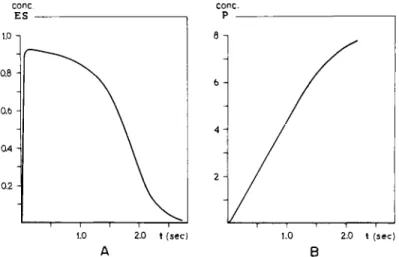
strate and enzyme solution so that the term "initial reaction velocity" has a significant meaning. It is possible to calculate ES and Ρ as function of the time t by interpreting the differential equations for dES/dt and dP/dt. For the special case when the reaction proceeds without formation of intermediate steps, a solution has been proposed by Chance (21). The results for one substrate concentration are presented in Fig. 5. It may be seen from this figure that ES increases from zero to a maximum shortly after the starting point and that ES gradually decreases again. In the P-t curve the slope is zero when t = 0, increases to a maximum (point of inflection) and levels off gradually. The slope at the point of inflection in the P-t curve is thus equal to v\. Under ideal circumstances v% is determined merely by the substrate concentration, the affinity or Km, and the reaction velocity constant, ks. Experimentally, the parameters Km and &s then can be calculated in determining v$ at various substrate concentrations.
If the time at which dESjdt equals zero, is not very close to the time t = 0, product inhibition is already involved before Ε8 is maximal, especially at high substrate concentrations. Furthermore, for low substrate concentrations at dES/dt equals zero, a considerable amount of substrate may be already used up.
This implies that too low values for v$ may be found from the experiments.
These factors are important for some enzymatic reactions and may be signi
ficant when competitive inhibitors are used in combination with a substrate.
t (sec)
FIG. 5. Theoretical enzyme-substrate interaction. The formation of E S ( A ) and the total amount of transition products Ρ (Β) as function of the time, as calculated by Chance (21). Note a maximum in ES, shortly after the start of the reaction. In this point dES/dt equals zero and dPjdt is maximal.
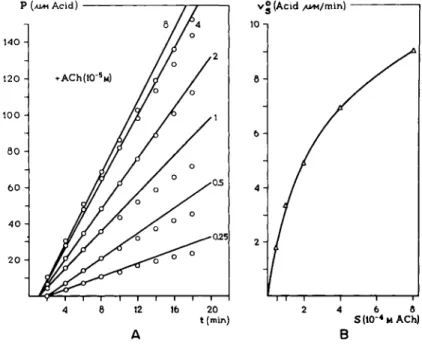
An example of the procedure in determining v$ is given in Fig. 6A. The amount of acid formed as result of the action of acetylcholinesterase on acetyl
choline is plotted and a tangent is drawn at the point of inflection. Values of v$ for different substrate concentrations are determined and plotted in Fig. 6B. The initial reaction velocity is a function of the substrate concentra
tion, the receptor concentration, and the parameters Km and ks, according to the following formula:
(?) where S is the concentration of enzyme, η the number of receptors per enzyme molecule, and Km the Briggs-Haldane constant (which in most instances is not identical with the Michaelis-Menten constant, K§). If catalysis takes place without intermediate steps or if one step is rate-limiting, Km equals (k\ + k0) /klt
but in general it may have a more complex character (30). Km always includes the reaction velocity constant. In some cases, there is experimental evidence
IV. RECEPTOR T H E O R Y IN E N Z Y M O L O G Y 213 that Km equals kjkv as for instance for the enzymic hydrolysis of some dipeptides by papain (81, 82).
The number of receptors per enzyme molecule can be determined by esti
mating the maximal number of substrate molecules that are bound to one enzyme molecule. Using spectrophotometric methods, Theorell et al. (84) were able to show that liver alcohol dehydrogenase contains 2 receptors per molecule of enzyme. With other methods Hayes and Velick (43) provide evidence that yeast alcohol dehydrogenase contains approximately 4 receptors per molecule.
FIG. 6. The enzymatic hydrolysis of acetylcholine (ACh) by ACh-esterase of human erythrocytes—time-effect curve and concentration-effect curve. The amount of acid liberated was measured by automatic titration with 0.01 Ν NaOH at a constant pH of 7.0 (73). A. The total amount of acid as function of time for various initial concentrations of ACh. B. The initial reaction velocity as a function of the concentration (linear plot).
The individual points are obtained from the curve in Fig. 6A.
Methods for evaluating the amount of active sites per molecule have been reviewed by Dixon and Webb (30).
It must be borne in mind that for enzymatic reactions, the Eqs. 2 and 5 representing v% as a function of the substrate concentration are, in fact, based on steady state conditions. When deviations of the concentration-response curves are found, one should examine whether the above-mentioned conditions are fulfilled. Enzyme actions under nonequilibrium conditions have been derived by Beers (10).
1.4 Plotting Procedures
The initial reaction velocity as determined from enzyme kinetic studies is a function of the substrate concentration, which in the simplest case may be represented by Eq. 7 but may be much more complicated when other sub
stances (e.g., inhibitors) are involved, also. Initial reaction velocities obtained
0.22
0.20
ο.ΐδ Η
0.12 Η ο.ι ο Η
0.08
~l 1 I 1 1 1 1 ˆ 0.04 0.08 αΐ2 0.16
1/S ( μ ) Α
- Γ
ΙΟ . 15 20 1 /S( 1 0 "5m Ch-ester)
θ
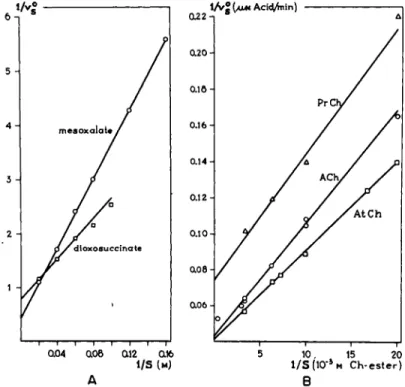
FIG. 7. Concentration-effect curves of substrates. A. Lineweaver-and-Burk plot of 2 substrates for the enzyme malic-acid dehydrogenase. After Davies and Kun (27).
Β. Lineweaver-and-Burk plot of various choline esters as split by ACh-esterase (73).
With respect to acetylthiocholine, no correction has been made for a possible influence of the reaction product thiocholine. Note a different maximum velocity as a different inter
cept of the ordinate and a different Km as a different slope.
experimentally, are plotted on the ordinate and the substrate on the abscissa;
using a certain scale, this results in characteristic graphs.
The most direct plotting procedure is the linear plot of v$ versus 89 which results in rectangular hyperbolas (see Fig. 6B). The slope of these curves is a measure for the affinity and the reaction velocity constant, while the maximum height is directly proportional to ks. If a long concentration range is necessary, a linear concentration scale has disadvantages. Michaelis and Menten (63), therefore, used a logarithmic concentration scale (see Fig. 9) and for the velocity they preferred a percentage scale. Such a percentage-effect-log-concentration
IV. RECEPTOR THEORY IN ENZYMOLOGY 215 curve is most commonly used for pharmacological actions. It is a further advantage that these curves are steepest around half-maximal velocities, which means that the points which can be estimated most accurately lie in the straight part of the curve. Variations in the affinity of substrates are easily seen as a parallel shift of the curves, while variation in the kB is seen from a difference in the maximal height. Log concentration-response curves are especially
\ £ ( / UM Acid /min)
4 6 6 T
V Z /S O O^ M Ch-ester)
ι 1 1 1 r
2 4 6
V|-S( 1 0 -5M Xanthine)
θ
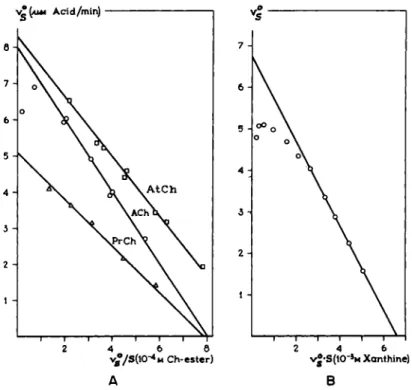
FIG. 8. Concentration-effect curves of substrates. The Eadie plot for various substrates.
A. The initial reaction velocity as function of vjS for various choline esters studied with ACh-esterase (73). B. The initial reaction velocity as function of v-S for xanthine studied with xanthine oxidase. After Hofstee (48). Note that the maximum velocity is obtained by the intercept of the curves with the ordinate, while the intercept with the abscissa equals VJKm or Va-Km.
useful for a qualitative insight into enzyme action (compare Figs. 9 and 11).
The disadvantages of this procedure and of the linear plot are the curved lines.
Considering Eq. 7, it is evident that there are different plotting methods in producing straight lines. Plotting l/vg versus l/S results in straight lines (Fig. 7). This plotting procedure was introduced by Lineweaver and Burk (59) and is the most used in enzymology. The lines have a positive slope, the inter
cept of the ordinate equals 1/FS from which ks can be determined, while the intercept of the abscissa equals —\IKm and, thus, can be used directly in
evaluating the affinity. Another procedure first employed by Lineweaver and Burk consists of plotting S/vg versus #, which also results in straight lines.
Inverted plots with respect to v$ have disadvantages since the graphical determination of maximal reaction velocity is inaccurate and the higher values of v$ are forced together while the low values are far from each other. This implies that deviation from linearity can easily be overlooked. Plotting v$
versus v$IS as employed by Haldane (42) and Eadie (32) also results in straight lines (Fig. 8A). This method and those in which v$ is plotted versus v$-S (49) are particularly useful, which is emphasized by Hofstee (49).
There are many plotting procedures which result in straight lines, each of which may have advantages over others (compare Dixon and Webb (30) and Hofstee (49)). Plotting procedures resulting in straight lines may be useful for extrapolation and, thus, for determining parameters. Curved log-concentra
tion-response curves, however, have the advantage of allowing a more correct interpretation of the mechanism of enzyme actions.
II. SUBSTRATE INHIBITION
Since the initial reaction velocity is directly proportional to the concentration of enzyme-substrate complex, will be a monotonously increasing function of the substrate concentration. Thus, according to Eq. 7 the initial reaction velocity increases gradually and reaches the saturation value of Fs.
For many enzyme actions, however, the inital reaction velocity does not reach a saturation value, but a maximum appears at a certain substrate concentration. The decrease in v$ for higher substrate concentrations has been called "substrate inhibition" (42). Inhibition by excess of substrate may be achieved in various ways.
Substrate inhibition may be of a "competitive " nature, which means that for large concentrations the substrate molecules may settle down on the receptors in an incorrect way and, thus, impair the enzyme in transforming the substrate.
Substrate inhibition may also be of a noncompetitive nature, which implies that substrate molecules in higher concentrations may show an affinity to other receptors in the enzyme, thus impairing the catalytic process on the active site.
This is a very probable phenomenon since the macromolecular proteins, to which enzymes belong, have enough space of a micromolecular size, on which substrate molecules can settle.
In addition to noncompetitive substrate inhibition, uncompetitive substrate inhibition may be involved.* This would imply that one specific receptor is occupied not only by one, but subsequently by two molecules of the substrate.
The latter of the two necessary molecules has to be attached to the receptor
* For a discussion of noncompetitive and uncompetitive inhibition, see Volume I .
IV. RECEPTOR THEORY IN ENZYMOLOGY 2 1 7
in a different way than the former. These types of substrate inhibition will be considered in more detail in the next paragraphs.
11.1. Competitive Substrate Inhibition
Occupation of an active site is often accomplished by attraction and subse- quent binding of evoked groups in the substrate and those in the active site.
Once the substance is bound in the correct way, the catalytic process can start. It is likewise possible that a substrate is only attached to the receptor by means of one of the possible bindings, leaving open one or more other binding possibilities. In the presence of large substrate concentrations, again another substrate molecule may settle down on the receptor and thus prevent catalysis.
Under these circumstances there is inhibition by the substrate in high concen- trations which may be designated as competitive substrate inhibition.
Occupation of the whole active site or part of it by a second substance or competitive antagonist may cause a shift of the ascending as well as of the descending limb of the concentration-response curve. Experimental evidence for this type of substrate inhibition is still lacking.
11.2. Noncompetitive Substrate Inhibition
The macromolecular enzyme molecules contain one or more specific receptors or active sites which are responsible for the enzymatic action. In the vicinity of these sites, there may, in addition, be other receptors capable of reacting with other substances. The occupation then of these noncompetitive receptors may influence the chain of events which takes place after occupation of the specific receptors with substrate molecules. Such an influence may become manifest as a diminution of the reaction velocity constant ks.
As a matter of fact, the occupation of the noncompetitive "receptors" may cause a change in the affinity of the substrate for the specific receptors. In that case, there is a kind of competition, since there must be a mutual change in affinity to the specific and "noncompetitive" receptors.
The initial reaction velocity for the noncompetitive substrate inhibition, resulting in a change in &s, may be represented by the following formula (42):
where 1/Uls' is the affinity of the substrate to the noncompetitive receptors.
The affinity to the specific receptors is greater than that to the noncompetitive receptors (K > Km). In many cases KmjK$ is smaller than 0.05, whichimplies that this term is negligible with respect to 1. Equation 8 then can be reduced to a simpler equation. Compare with Eq. 12.
The reaction rate is maximal for a certain substrate concentration, Sm, as may be found after differentiating Eq. 8 giving the following relationships:
(1 +KJ8)(1 +SIK
a') (1 +KJS+SIK
S' + KJK
S')
(8)s
m= V
Km-K
s'
(9)If the affinity to the nonspecific receptors is much smaller than that to the
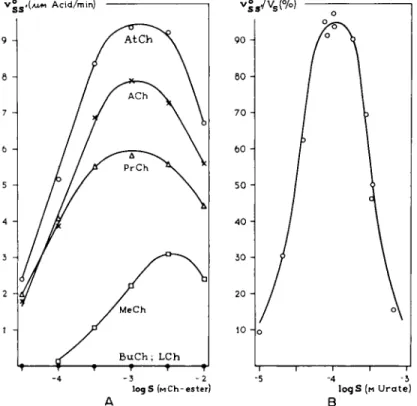
FIG. 9. Substrate inhibition for various substrates. A. The initial reaction velocity as function of the logarithm of the molar concentration of various choline esters (73). B.
The relative v° as function of the logarithm of the molar urate concentration. After Baum et al. (9). Note that the bell-shaped curves are symmetrical.
specific ones, i.e., if KmjK^ <ζ 1, the maximal reaction rate practically equals the theoretical saturation value, Fs. This implies that there is a flat top in the log concentration-response curve. It is evident that Fs, as such, cannot be determined from log concentration-response curves, especially \iKmjK^ is not negligible with respect to unity. On the other hand, Fs is required for calcu
lation of ks.
With a plotting procedure according to Lineweaver and Burk (59), Fs is The maximal reaction rate, v$$>m, as a matter of fact, is only a fraction of the theoretical maximal reaction velocity, Vs, when there is no substrate inhibition according to the following equation (42, 48):
IV. RECEPTOR THEORY IN ENZYMOLOGY 219 obtained from the intercept on the ordinate of the plot for 1 jv versus 1 j8. As may be seen from Eq. 8, the Lineweaver-and-Burk plot will not result in straight lines, but Fs can be found by extrapolation of the line through the points of low velocity as the intercept on the ordinate. Here, the reversed velocity is a disadvantage, since a small error in the tangent of the lines causes a large error in Fs. It is, thus, convenient to use v% versus v%j8 plots as repre- sented in Fig. 8. The theoretical saturation value of vs for the various choline esters (as collected in Table III) is calculated on basis of such plotting procedures.
For most enzymatic reactions, inhibition with high substrate concentrations has been observed (42) (see Fig. 9). It has been shown by Hofstee (48) that the inhibition of xanthine oxidase at high concentrations is essentially of a non- competitive nature. This was accomplished with special plotting procedures [for which the reader is referred to the original paper (48)]. There is no actual proof in the literature for other forms of substrate inhibition and, indeed, there may be a preponderance of noncompetitive substrate inhibition over other forms of substrate inhibition, since the enzyme molecules which are macro- molecular proteins contain only a few spots of micromolecular size, which are the specific receptors. They therefore may have a large number of nonspecific spots which may be susceptible to substrate molecules.
Substances which have a better affinity for the noncompetitive receptors than for the specific active sites—therefore, for which Km > K$—in fact, are no substrates but only behave as noncompetitive antagonists.
11.3. Uncompetitive Substrate Inhibition
The occupation of other parts of the enzyme molecule than the specific receptors may lead to an altered susceptibility of the enzymatic reaction as discussed in the previous paragraph. Exceptionally, substrate molecules may combine with the specific receptors which are already occupied by a substrate molecule. In fact, this is an interaction with a newly formed receptor (E8) according to:
(ES)+S (ES)S (11) The second substrate molecule is attached to the receptor in another way
than the first molecule. It is, therefore, convenient to speak of'4 uncompetitive'' rather than of " competitive " substrate inhibition. The initial reaction velocity for the uncompetitive substrate inhibition, may be represented by the follow- ing (42):
v™ = i+siKBl+Kjs ( 1 2)
The only difference from noncompetitive substrate inhibition is the absence ofthetermiim/iLS SinEq. 12. Since in many cases Km/K$$ <^ 1, it is not possible
to distinguish between noncompetitive and uncompetitive substrate inhibition from the concentration-response curves, as such. This implies that when Eq. 12 fits the experimental data it may not be concluded that uncompetitive inhi
bition is involved instead of noncompetitive inhibition. In fact, the only type of interaction for which there is experimental proof is the noncompetitive substrate inhibition (48).
III. NONCOMPETITIVE INTERACTION
As pointed out before, in addition to their affinity towards active sites, substrate molecules may also show affinity towards nonspecific receptors and, consequently, exert noncompetitive substrate inhibition. Substances with a molecular structure different from that of the substrate are more likely to occupy nonspecific receptors rather than the highly specific substrate receptors.
The existence of noncompetitive drugs, therefore, is anticipated. These sub
stances only occupy nonspecific receptors and may interfere with the sequence of events of the catalytic process which leads to the transformation of the substrate.
Noncompetitive drugs may affect catalysis by influencing the reaction velocity constant and/or the affinity of the substrate. If there is any change in the affinity of the substrate, there must necessarily be a concomitant change in the affinity of the noncompetitive substance. Such a mutual change in affinity has the effect that the combined receptor interactions acquire the nature of a competition. This implies that competition not necessarily requires interaction of substances at the same receptors (as will be stressed further experimentally in a later paragraph).
Noncompetitive interaction, either inhibition or activation, may also be concerned with a decrease or increase of the reaction-velocity constant. Since k8 is part of the affinity constant Km, noncompetitive drugs in some cases also affect the affinity.
How noncompetitive inhibition or activation is accomplished is not always clear. The existence of receptors other than those for the substrate is necessary, but their geometric constellation and localization is mostly obscure. If for enzymatic reactions a prosthetic group is involved, the noncompetitive sub
stance may interact with a different part of it than does the substrate.
Ill A. Noncompetitive Inhibition
Noncompetitive antagonism is accomplished by substances that react with receptors different from the specific substrate receptors, thus diminishing the reaction-velocity constant, Jcs, and reducing the value Fs. The noncompetitive antagonistic action of a substance Β on the action of a substrate S may be represented with the following well-known formula (42):
(13)
IV. RECEPTOR THEORY IN ENZYMOLOGY 221 where Κ^ is the dissociation constant of the nonspecific receptor substance complex. It may be seen from this equation that the straight lines which are obtained with the Lineweaver-and-Burk plot become steeper as the concen
tration of the antagonist increases while the intercept on the ordinate increases, too, thus, directly indicating that Fs decreases. A few examples of noncompe
titive antagonism are given in Fig. 10. These curves fully agree with the theory of Eq. 13.
With increasing inhibitor concentration, the log concentration-velocity curves become less steep. Irrespective of whether or not there is inhibition
Τ I I I I ! I Γ I I I Γ
4 β 12 16 1 2 1/S(10_I μ glutamine) 1/S (10"4m acetaldehyde)
A Β
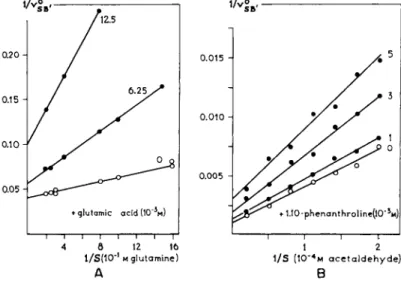
FIG. 10. Noncompetitive inhibitions. A. Of glutaminase by glutamic acid with glutamine as a substrate. Lineweaver-and-Burk plot, afteT> Sayre and Roberts (76).
B. Of alcohol dehydrogenase by 1:10-phenanthroline with acetaldehyde as a substrate.
Lineweaver-and-Burk plot, after Hoch et al. (47). Note that the intercept on the ordinate increases with increasing concentrations of inhibitor, directly indicating noncompetitive antagonism.
by excess substrate it can be concluded from the characteristic family of curves that noncompetitive antagonism occurs (pee Fig. 10). It has been found that for occupation of the specific receptors of acetylcholinesterase the exis
tence of an ammonium group only is sufficient. Thus, tetramethylammonium appeared to be a purely competitive antagonist of acetylcholine (see below).
Furthermore, acetylcholine exerts substrate inhibition in higher concentra
tions. These findings lead to the supposition that, for instance, tetrabutyl- ammonium (NBu4) might be a noncompetitive antagonist of acetylcholine.
In NBu4 the ammonium group is masked by the longer alkyl chains. This chain may exert affinity towards other parts of the enzyme by van der Waals' forces. Tetrabutylammonium and also tetrapropylammonium (NPr4)
show relatively strong, noncompetitive antagonistic properties as may be seen from Fig. 11. NPr4 and NBu4 seem to be one of the few really purely noncom
petitive antagonists of acetylcholine with respect to ACh-esterase. Physo- stigmine, which is sometimes believed to be noncompetitive, (33), actually, is of a purely competitive nature (73).
v |s.B/ ( / u / M Acid/min) -
• N P R4( 1 0 -4M )
S S' B 1 [MM Acid/min) -
• N BU4( 1 0 -4M )
-3 -2
LOGS (m ACh) -3 -2
l o g S U A C h ) θ
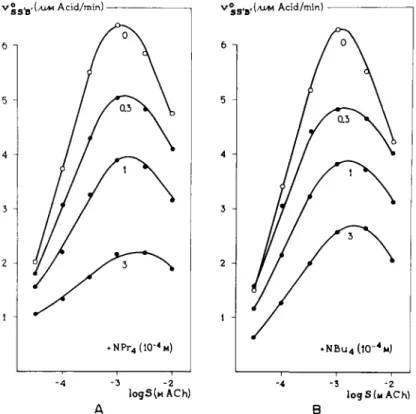
FIG. 11. Noncompetitive inhibition of acetylcholinesterase. Concentration-effect curves for the substrate ACh in the presence of (A) tetrapropylammonium (NPr4) and (B) tetra- butylammonium (NBu4) (73). Logarithmic plot. Note a decline in the left part of the curves, indicating a noncompetitive antagonism and a shift of the maximum in the curves, indicating that there is a competition on the "noncompetitive" receptors.
From the family of concentration-response curves, given in Fig. 11, it may be seen that the maximum in the curve shifts to higher values of the substrate concentration under the influence of the noncompetitive antagonists. This strongly indicates that there is also competition between inhibitor and sub
strate. This competition can be seen in the descending limb of the curves but not in the ascending limb.
The reaction-velocity of a substrate exhibiting substrate-inhibition in the presence of a noncompetitive drug Β may be represented by the following equation, which is an extension of Eq. 13.
IV. RECEPTOR THEORY IN ENZYMOLOGY 223
V° ^w (1
+KJS)(l +B/K
B'+
S/JTS') ( 1 4)By differentiation of Eq. 14 for S it is found for the case that άν°/ά8 equals zero, that the concentration for which v$$>B> is maximal is shifted to higher values according to the following equation:
sm = Vjr„jr8'(i+B/*B') (15)
Compare this equation with Eq. 10. The position of the maximum on the #-axis is thus shifted with a factor Vl + B/KB'.
The plotting procedures for log concentration-velocity, as well as for Line- weaver-and-Burk plots, are convenient in the study of noncompetitive antagonism. For calculation of the noncompetitive affinity other plotting procedures may have advantages such as plotting ν$>ΒΙν$ versus the inhibitor concentration (6). From the slope, then, of such straight lines, the affinity (\jKB) can be obtained directly while the slope of the line is independent of the substrate concentration. On the other hand, the slope of such lines is dependent on the substrate concentration in the case of a competitive inhibition. A substrate dependency, however, may not be used as a criterion for distinguish
ing between competitive and noncompetitive antagonism since the above reasoning is true only when there is no inhibition by the substrate. In the case of substrate inhibition for both types of inhibition, there is an ^-dependence of the slope of lines obtained by plotting v%>Bjv% versus inhibitor concentration. Such an error has been made in classifying physostigmine as an esterase inhibitor (6). From the dose-response curves, it should be concluded that physostigmine is a noncompetitive antagonist whereas the investigators (6) concluded it was a competitive antagonism on basis of a substrate dependence of the ^S BMS
curves. In repeating the experiments, it became evident that physostigmine really is a competitive inhibitor of ACh-esterase.
111.2. Noncompetitive Synergism
Noncompetitive substances may cause inhibition, but as a matter of fact there may be substances which act as activators. Activation means that the reaction velocity, ks, of the substrate is increased by the action of a non
competitive substance on other receptors.
If it is again assumed that the noncompetitive substance becomes attached to the same receptors as does the substrate in high concentrations, the follow
ing equation is representative for the combined interaction of a substrate S and the noncompetitive substance Β:
ο = Fs[l + ( l+ j8 Q B/XB']
Wss
'
B' (1+KJS)(1+SIKb+*!**)
(16)where β' is a constant which determines the degree of activation. If β' has a
negative value there is an inhibition. For β' = — 1, Eq. 16 is reduced to Eq. 14.
Independent of the value of β\ there is a shift of the maximal value as may be seen by differentiation of Eq. 16. The substrate concentration for which the maximum is obtained in the presence of such a noncompetitive substance is given by Eq. 15.
Noncompetitive activation may be deduced from concentration-response curves. When plotting 1 jv versus 1 /$, activation is seen as a decline in the slope
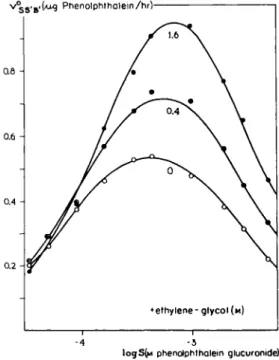
v^s»B.(Ai<g Phenolphthalein/hrV
• ethylene-glycol (M)
-4 -3 ι ι
logS(M phenolphthalein glucuronide)
FIG. 12. Noncompetitive " activation " of jS-glucuronidase. Concentration-effect curves (logaritnmie plot) for the substrate phenolphthalein-glucuronide in the presence of ethylene glycol. Note a shift of the right part of the curve and a shift of the maximum, which implies a competition on the receptors in which substrate inhibition is involved.
This means de-inhibition (see text). After Nayyar and Glick (65).
and a decrease in the intercept on the ordinate. When plotting v%$>w versus
\ogS, the concentration-response curves become steeper with increasing B, while the maximal value increases and the position of the maximum on the log$-axis is at higher concentration.
Substances which occupy the nonspecific receptors only, and therefore have a β' value equal to zero, compete with the substrate on these receptors and, consequently, abolish the noncompetitive substrate inhibition. In combining such a substance with an appropriate substrate, it seems that such a substance acts as an activator or sensitizer of the enzymatic process but Fs is not in
creased. Its competitive action upon the noncompetitive receptors causes a shift
IV. RECEPTOR THEORY IN ENZYMOLOGY 225 of the descending limb of the bell-shaped log concentration-response curve, and, consequently, an elevation of the maximum. The position of the maximum also moves to higher substrate concentrations, according to Eq. 15. Only if the parameter β' is greater than zero, is there true activation, since then Fs is increased.
Studies on the effect of alcohols upon the j8-glucosidase action (65) provide information about the theories given above. The "sensitizing" effect of ethyl
ene glycol on the rate of hydrolysis of phenolphthalein-glucuronide by the enzyme j8-glucosidase is presented in Fig. 12. It may be seen from the log concentration-response curves that the value at which the maximum reaction velocity is obtained, moves towards higher substrate concentrations under the influence of increasing concentrations of ethylene glycol. The ascending limb of the three curves remains in the same position, while the descending limb shifts to higher concentrations of the substrate. This strongly emphasizes that there is competition between ethylene glycol and phenolphthalein on the nonspecific receptors. In contrast to the view of the authors (65), it may therefore be stated that the shape of the family of curves, as shown in Fig. 12, is mainly due to the abolition of the substrate inhibition. Hence, the parameter β' of ethylene glycol is equal to or greater than zero. The possibility that β' in fact is greater than zero, cannot be excluded by these experiments.
For noncompetitive inhibition (β' = — 1), Eq. 16 is reduced to the well- known equation for the noncompetitive inhibition. Actually it is possible that β', although negative, is not equal to —1, which implies that such a non
competitive inhibition would not be complete.
111.3. Other Ways of Noncompetitive Interaction
As pointed out before, noncompetitive drugs may act by reacting with the same nonspecific receptors as does the substrate in the case of substrate inhibition. It is conceivable that there are yet other nonspecific receptors on the enzyme, the occupation of which by certain drugs will lead to an impair
ment or activation of the catalytic process. This different class of noncompeti
tive drugs does behave essentially identically to the normal noncompetitive drugs with respect to a substrate which is devoid of substrate inhibition.
However, if there is inhibition by the substrate at higher concentrations, it will be observed that the maximum in the log concentration-response curve is not shifted at all by this noncompetitive substance. The interaction between a substrate that exhibits substrate inhibition (S) and such an independent noncompetitive substance (B) may be represented by the following equation:
where ν$$'Β* is the initial reaction rate and KB is the dissociation constant of the receptor-substance complex, (E"B), while β" is a parameter.
7
Β[1 + (1+0')Β/Ζ
ΒΊ
(17)(l + KJS)(l+SIKs')(l + BIKB'f)