Based on Emotion Recognition Features
Gy¨orgy Kov´acs1,2
1 MTA Research Institute for Linguistics, Budapest, Hungary
2 MTA-SZTE Research Group on Artificial Intelligence, Szeged, Hungary gykovacs@inf.u-szeged.hu
Abstract. Social context is an important part of human communica- tion, hence it is also important for improved human computer interaction.
One aspect of social context is the level of formality. Here, motivated by the difference observed between the emotional annotation of formal and informal dialogues in the HuComTech corpus, we introduce a classifica- tion scheme based on feature sets designed for emotion recognition. With this method we attain an error rate of 8.8% in the classification of formal and informal dialogues on the test set of the corpus, which means a rel- ative error rate reduction of more than 40% compared to earlier results.
By combining our proposed method with earlier models, we were able to further reduce the error rate to below 7%.
Key words: HuComTech, SVM, MultiBoost, Affective computing
1 Introduction
Different facets of social context, such as the formality of a speech situation, are important aspects of human communication [1] and by extension human computer interaction (HCI). To understand how social context affects HCI, let us consider one of its basic tenets, namely speech recognition. Human speakers adjust their speaking style automatically to the social context, which in turn obliges the listener to make the same adjustment [2], regardless of whether the listener is another human or a computer. Another reason for considering social context is that by doing so, we can achieve a more natural user experience in dialogue systems [3]. For these reasons, our goal here is to classify dialogue segments into two categories based on the formality of the speaking situation.
For the classification of dialogue segments into the formal and informal cat- egories, we examine three different feature sets taken from the OpenSMILE toolkit [4] designed for emotion recognition. We do so based on the assump- tion that the formal context not only prompts more careful speech [5], but also a more reserved speaking style, displaying emotion in a different distribution to that displayed in an informal setting. We will examine this assumption in Section 2. Afterwards, we will describe the feature sets and the classification methods used in Section 3. Then we will discuss our experiments and the result- ing error rates in Section 4, and finally round off with our overall conclusions and possible directions for future work in Section 5.
with the aim of analysing the underlying structure of human-human communi- cation [7]. The HuComTech corpus was recorded using conversations taken from 111 native Hungarian speakers between the ages of 19 and 30, and it contains approximately 50 hours of spontaneous speech. Among the speakers were men and women from various backgrounds (living in a city or a village). With each speaker two dialogues were recorded; that is, a simulated job interview, and an informal conversation discussing various things ranging from jokes to their sad- dest memories. In each dialogue there were only two participants, namely the speaker (interviewee), and the agent (interviewer), who was the same person in both the formal and the informal dialogue.
In our experiments for the classification of segments taken from these dia- logues, we used the train/development/test partitioning established earlier for the task [8]. The reason for this decision was to make our results comparable with those reported by Szekr´enyes and Kov´acs [8]. In their study, they attempted to distinguish between dialogue segments from these scenarios based on prosodic in- formation, and turn-taking (attaining a classification error rate of 14.8%). Their method, however, relies on the availability of manual annotation of turn-taking, or an effective automatic speaker diarisation system. Here, we tackle this classi- fication problem using the emotional content of dialogues, applying feature sets that can be calculated in an entirely automatic fashion.
2.1 Annotation of emotion
The emotional annotation of audio in the HuComtech corpus was carried out as follows. First, an automatic phrase boundary detector program was applied (developed by the Technical University of Budapest). Then the resulting bound- aries were manually checked, and the proper labels were manually assigned to the phrases at five levels. At the emotional level nine different labels were used.
These labels were silence (for silences longer than 250 ms), overlapping speech (for segments where both participants were speaking), and seven emotional la- bels (neutral, sad, happy, surprised, recalling, tense, and other), based on the expressed emotion of the interviewee [9]. We examined the prevalence of these seven emotions in the formal and informal dialogues.
We worked under the supposition that different emotional classes would dom- inate the informal and the formal dialogues. To test this supposition, we exam- ined the ratio of each of the seven labels in the interviews. Using student’s paired t-test, we found that the difference in the proportion of emotional labels between formal and informal dialogues is significant in five out of the seven emotional categories: sad (withp <3·10−13), happy (withp <3·10−19), surprised (with p <2·10−3), recalling (withp <2·10−12), and other (withp <9·10−6). The ratio of four of these emotions in the formal and informal dialogues can be seen in the box plots of Figure 1.
Fig. 1.Comparison of the ratio of happiness, sadness, surprise, and recall in the infor- mal and formal dialogues.
As can be seen in Figure 1, the recalling emotion is significantly more preva- lent in the formal dialogues than in the informal ones, while the other three emotions are relatively more common in the informal conversations.
3 Methodology
3.1 Feature sets for emotion recognition
Given the significant difference in the proportion of various emotional labels be- tween the formal and informal dialogues, one possibility for automatic classifica- tion would be to train a machine learning model for the recognition of emotions from the audio signal, and then use the output of this model as the basis for features to make the informal/formal distinction. We decided against this course of action, for two reasons, however. For one, emotional annotation was carried out by only one person on each file, and while his work was checked, we still have no way of calculating useful measures for the reliability of the annotation, such as the inter-rater agreement [10]. Furthermore, the expressed emotion of only one party was annotated, which means that we have no information on the expressed emotions of the interviewer. Instead of using the feature sets proposed for the recognition of emotion on the problem of distinguishing between infor- mal and formal dialogue segments indirectly, we shall try to apply the emotion recognition features directly on our task. We will examine three different feature sets taken from the OpenSMILE toolkit [4]. These feature sets are as follows:
1. IS09: the feature set used in the Classifier sub-challenge of the Interspeech 2009 Emotion challenge, containing 384 features, which were at the time
“the most common and [...] promising” [11].
2. Emobase: the OpenSMILE emobase feature set, containing 988 acoustic fea- tures [12]
3. Emobase2010: the 1582 dimensional emobase2010 feature set, based on the feature set used in the Interspeech 2010 Paralinguistic challenge [13].
Before further processing, features calculated with each feature set were stan- dardised so as to have a zero mean and unit variance. In the process, those features whose values had a standard deviation of zero were eliminated.
overlapping segments, but used each dialogue segment as a training, development or test instance. This means that we had 1410 examples altogether. We selected the machine learning techniques applied accordingly.
Support Vector Machines Support Vector Machines (SVMs) in classifica- tion tasks use hyperplanes for the separation of classes. Here, we applied the libSVM implementation of this algorithm [14], with a linear kernel. For parame- ter optimisation we used the development set, and ran the complexity parameter between 2−13and 213(with a step size of 2 in the exponent).
Boosting For the sake of comparison, we experimented with various boost- ing techniques using the MultiBoost package [15]. Based on the results of our initial experiments with the Emobase2010 feature set using AdaBoost [16], Lazy- Boost [17], and FilterBoost [18], we decided to carry out our experiments with the FilterBoost method, using a decision tree with eight leaves. To optimise the number of iterations, we trained 100 models for each feature set, and used the average performance of these models after every 10 iterations on the develop- ment set as a stopping criterion. Besides the average performance of our models, we also report the performance attained when each instance is classified based on the majority vote of the 100 models.
Combination methods In addition to examining the three feature sets de- scribed above, we also examined the combination of these feature sets. Here, we used two methods of fusion for this:
– Early fusion: here, we combined the three feature sets, and repeated our experiments using the resulting feature set. The dimensionality of this feature set was 2378, as there were several overlaps in the original sets.
– Late fusion: here, we take the weighted sum of the estimated posterior probability scores created using the models trained on the individual feature sets, and classify each instance based on the resulting score. In the case of the FilterBoost models, we derived the posterior probability estimates from the results of voting (i.e. the estimated posterior value for each class was the number of models voting for the given class divided by the number of models altogether – 100). The final weights were selected based on the results of applying different weighting schemes on the development set.
We also tried to combine the posterior probability estimates obtained from the Deep Rectifier Neural Net (DRN) models trained by Szekr´enyes and Kov´acs [8]
on features resulting from the ProsoTool [19] algorithm. For this combination, we also used the method of late fusion.
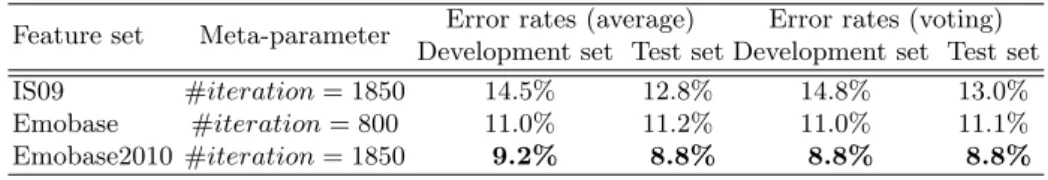
Table 1.Recognition error rates attained using FilterBoost on the individual feature sets of the OpenSMILE toolkit (the best results are shown in bold)
Feature set Meta-parameter Error rates (average) Error rates (voting) Development set Test set Development set Test set
IS09 #iteration= 1850 14.5% 12.8% 14.8% 13.0%
Emobase #iteration= 800 11.0% 11.2% 11.0% 11.1%
Emobase2010 #iteration= 1850 9.2% 8.8% 8.8% 8.8%
4 Experiments and results
4.1 Experiments using FilterBoost
Here, we first report our classification results obtained using FilterBoosting.
Table 1 lists the results obtained when FilterBoosting was applied on individual filter sets of the OpenSMILE toolkit. When comparing the results obtained using different filter sets, we can see that the lowest error rates (regardless of whether we averaged the results of different models, or based on our decision on their majority vote) were got using the Emobase2010 filter set, while the highest error rates were invariably got using the IS09 filter set. We can also see that results obtained by averaging and results obtained by voting are very similar in each case. Most of the differences are likely to be due to the limited size of the development and test set. Lastly, we can see that the results reported on the test set are very similar, and sometimes even better than those reported on the development set, which suggests that despite the many iterations made, overfitting was probably not an issue.
The results obtained when using the method of FilterBoosting with early fusion and late fusion are listed in Table 2. From the meta-parameter column, we can see here that the best results were obtained when the posterior estimates from the FilterBoost model using the IS09 filter set and the Emobase filter set were assigned a weighting factor of 0.25, while the posterior estimates from the FilterBoost model using the Emobase2010 filter set were assigned a weighting factor of 0.5. However, when comparing these results with those in Table 1 we can see that neither method of combination actually improved the resulting error rates.
Table 2.Recognition error rates attained using FilterBoost and various methods of combination (the best results are shown in bold)
Method of
Meta-parameter Error rates (average) Error rates (voting) combination Development set Test set Development set Test set
Early fusion #iteration= 3000 11.00% 9.8% 10.3% 9.7%
Late fusion weights= [0.25,0.25,0.5] – – 8.8% 9.3%
Development set Test set
IS09 C= 2−9 13.2% 13.0%
Emobase C= 2−9 11.0% 12.0%
Emobase2010 C= 2−9 11.0% 10.2%
4.2 Experiments using SVMs
Next, we report our classification results obtained using SVMs. Table 3 lists the results we got using individual emotion recognition feature sets. Here, similar to the FilterBoost results, the error rates are the highest when using the IS09 feature set, and lowest when using the Emobase2010 feature set. We can also see, however, that the performance of the Emobase and Emobase2010 feature sets on the development set are identical. And as we found earlier, the difference between error rates got on the development and the test set is quite small.
The results obtained by combining the three individual feature sets in various ways are given in Table 4. Here, we observe that when using support vector machines, the performance of early fusion and performance of late fusion do not differ markedly. When comparing the results achieved with SVMs to those achieved with FilterBoost, we find that – unlike in the case of FilterBoost – when using SVMs both fusion methods led to lower the resulting error rates. It is also interesting to note that despite the similar individual performance of the Emobase and Emobase2010 feature sets, in the combination found to be optimal on the development set, the weighting factor assigned to the latter is about twice as big as the weighting factor assigned to the former.
4.3 Combination of different classifiers using late fusion
In our last set of experiments, we experimented with the late fusion of mod- els derived from applying different machine learning algorithms. The results of these experiments are shown in Table 5. Here, the weighting meta-parameters are reported in such a way that the first element of the vector represents the weighting factor assigned to the method listed in the first column of the table, and the second element of the vector represents the weighting factor assigned to the method listed in the second column of the table.
Table 4.Recognition error rates attained using SVMs and various methods of combi- nation (the best results are shown in bold)
Method of
Meta-parameter Error rates
combination Development set Test set
Early fusion C= 2−11 10.3% 9.7%
Late fusion weights= [0.20,0.25,0.55] 10.3% 9.3%
Table 5.Recognition error rates attained with late fusion of our current models, and the DRN models of Szekr´enyes and Kov´acs [8] (the best results are shown in bold)
Methods
Meta-parameter Error rates
M ethod1 M ethod2 Development set Test set
FilterBoost on Emobase2010 SVM early fusionweights= [0.25,0.75] 8.8% 8.3%
FilterBoost on Emobase2010 DRN weights= [0.25,0.75] 8.1% 8.8%
SVM early fusion DRN weights= [0.25,0.75] 8.8% 8.3%
SVM late fusion DRN weights= [0.20,0.80] 6.6% 6.9%
DRN –3 14.0% 14.8%
Human performance – – 43.5%
1A detailed discussion of the meta-parameters of the DRN applied by Szekr´enyes and Kov´acs is beyond the scope of this paper. For more details, see [8].
First, we examined the combination of the best performing methods in the current paper. As can be seen in Table 5, when combining the probability esti- mates obtained from the FilterBoost and SVM models, the resulting error rates on the development set are not lower than those obtained when using just the FilterBoost model. We get similar results when combining the output of the FilterBoost model with those of the Deep Rectifier Neural Net (DRN) model of Szekr´enyes and Kov´acs [8]. However, by combining the posterior probability estimates derived from our SVM models with those derived from the above- mentioned DRN models, we can greatly lower the error rates obtained on the classification task. When applying late fusion on the probability estimates we got from the late fusion of our SVM models, we can achieve a relative error rate re- duction of about 84.1%, 53.4%, and 21.6% compared to the human performance, the DRN results, and the results of our best individual model, respectively.
5 Conclusions and future work
In this study, we examined three different emotion recognition feature sets for the task of the classification of formal and informal dialogue segments. Although we obtained the lowest error rates when combining different models, the use of individual models also markedly lowered the classification error rates compared to those reported earlier using DRNs or human processing. This fact, and the investigation of emotion labels in the HuComTech corpus seem to support our hypothesis that formal and informal dialogues markedly differ in their emotional content. However, as the feature sets utilised do not exclusively measure the emotional content of speech, and the fact the we only examined one corpus, the conclusive confirmation of our hypothesis would require doing more experiments.
Further experiments might also be beneficial regarding the classification rates attained. One possibility would be to apply feature selection on the feature sets.
Another might be to increase the number of instances by either including the dialogue segments shorter than 30 seconds (that had been excluded from the train/development/test partitioning by Szekr´enyes and Kov´acs) in our exam- ination, or by partitioning dialogues into smaller segments. Lastly, additional corpora and feature sets could be included in the study.
References
1. Labov, W.: The social stratification of English in New York City. Cambridge University Press (2006 [1996])
2. Ingram, J.C.L.: Neurolinguistics. Cambridge University Press (2007)
3. Andr´e, E., Rehm, M., Minker, W., Buhler, D.: Endowing spoken language dialogue systems with emotional intelligence. In: ADS. LNCS 3068 (2004) 178–187 4. Eyben, F., W¨ollmer, M., Schuller, B.: Opensmile: the Munich versatile and fast
open-source audio feature extractor. In: Proc ACM (MM). (2010) 1459–1462 5. Kristiansen, T.: Attitudes, ideology and awareness. In Wodak, R., Johnstone,
B., Kerswill, P., eds.: The SAGE handbook of sociolinguistics. SAGE Publishing (2011) 265–278
6. Hunyadi, L., V´aradi, T., Szekr´enyes, I.: Language technology tools and resources for the analysis of multimodal communication. In: Proc. LT4DH. University of T¨ubingen, T¨ubingen (2016) 117–124
7. Hunyadi, L.: Multimodal human-computer interaction technologies. Theoretical modeling and application in speech processing. Argumentum (2011) 240–260 8. Szekr´enyes, I., Kov´acs, G.: Classification of formal and informal dialogues based
on turn-taking and intonation using deep neural networks. In: Proc. SPECOM.
(2017) 233–243
9. P´apay, K., Szeghalmy, S., Szekr´enyes, I.: HuComTech multimodal corpus annota- tion. Argumentum (2011) 330–347
10. Siegert, I., B¨ock, R., Wendmeuth, A.: Inter-rater reliability for emotion annotation in human-computer interaction: comparison and methodological improvements.
Multimodal User Interfaces (2014) 17–28
11. Schuller, B., Steidl, S., Batliner, A.: The interspeech 2009 emotion challenge. In:
Proc. Interspeech. (2009) 312–315
12. Eyben, F., W¨ollmer, M., Schuller, B.: The Munich open speech and music inter- pretation by large space extraction toolkit (2010)
13. Schuller, B., Steidl, S., Batliner, A., Burkhardt, F., Devillers, L., Muller, C., Narayanan, S.S.: The interspeech 2010 paralinguistic challenge. In: Proc. In- terspeech. (2010) 2822–2825
14. Chang, C.C., Lin, C.J.: LIBSVM: A library for support vector machines. ACM Transactions on Intelligent Systems and Technology 2(2011) 27:1–27:27
15. Benbouzid, D., Busa-Fekete, R., Casagrande, N., Collin, F.D., K´egl, B.: Multi- Boost: a multi-purpose boosting package. Journal of Machine Learning Research 13(2012) 549–553
16. Freund, Y., Schapire, R.E.: A decision-theoretic generalization of on-line learning and an application to boosting. J. Comput. Syst. Sci55(1997) 119–139
17. G. Escudero, L.M., Rigau, G.: Boosting applied to word sense disambiguation. In:
Proc. ECML. (2000) 129–141
18. Bradley, J., Schapire, R.: Filterboost: Regression and classification on large datasets. In: Advances in Neural Information Processing Systems. Volume 20.
The MIT Press (2008) 185–192
19. Szekr´enyes, I.: ProsoTool, a method for automatic annotation of fundamental frequency. In: Proc. CogInfoCom. (2015) 291–296


![Table 5. Recognition error rates attained with late fusion of our current models, and the DRN models of Szekr´ enyes and Kov´ acs [8] (the best results are shown in bold)](https://thumb-eu.123doks.com/thumbv2/9dokorg/1338443.108646/7.892.205.723.219.342/table-recognition-attained-fusion-current-models-models-results.webp)
