BeStSel: a web server for accurate protein secondary structure prediction and fold recognition from the
circular dichroism spectra
Andr ´as Micsonai
1, Frank Wien
2, ´ Eva Buly ´aki
1, Judit Kun
1, ´ Eva Moussong
1, Young-Ho Lee
3, Yuji Goto
3, Matthieu R ´efr ´egiers
2and J ´ ozsef Kardos
1,*1ELTE NAP Neuroimmunology Research Group, Department of Biochemistry, ELTE E ¨otv ¨os Lor ´and University, Budapest H-1117, Hungary,2Synchrotron SOLEIL, Gif-sur-Yvette 91192, France and3Institute for Protein Research, Osaka University, Osaka 565-0871, Japan
Received February 24, 2018; Revised May 17, 2018; Editorial Decision May 18, 2018; Accepted May 22, 2018
ABSTRACT
Circular dichroism (CD) spectroscopy is a widely used method to study the protein secondary struc- ture. However, for decades, the general opinion was that the correct estimation of-sheet content is chal- lenging because of the large spectral and structural diversity of -sheets. Recently, we showed that the orientation and twisting of-sheets account for the observed spectral diversity, and developed a new method to estimate accurately the secondary struc- ture (PNAS, 112, E3095). BeStSel web server pro- vides the Beta Structure Selection method to an- alyze the CD spectra recorded by conventional or synchrotron radiation CD equipment. Both normal- ized and measured data can be uploaded to the server either as a single spectrum or series of spec- tra. The originality of BeStSel is that it carries out a detailed secondary structure analysis providing information on eight secondary structure compo- nents including parallel- structure and antiparal- lel -sheets with three different groups of twist.
Based on these, it predicts the protein fold down to the topology/homology level of the CATH pro- tein fold classification. The server also provides a module to analyze the structures deposited in the PDB for BeStSel secondary structure contents in re- lation to Dictionary of Secondary Structure of Pro- teins data. The BeStSel server is freely accessible at http://bestsel.elte.hu.
INTRODUCTION
Circular dichroism (CD) spectroscopy is a widely used spec- troscopic technique that measures the differential absorp- tion between left and right circularly polarized light. In pro-
teins, the peptide bonds contribute mostly to the far-UV CD spectrum between 170 and 250 nm. It was observed al- ready 50 years ago that different proteins can exhibit dis- tinct spectral profiles (1) depending on the conformation and environment of the peptide bonds and their H-bonding pattern, which are characteristic to the secondary structure of the proteins. With the development of the instrumenta- tion, conventional benchtop CD instruments have become widely available. Moreover, the setup of synchrotron radi- ation CD spectroscopy provides a broad wavelength range and low noise for high quality CD spectra (2). In structural biology, the number of atomic resolution protein structures has been increased rapidly and more and more of them had their CD spectra recorded. These reference spectra of pro- teins with known structures stimulated the construction of a variety of algorithms to analyze the CD spectra to gain sec- ondary structure information. These methods distinguish three–six secondary structure components, which are most often helix, -sheet, turn and ‘others’ (disordered) (3–9).
They predict the helix content more-or-less accurately, while often fail to predict the-sheet content.-sheets can largely differ in the parallel-antiparallel orientation, in the length and number of strands and in their twists. This structural variety is manifested in the CD spectral diversity which has been generally believed to be an inherent limitation for the secondary structure estimation (10). The worst examples were the amyloid fibrils having high-sheet content which was predicted as helix by most of the previously available methods (11). The spectral diversity of proteins having sim- ilar amount of different type of -structures is presented in Figure1. Investigating this problem we have shown re- cently that the parallel-antiparallel orientation and the twist of the-sheets account for the observed spectral diversity of-sheets (11). We have developed a new method, BeStSel (Beta Structure Selection), that takes into account the ori- entation and twist of the-sheets and provides improved accuracy on a broader range of protein structures includ-
*To whom correspondence should be addressed. J. Kardos. Tel: +36 1 372 2500/1795; Fax: +36 1 381 2172; E-mail: kardos@elte.hu
C The Author(s) 2018. Published by Oxford University Press on behalf of Nucleic Acids Research.
This is an Open Access article distributed under the terms of the Creative Commons Attribution Non-Commercial License
(http://creativecommons.org/licenses/by-nc/4.0/), which permits non-commercial re-use, distribution, and reproduction in any medium, provided the original work is properly cited. For commercial re-use, please contact journals.permissions@oup.com
Downloaded from https://academic.oup.com/nar/article-abstract/46/W1/W315/5035652 by guest on 25 September 2018
Figure 1. Spectral and structural diversity of mainly-structured proteins. (A) CD spectra of-amyloid (1–42) fibrils (red), native2-microglobulin (b2m, blue) and soybean trypsin inhibitor (SBTI, green) downloaded from PCDDB (40). (B) Solid-state NMR model (PDB ID: 2BEG, (41)) of amyloid-fibrils consisting of parallel-sheets, (C) relaxed (slightly right-hand twisted) antiparallel-sheets of b2m (PDB ID: 2YXF, (42)) and (D) highly right-hand twisted antiparallel-structure of SBTI (PDB ID: 1BA7, (43)). Previously available methods had difficulties with quantitative analyses of these spectra and their structural distinction, especially that of the amyloid fibrils (11).
ing -sheet-rich proteins, membrane proteins, protein ag- gregates and amyloid fibrils. The method estimates even␣- helix content more accurately than previous methods but its strength is that it provides detailed information on the
-sheets, distinguishing parallel-sheets and antiparallel
-sheets with three different twists, left-hand twisted, re- laxed (slightly right-hand twisted) and right-hand twisted (11). The secondary structure components of BeStSel are presented in Figure 2. We have also shown for the first time, that this increased structural information gained from the CD spectrum makes possible the prediction of the pro- tein fold down to the topology level using the CATH fold classification (12). A web server was constructed athttp:
//bestsel.elte.humaking the BeStSel method freely accessi- ble for the scientific community. It is indispensable when a quick and reliable structure analysis is needed and especially useful when X-ray crystallography or nuclear magnetic res- onance (NMR) are not feasible.
MATERIALS AND METHODS (WEB SERVER DE- SCRIPTION)
Secondary structure elements of BeStSel and the twist of- sheets
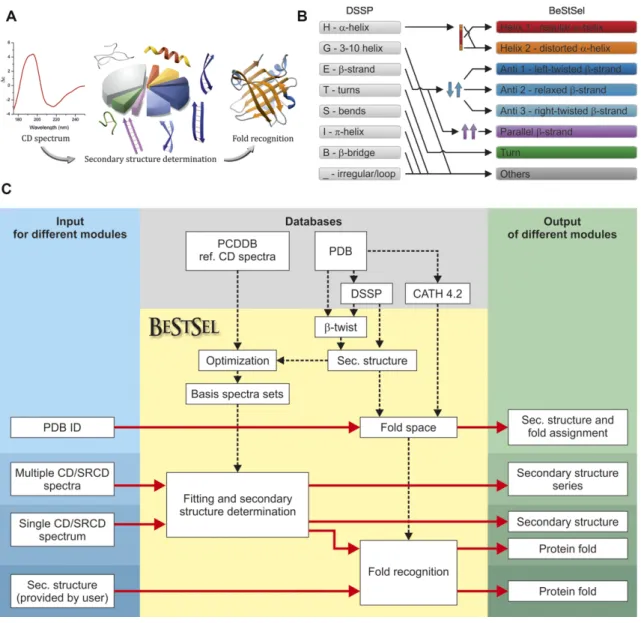
Eight secondary structure elements are defined in BeStSel based on Dictionary of Secondary Structure of Proteins (DSSP (13)) as presented in Figure2. Residues assigned to
␣-helix by DSSP are divided into two groups, regular, and distorted, as the middle part of␣-helices (Helix1) and two residues at both ends of␣-helices (Helix2), respectively. The overall-sheet content was determined by the fraction of the residues assigned to-strand by DSSP. Parallel-sheets are distinguished from antiparallel ones. The twisting an- gles for-sheets are determined as the angles between the peptide backbones of two neighboring-strands at the lo- cations of pairs of adjacent residues along the neighboring
-strands as adapted from Ho and Curmi (11,14). Accord- ing to the twisting angles, the antiparallel-sheet content was divided into three groups using +3◦and +23◦as bound- aries between the groups named left-hand twisted (Anti1), relaxed (slightly right-hand twisted, Anti2) and right-hand twisted (Anti3). Turn in BeStSel is defined identically to that
in DSSP (13). All other residues, including invisible ones in the three-dimensional structures, are assigned to ‘Others’.
CD spectrum reference sets and basis spectra of BeStSel A reference CD spectrum set of 73 proteins with known 3D-structures was used to optimize the BeStSel basis spec- tra. The reference set consisted of the spectra of the SP175 SRCD reference set of PCDDB (15) and some additional- structure-rich spectra that were also deposited in PCDDB (see Micsonaiet al(11)). Another set of proteins was used as an independent test set of-structure-rich proteins or proteins with rare secondary structure composition (11).
For the secondary structure determination, BeStSel uses the pre-calculated, fixed basis spectrum sets by fitting the CD spectrum of any unknown protein with the linear com- bination of the basis spectra (11). Each set contains eight basis spectra for the eight secondary structure components.
However, each basis spectrum set is optimized separately for one of the secondary structure components, e.g. Helix1 content is determined using the basis spectra optimized to provide the best results on Helix1, and taken as the Helix1 fraction from the fitting. The other seven secondary struc- ture contents are determined similarly from the other seven fittings. In each case, the basis spectra were calculated by least squares method on an optimized reference spectrum and wavelength data subset. The entire optimization pro- cess was separately executed for the different wavelength ranges offered by the BeStSel server (175–250, 180–250, 190–250 and 200–250 nm). The optimization procedure to get the basis spectra sets is described in details by Micsonai et al.(11).
Protein fold prediction by BeStSel
The criteria for a successful fold recognition from the sec- ondary structure contents is that the secondary structure elements and their composition should be characteristic to the protein fold. Two proteins with similar secondary structure composition and chain length should have simi- lar folds. A simple secondary structure decomposition with three components, such as helix,-sheet and ‘others’ is ob- viously insufficient for protein fold characterization, mainly
Downloaded from https://academic.oup.com/nar/article-abstract/46/W1/W315/5035652 by guest on 25 September 2018
Figure 2. The framework of the BeStSel server. (A) Schematic representation of CD spectrum analysis. First, the secondary structure contents are deter- mined for the eight components of BeStSel. Then, based on the secondary structure composition a search can be carried out for the most similar structures in the dataset derived from PDB and find out their fold classification. (B) Secondary structure elements defined in BeStSel as derived from DSSP. The regular, middle part of an␣-helix is distinguished from the ends (distorted helix),-sheets are divided into four groups, parallel-sheets and antiparallel left-hand twisted, regular and right-hand twisted-sheets. Turn component covers the-turns, and the ‘Others’ represent the rest of the structural elements and the irregular or disordered structures. (C) Block diagram showing the modules and functions of the BeStSel package. Input data are on the left, output data presented on the right. From a single CD spectrum the secondary structure contents are estimated and then, based on these, the protein fold can be predicted. A series of CD spectra as input can be evaluated at once to get the secondary structure contents. Users can provide arbitrary secondary structure contents and carry out the fold prediction for that secondary structure composition. Users can also enter PDB IDs as input to find out the corresponding secondary structure contents and fold classification.
because of the diversity of -structures, which vary from parallel-sheets and-helices to antiparallel plain-sheets,
-barrels, highly twisted structures and their combinations.
␣-helical folds can be specified by the number and length of helices, which cannot be revealed by a single overall␣- helix content. The eight secondary structure elements of BeStSel are better descriptors of the protein structure and suitable for fold prediction (11). Intriguingly, DSSP, which also provides eight secondary structure components, is less characteristic to the protein fold containing several com- ponents which are less related to the protein fold, such as the bends,-bridges and-helices. In the BeStSel package,
the CATH protein fold classification is used (12), which dis- tinguishes several hierarchical levels of protein fold, start- ing from the class to architecture, topology, homology (su- perfamily) and further levels. Every single protein structure can be represented by a point in the eight-dimensional sec- ondary structure space of BeStSel. The distance between two points is defined by their Euclidean distance. The search for the protein fold corresponding to a secondary struc- ture composition is based on the CATH classifications of the protein structures deposited in the PDB, i.e. we search for structures in the PDB that have similar secondary struc- ture composition to the result of the CD analysis and then
Downloaded from https://academic.oup.com/nar/article-abstract/46/W1/W315/5035652 by guest on 25 September 2018
The simplest method makes a search on the entire PDB and sorts out the twenty closest structures regarding the Euclidean distance from the secondary structure of inter- est in the eight-dimensional space. The CATH classifica- tion of the resulting structures are listed out and the user can examine these structures by using additional external information, e.g. chain length and sequence information.
In the case of single domain proteins, we use a reference database that contains the non-redundant (95% sequence identity is allowed) single domain reference subset of CATH 4.2 (16) and the corresponding secondary structure compo- sitions calculated from the respecting PDB structures. This database contains 55350 chains (domains) covering the four fold classes, 41 architectures, 1310 topologies and 5398 ho- mologies. Three different methods are available for predic- tion of single domain proteins: (i) BeStSel searches for the closest structures in the Euclidean space. The method does not take into account the possible error of the secondary structure estimation. This is useful for structures lying in a rarely populated part of the secondary structure space (fold space). (ii) The algorithm searches for all the domains that lie within 1.5×RMSD distance in each structural element from the estimated secondary structure. In other words, we look up the structures in a box centered to the BeStSel re- sult. The size of the box is determined by the RMSD of BeStSel on SP175 reference set. The hits in the box are sorted out for classes, architectures and topologies. The re- sulting table shows the frequencies and percentages of the different groups in the CATH categories in the order of fre- quency. In the most dense regions of the secondary struc- tural space hundreds of points can be found in the box (i.e.
within the expected error of BeStSel), and the closest struc- tures are not necessarily the correct ones. In most cases, this method provides the highest reliability. (iii) The weighted K- nearest neighbors (WKNN) (17) method: in each layer (class, architecture, topology and homology) the predicted categories are ordered by WKNN score, which is defined by the sum of the weighted distance (reverse square city block distance) of every structures (from the query point) among the K-nearest neighbors which belong to the same category.
The operation of the BeStSel web server
The BeStSel web server is freely available for academic users.
A detailed description of the use of the server is provided in the tutorial.pdf file, which is attached as Supplementary Material. The homepage also provides short helps, explana- tions and important tips for users. Error messages explain when data format is inappropriate. The homepage provides four program blocks: Single spectrum analysis, Fold recog-
case, protein concentration, number of residues and path- length data should be given, as well. The spectral data can be copied into the BeStSel text box or uploaded from a text file. Text file outputs of various instruments are usable.
The program recognizes automatically the file header and the data columns. Column separator can be space, comma, semicolon or tab. The order of wavelength data is handled properly. The data step can be different from 1 nm/data, the program will convert it automatically to data in 1 nm steps.
For data upload, a captcha should be provided to prevent automatic attacks from the internet. After uploading, the Data Examination page appears, where the user can verify the correct handling of the data. The secondary structure calculation is initiated with a single click. The output is a graphical presentation of the secondary structure contents and the spectral fitting with RMSD and normalized RMSD (NRMSD) data. It can be saved either in the graphical form or in text format for further data processing or figure prepa- ration. The users can adjust the wavelength range and use a scaling factor to recalculate the results. The form of the out- put data can be modified for the convenience of the user.
The ‘Best factor’ function carries out a series of analysis by changing the current scaling factor automatically in the range of 0.5–2. This function is useful to study how the re- sults depend on the amplitude of the CD spectrum (if there is an uncertainty in the concentration or pathlength). The factor with the lowest NRMSD should not be taken as cor- rection for your normalized spectrum when used in the 190–
250 or 200–250 nm range. The correct concentration deter- mination is essential for accurate analysis. When 175–250 or 180–250 range is used and the best factor is significantly different from 1.0, it indicates possible normalization prob- lems, and the factor can be taken as a suggestion.
Protein fold prediction can be initiated from the results of the CD spectrum analysis by one click. Four different types of analyses are provided. (i) Search on the entire PDB for structures with similar secondary structure composition.
The closest 20 structures are shown with links to the PDB.
(ii) Search on the single-domain PDB subset for the clos- est structures. The 10 closest domains are listed with their CATH classifications and PDB links. (iii) Search on the single-domain reference set for structures that lie within the expected error of CD spectrum analysis. A list is given for the CATH classes in the order of frequency and the 10 most frequent architectures and topologies are shown. Represen- tative graphical images for the most frequent CATH topolo- gies are presented. (iv) The weighted K-nearest neighbors’
(WKNN) method predicts the class, architecture, topology and homology of the protein. The description of the predic- tion methods is presented above and in the ‘Materials and Methods’ section.
Downloaded from https://academic.oup.com/nar/article-abstract/46/W1/W315/5035652 by guest on 25 September 2018
The second module, the ‘Fold recognition’ module of the server is used to predict the fold of a protein from secondary structure contents provided by the user. The calculation can be initiated after the manual input of the eight secondary structure components with the condition they sum up to 100.0% and the chain length is provided. The protein fold will be predicted by the four methods described in the first module. The output is a list of the highest ranked 1, 5, 10, and 15 CATH classes, architectures, topologies and ho- mologies, respectively. Although the WKNN method pro- vides the most reliable fold predictions on accurate sec- ondary structure contents, its performance declines when there is an estimation error in the secondary structure com- position. However, it is excellent for structural studies to find out the fold of model structures or structures originated from the PDB.
The third block is to analyze a series of CD spectra simul- taneously, which can be useful when recording CD spectra as the function of temperature, ligand concentration, etc.
Data can be copied into the text box (e.g. from a spread- sheet) or opened from a text file. Similarly to the single spectrum analysis, data can be normalized or measured. Af- ter data examination, the analysis is carried out by a single clicking. Graphical or text output both are available. Wave- length range and a scaling factor can be set for recalcula- tion.
The fourth, ‘Secondary structure and -sheet decom- position for PDB structure’ module calculates the sec- ondary structure composition of known protein structures deposited in the PDB on the basis of the eight structural ele- ments of BeStSel. For comparison, DSSP data (13) and Sel- con3 (5) composition are also calculated. As input, a PDB ID should be given in four letters code format.
RESULTS AND DISCUSSION Performance
The major challenge in protein CD spectroscopy is to find out, which secondary structure elements contribute to the CD signal and withdraw all the structural informa- tion buried in the spectrum. The BeStSel algorithm intro- duced entirely new secondary structure components by tak- ing into account the twist of the antiparallel-sheets. Al- together, it distinguishes eight secondary structure compo- nents and outperforms the previously available methods re- garding any of the components (11). A great advantage of the method over the previous ones is that it can be used to estimate reliably the structure of-sheet-rich proteins, in- cluding membrane proteins, protein aggregates and amy- loid fibrils. On an independent set of ‘problematic’ pro- teins, calculated to a common basis of helix, antiparallel-, parallel-, overall-sheet and ‘turn+others’ structures, the RMSDs for secondary structure estimation were proved to be 0.038, 0.050, 0.032, 0.039 and 0.033 for BeStSel, while the other methods provided RMSDs in the ranges 0.083–
0.26, 0.12–0.214, 0.076–0.198, 0.068–0.23 and 0.074–0.232, respectively (11). None of the previous methods performed evenly for the different secondary structure components.
BeStSel provides the highest accuracy in the SRCD range of
175–250 nm. However, its performance is still fully accept- able even in the 200–250 nm wavelength range which is often used in measurements carried out using conventional spec- tropolarimeters (see Micsonaiet al.(11) for detailed statis- tics). However, using the narrower wavelength range needs especially accurate concentration and pathlength determi- nation.
The orientation and twisting of-sheets together with the helical and ‘others’ secondary structure components char- acterize the protein folding pattern and make the prediction of protein fold possible down to the topology/homology levels regarding the CATH protein fold classification (12).
Supplementary Table S1 shows the theoretical reliability of the fold prediction calculated on the domains of CATH 4.2 (16) as secondary structure inputs in a 5-fold cross-validated manner. Supplementary Table S2 presents the performance of the various fold prediction methods on the SP175 SRCD reference set comparing the CATH 4.2 single domain set to that of CATH 3.5. The ‘Box’ and WKNN methods pro- vided the highest reliability.
Applications
CD spectroscopy of proteins, combined with the reliable secondary structure determination of BeStSel can be used to study the correct folding of recombinant proteins, ex- perimental validation of protein models, the effect of the environmental conditions and mutations, the structure of amyloid fibrils and toxic oligomers and binding interac- tions. The BeStSel method was used to verify the correct fold of recombinant proteins (18,19). Tayeb-Fligelmanet al.
investigated the structural changes upon the ‘cross-alpha’
amyloid-like polymer formation of PSM␣3 peptide (20).
Misraet al. followed the time-dependent changes in sec- ondary structure contents upon aggregation of polyQ-A variants (21). Chanet al.analyzed the secondary structure of the amyloidogenic LARA domain of bacterial regula- tory adenosine triphosphatase variant A (RavA) (22). Ya- maguchiet al.showed that during the continuous ultrason- ication the full-length mouse prion protein (PrP) forms dis- torted fibrils,-oligomers and amorphous aggregates at dif- ferent pH (23). Linet al., investigated the aggregation of cytochrome C (24). Malmoset al.demonstrated how gly- cosaminoglycans promote fibrillation of salmon calcitonin (25). Jayaramanet al.investigated the effect of lipid envi- ronment on amyloid fibril formation of human serum amy- loid A (26). Yanget al.analyzed the structural changes of wild-type and mutant presenilins (PS1 and PS2) in lipid environment (27). Sahooet al.studied the interaction be- tween bovine myeloid matured cathelicidin-5 (BMAP-28) and large unilamellar vesicles (28). Terakawaet al.showed increased helical contents of␣-synuclein with the increase in the concentration of lipids of small unilamellar vesicles (29). The reliability of structural models were confirmed by CD spectroscopy and BeStSel on functional amyloid trans- porter from Pseudomonas, FapF, and its coiled coil pep- tide derivative (30), myoglobin and FK506 binding pro- tein (FKBP) (31) and Stl protein (32). Saj ´o et al.studied the non-cooperative thermal denaturation of FliS, the four- helix bundle flagellar chaperone protein. They found that
Downloaded from https://academic.oup.com/nar/article-abstract/46/W1/W315/5035652 by guest on 25 September 2018
CD spectra at 5◦C steps. BeStSel analysis showed that the main conformational change upon denaturation is the dis- ruption of the␣-helices and increase of disordered confor- mation. The length and number of␣-helices are gradually decreasing in a broad temperature range to an almost to- tal loss at 100◦C (Supplementary Figure S1A–C). Kinetics of partial unfolding of human2-microglobulin Asp38Ala variant was followed by CD spectroscopy in the presence of 0.5 mM SDS. According to BeStSel, the main confor- mational change is a significant decrease in overall antipar- allel -sheet content while there was no parallel -sheet detectable (Supplementary Figure S1D–F). Aggregation of amyloid-(1–42) peptide was followed by CD spectroscopy at 37◦C. After a lagtime, we can see the formation of par- allel-sheet structure in parallel with the formation of the amyloid fibrils as verified by electron microscopy (Supple- mentary Figure S1G–I).
NEW FEATURES
The first version of BeStSel was released in 2015 as de- scribed by Micsonaiet al.(11) and was optimized for Fire- fox. The current version works on any web browser. The background databases were updated; originally it recog- nized 87356 PDB structures for secondary structure anal- ysis and fold classification which is up-to-date now with 130254 structures. The updated single domain dataset used as a basis for fold prediction contains now 55350 single domains versus 10433 and based on CATH 4.2 instead of CATH 3.5. It covers 41 architectures, 1310 topologies and 5398 homologies (previously were 38, 783 and 1490, re- spectively). There is a fourth module for data input, users can provide arbitrary secondary structure contents and the searches for similar structures and fold prediction is carried out on these data. A fourth fold prediction method is intro- duced applying a WKNN search engine. While information and help are provided throughout the use of the web server, a downloadable detailed tutorial is also added.
LIMITATIONS AND FURTHER DEVELOPMENTS Although BeStSel provides accurate secondary structure es- timation for a broad range of proteins, its eight secondary structure components do not account for some special sec- ondary structure types. Polyproline-II helix which is char- acteristic of collagen-like structures, different type of turns that are often the main structural components of short pep- tides, 310-helices which appear in higher amounts in some globular proteins are not distinguished by BeStSel and thus analysis for such structures is not adequate. BeStSel does not treat the aromatic contributions which gives some un- certainty in the case of high number of aromatic residues.
proteins (IDPs). For IDPs, molecular dynamics simulations give the corresponding structural ensembles. Re-optimizing BeStSel on the extended reference set will further improve its performance on-structured proteins and on proteins containing larger disordered segments and on IDPs.
CONCLUSION
The BeStSel web server applies the BeStSel method for sec- ondary structure determination and fold prediction from the CD spectra. It takes into account the orientation and twist of the-sheets which are responsible for the spectral diversity of-structures. Using eight secondary structure elements, it provides a secondary structure estimation su- perior to previous algorithms. Moreover, the detailed sec- ondary structure information makes it possible to predict the protein fold down to the level of topology/homology following the CATH protein fold classification. The advan- tages of BeStSel over the existing methods are the higher ac- curacy and usability for a broader range of proteins, such as
-structure-rich proteins, membrane proteins, aggregates, amyloid fibrils. The web server provides a user-friendly and intelligent interface for the analysis of single or multiple CD spectra to gain detailed structural information. It also pro- vides the secondary structure composition of atomic resolu- tion structures deposited in the PDB for reference purposes.
The server is flexible with adjustable wavelength ranges, scaling of the spectra, and provides links to the correspond- ing PDB structures upon fold prediction. Short help mes- sages and a tutorial facilitates its use. The server is valu- able for fast and inexpensive experimental protein structure characterization in any field of protein science, structural biochemistry, biotechnology and pharmaceutical industry.
DATA AVAILABILITY
The BeStSel web server is freely accessible athttp://bestsel.
elte.hu.
SUPPLEMENTARY DATA
Supplementary Dataare available at NAR Online.
FUNDING
National Research, Development and Innovation Fund of Hungary [K 120391, KH 125597, 2017-1.2.1-NKP- 2017-00002, FIEK 16-1-2016-0005, T ´ET 16-1-2016-0134, T ´ET 16-1-2016-0197]; SOLEIL Synchrotron, France [pro- posals 20171582, 20160916, 20151300, 20150515]; Campus France [Balaton-Programme Hubert Curien, 38642YK];
Downloaded from https://academic.oup.com/nar/article-abstract/46/W1/W315/5035652 by guest on 25 September 2018
Institute for Protein Research, Osaka University [ICR-17- 02]; JSPS KAKENHI [15K18518, 25870407, 15K07038 to Y-H.L.]; Hungarian Academy of Sciences, J´anos Bolyai Scholarship (to A.M.). Funding for open access charge: Re- search Grants [K 120391, KH 125597].
Conflict of interest statement.None declared.
REFERENCES
1. Greenfield,N. and Fasman,G.D. (1969) Computed circular dichroism spectra for the evaluation of protein conformation.Biochemistry,8, 4108–4116.
2. Wallace,B.A. and Janes,R.W. (2001) Synchrotron radiation circular dichroism spectroscopy of proteins: secondary structure, fold recognition and structural genomics.Curr. Opin. Chem. Biol.,5, 567–571.
3. Bohm,G., Muhr,R. and Jaenicke,R. (1992) Quantitative analysis of protein far UV circular dichroism spectra by neural networks.Protein Eng.,5, 191–195.
4. Perez-Iratxeta,C. and Andrade-Navarro,M.A. (2008) K2D2:
estimation of protein secondary structure from circular dichroism spectra.BMC Struct. Biol.,8, 25.
5. Provencher,S.W. and Glockner,J. (1981) Estimation of globular protein secondary structure from circular dichroism.Biochemistry, 20, 33–37.
6. Sreerama,N., Venyaminov,S.Y. and Woody,R.W. (1999) Estimation of the number of alpha-helical and beta-strand segments in proteins using circular dichroism spectroscopy.Protein Sci.,8, 370–380.
7. Sreerama,N. and Woody,R.W. (2000) Estimation of protein secondary structure from circular dichroism spectra: comparison of CONTIN, SELCON, and CDSSTR methods with an expanded reference set.Anal. Biochem.,287, 252–260.
8. Whitmore,L. and Wallace,B.A. (2004) DICHROWEB, an online server for protein secondary structure analyses from circular dichroism spectroscopic data.Nucleic Acids Res.,32, W668–W673.
9. Wiedemann,C., Bellstedt,P. and Gorlach,M. (2013) CAPITO–a web server-based analysis and plotting tool for circular dichroism data.
Bioinformatics,29, 1750–1757.
10. Khrapunov,S. (2009) Circular dichroism spectroscopy has intrinsic limitations for protein secondary structure analysis.Anal. Biochem., 389, 174–176.
11. Micsonai,A., Wien,F., Kernya,L., Lee,Y.H., Goto,Y., Refregiers,M.
and Kardos,J. (2015) Accurate secondary structure prediction and fold recognition for circular dichroism spectroscopy.Proc. Natl.
Acad. Sci. U.S.A.,112, E3095–E3103.
12. Orengo,C.A., Michie,A.D., Jones,S., Jones,D.T., Swindells,M.B. and Thornton,J.M. (1997) CATH–a hierarchic classification of protein domain structures.Structure,5, 1093–1108.
13. Kabsch,W. and Sander,C. (1983) Dictionary of protein secondary structure: pattern recognition of hydrogen-bonded and geometrical features.Biopolymers,22, 2577–2637.
14. Ho,B.K. and Curmi,P.M. (2002) Twist and shear in beta-sheets and beta-ribbons.J. Mol. Biol.,317, 291–308.
15. Lees,J.G., Miles,A.J., Wien,F. and Wallace,B.A. (2006) A reference database for circular dichroism spectroscopy covering fold and secondary structure space.Bioinformatics,22, 1955–1962.
16. Sillitoe,I., Lewis,T.E., Cuff,A., Das,S., Ashford,P., Dawson,N.L., Furnham,N., Laskowski,R.A., Lee,D., Lees,J.G.et al.(2015) CATH:
comprehensive structural and functional annotations for genome sequences.Nucleic Acids Res.,43, D376–D381.
17. Dudani,S.A. (1976) The distance-weighted k-nearest-neighbor rule.
IEEE Trans. Syst. Man Cybern.,SMC-6, 325–327.
18. Saito,F., Hirayasu,K., Satoh,T., Wang,C.W., Lusingu,J., Arimori,T., Shida,K., Palacpac,N.M.Q., Itagaki,S., Iwanaga,S.et al.(2017) Immune evasion of Plasmodium falciparum by RIFIN via inhibitory receptors.Nature,552, 101–105.
19. Sen Mojumdar,S., N Scholl,Z, Dee,D.R., Rouleau,L., Anand,U., Garen,C. and Woodside,M.T. (2017) Partially native intermediates mediate misfolding of SOD1 in single-molecule folding trajectories.
Nat. Commun.,8, 1881.
20. Tayeb-Fligelman,E., Tabachnikov,O., Moshe,A.,
Goldshmidt-Tran,O., Sawaya,M.R., Coquelle,N., Colletier,J.P. and
Landau,M. (2017) The cytotoxic Staphylococcus aureus PSMalpha3 reveals a cross-alpha amyloid-like fibril.Science,355, 831–833.
21. Misra,P., Kodali,R., Chemuru,S., Kar,K. and Wetzel,R. (2016) Rapid alpha-oligomer formation mediated by the Abeta C terminus initiates an amyloid assembly pathway.Nat. Commun.,7, 12419.
22. Chan,S.W., Yau,J., Ing,C., Liu,K., Farber,P., Won,A., Bhandari,V., Kara-Yacoubian,N., Seraphim,T.V., Chakrabarti,N.et al.(2016) Mechanism of Amyloidogenesis of a Bacterial AAA+ Chaperone.
Structure,24, 1095–1109.
23. Yamaguchi,K.I., Honda,R.P., Elhelaly,A.E. and Kuwata,K. (2018) Acceleration of nucleation of prion protein during continuous ultrasonication.J. Biochem.,163, 503–513.
24. Lin,Y., Kardos,J., Imai,M., Ikenoue,T., Kinoshita,M., Sugiki,T., Ishimori,K., Goto,Y. and Lee,Y.H. (2016) Amorphous aggregation of cytochrome c with inherently low Amyloidogenicity is characterized by the Metastability of Supersaturation and the phase diagram.
Langmuir,32, 2010–2022.
25. Malmos,K.G., Bjerring,M., Jessen,C.M., Nielsen,E.H., Poulsen,E.T., Christiansen,G., Vosegaard,T., Skrydstrup,T., Enghild,J.J.,
Pedersen,J.S.et al.(2016) How Glycosaminoglycans promote fibrillation of salmon calcitonin.J. Biol. Chem.,291, 16849–16862.
26. Jayaraman,S., Gantz,D.L., Haupt,C. and Gursky,O. (2017) Serum amyloid A forms stable oligomers that disrupt vesicles at lysosomal pH and contribute to the pathogenesis of reactive amyloidosis.Proc.
Natl. Acad. Sci. U.S.A.,114, E6507–E6515.
27. Yang,G., Yu,K., Kaitatzi,C.S., Singh,A. and Labahn,J. (2017) Influence of solubilization and AD-mutations on stability and structure of human presenilins.Sci. Rep.,7, 17970.
28. Sahoo,B.R., Maruyama,K., Edula,J.R., Tougan,T., Lin,Y., Lee,Y.H., Horii,T. and Fujiwara,T. (2017) Mechanistic and structural basis of bioengineered bovine Cathelicidin-5 with optimized therapeutic activity.Sci. Rep.,7, 44781.
29. Terakawa,M.S., Lee,Y.H., Kinoshita,M., Lin,Y., Sugiki,T., Fukui,N., Ikenoue,T., Kawata,Y. and Goto,Y. (2018) Membrane-induced initial structure of alpha-synuclein control its amyloidogenesis on model membranes.Biochim. Biophys. Acta,1860, 757–766.
30. Rouse,S.L., Hawthorne,W.J., Berry,J.L., Chorev,D.S., Ionescu,S.A., Lambert,S., Stylianou,F., Ewert,W., Mackie,U., Morgan,R.M.L.
et al.(2017) A new class of hybrid secretion system is employed in Pseudomonas amyloid biogenesis.Nat. Commun.,8, 263.
31. Brodie,N.I., Popov,K.I., Petrotchenko,E.V., Dokholyan,N.V. and Borchers,C.H. (2017) Solving protein structures using short-distance cross-linking constraints as a guide for discrete molecular dynamics simulations.Sci. Adv.,3, e1700479.
32. Nyiri,K., Kohegyi,B., Micsonai,A., Kardos,J. and Vertessy,B.G.
(2015) Evidence-Based structural model of the staphylococcal repressor protein: separation of functions into different domains.
PLoS One,10, e0139086.
33. Sajo,R., Toke,O., Hajdu,I., Jankovics,H., Micsonai,A., Dobo,J., Kardos,J. and Vonderviszt,F. (2016) Structural plasticity of the Salmonella FliS flagellar export chaperone.FEBS Lett.,590, 1103–1113.
34. Bizouarn,T., Karimi,G., Masoud,R., Souabni,H., Machillot,P., Serfaty,X., Wien,F., Refregiers,M., Houee-Levin,C. and Baciou,L.
(2016) Exploring the arachidonic acid-induced structural changes in phagocyte NADPH oxidase p47(phox) and p67(phox) via thiol accessibility and SRCD spectroscopy.FEBS J.,283, 2896–2910.
35. Hussain,R., Hughes,C.S., Javorfi,T., Siligardi,G., Williams,P. and Bonev,B.B. (2018) To Boil an Egg: Substrate binding affects critical stability in thermal unfolding of proteins.J. Phys. Chem. B,122, 2213–2218.
36. Nasser,S., Hedoux,A., Giuliani,A., Le Floch-Fouere,C., Sante-Lhoutellier,V., de Waele,I. and Delaplace,G. (2017) Investigation of secondary structure evolution of micellar casein powder upon aging by FTIR and SRCD: consequences on solubility.
J. Sci. Food Agric.,98, 2243–2250.
37. Nemeth,E., Balogh,R.K., Borsos,K., Czene,A., Thulstrup,P.W. and Gyurcsik,B. (2016) Intrinsic protein disorder could be overlooked in cocrystallization conditions: an SRCD case study.Protein Sci.,25, 1977–1988.
38. Souabni,H., Wien,F., Bizouarn,T., Houee-Levin,C., Refregiers,M.
and Baciou,L. (2017) The physicochemical properties of membranes correlate with the NADPH oxidase activity.Biochim. Biophys. Acta, 1861, 3520–3530.
Downloaded from https://academic.oup.com/nar/article-abstract/46/W1/W315/5035652 by guest on 25 September 2018
Downloaded from https://academic.oup.com/nar/article-abstract/46/W1/W315/5035652 by guest on 25 September 2018