Protein Biotechnology
. Tamás Emri . Éva Csősz . József Tőzsér Edited by . József Tőzsér
, University of Debrecen
Protein Biotechnology
by . Tamás Emri, . Éva Csősz, . József Tőzsér, . József Tőzsér, and
Copyright © 2011 The project is funded by the European Union and co-financed by the European Social Fund., Manuscript completed: 17 November 2011
“Manifestation of Novel Social Challenges of the European Union in the Teaching Material of Medical Biotechnology Master’s Programmes at the University of Pécs and at the University of Debrecen” Identification number: TÁMOP-4.1.2-08/1/A-2009-0011
Table of Contents
Index ... 1
1. 1. Biochemical characteristics of proteins. Protein synthesis. The overview of the differences between the eukaryotic and prokaryotic protein synthesis ... 5
1. ... 5
2. 2. Protein folding, 3D structure formation. Chaperons. Folding problems, folding diseases. ... 17
1. ... 17
3. 3. Protein sorting and targeting ... 34
1. ... 34
4. 4. The examination of protein structure: X-ray crystallography, NMR, mass spectrometry ... 41
1. ... 41
5. 5. Protein purification (chromatographic techniques) and analysis (SDS-PAGE, 2DE, mass spectrometry). ... 50
1. ... 50
6. 6. The posttranslational modification of proteins and their analysis using proteomics methods .. 60
1. ... 60
7. 7. The study of protein-protein interactions ... 66
1. ... 66
8. 8. Heterologous expression I ... 75
1. ... 75
9. 9. Heterologous expression II ... 79
1. ... 79
10. 10. Heterologous expression III ... 84
1. ... 84
11. 11. Protein engineering ... 90
1. ... 90
12. 12. Production of human therapeutic proteins ... 97
1. ... 97
13. 13. Production of human therapeutic enzymes ... 104
1. ... 104
14. 14. Production of diagnostic enzymes ... 108
1. ... 108
15. 15. The application of therapeutic proteins. Possible administration, perspectives and future possibilities. The national and international requirements for protein therapeutic products ... 115
1. ... 115
List of Figures
1.1. Figure 1.1. The twenty protein-constituent amino acids. ... 5
1.2. Figure 1.2. The structure of globular proteins. ... 6
1.3. Figure 1.3. Classification of detergents according to their charge. ... 6
1.4. Figure 1.4. The effect of detergents on protein structure. ... 7
1.5. Figure 1.5. The effect of reducing agents on protein structure. ... 7
1.6. Figure 1.6. The structure of tRNA. ... 8
1.7. Figure 1.7. The activation of amino acids. ... 9
1.8. Figure 1.8. The structure of prokaryotic and eukaryotic mRNA. ... 9
1.9. Figure 1.9. The differences between the prokaryotic and eukaryoitic mRNA. ... 10
1.10. Figure 1.10. The structure of ribosomes. ... 11
1.11. Figure 1.11. The structure of the active ribosome. ... 11
1.12. Figure 1.12. The initiation of protein synthesis in prokaryotes. ... 11
1.13. Figure 1.13. The initiation of protein synthesis in eukaryotes. ... 12
1.14. Figure 1.14. The initiation ends with the formation of 70S/80S ribosome compex. ... 12
1.15. Figure 1.15. The second step of protein synthesis: the elongation. ... 13
1.16. Figure 1.16. The major features of elongation. ... 14
1.17. Figure 1.17. The third step of protein synthesis: the termination. ... 14
1.18. Figure 1.18. The localization of protein synthesis in eukaryotes. ... 15
1.19. Figure 1.19. The localization of protein synthesis in prokaryotes. ... 15
2.1. Figure 2.1. The most abundant bonds in the living system: hydrogen bonds. ... 17
2.2. Figure 2.2. The most abundant bonds in the living system: electrostatic interactions. ... 17
2.3. Figure 2.3. The most abundant bonds in the living system: hydrophobic interactions. ... 18
2.4. Figure 2.4. The polar water molecules stabilize the structures in the living systems. ... 18
2.5. Figure 2.5. The protein folding. ... 19
2.6. Figure 2.6. The structure of proteins. ... 20
2.7. Figure 2.7. The primary structure of proteins: the amino acid sequence. ... 20
2.8. Figure 2.8. The peptide bond. ... 20
2.9. Figure 2.9. The structure of alfa helix. ... 21
2.10. Figure 2.10. The structure of beta sheet and beta. ... 21
2.11. Figure 2.11. The prediction of protein structure based on the position of hydrophobic amino acids. 22 2.12. Figure 2.12. The tertiary structure of the proteins is made up of secondary structure elements. 22 2.13. Figure 2.13. The Anfinsen experiment. ... 23
2.14. Figure 2.14. The folding of proteins through metastabile intermediates. ... 24
2.15. Figure 2.15. The structure of intrinsically disordered proteins. ... 24
2.16. Figure 2.16. The intrinsically disordered proteins can adopt alpha helix or beta sheet structure upon interacting with other proteins. ... 25
2.17. Figure 2.17. The crystal structure of the GroEL chaperon (pdb code: 2NWC). ... 25
2.18. Figure 2.18. The function of chaperons. ... 26
2.19. Figure 2.19. The role of chaperons in the formation and maintenance of the protein 3D structure. 26 2.20. Figure 2.20. Classification of chaperons according to their structure. ... 27
2.21. Figure 2.21. The function of Hsp60. ... 27
2.22. Figure 2.22. The function of Hsp70. ... 28
2.23. Figure 2.23. The function of Hsp90. ... 28
2.24. Figure 2.24. The function of Hsp110. ... 29
2.25. Figure 2.25. The function of calnexin and calreticulin. ... 29
2.26. Figure 2.26. The function of protein disulfid isomerase (PDI). ... 30
2.27. Figure 2.27. The function of peptidil-prolyl isomerase. ... 30
2.28. Figure 2.28. In the course of the folding process proteins with abnormal structure can be formed as well. ... 31
2.29. Figure 2.29. The number of “bad” prions increase upon coming in contact with native, endogenious forms. ... 32
2.30. Figure 2.30. The probable mechanism of amyloid plaque formation. ... 32
3.1. Figure 3.1. Protein targeting to endoplasmic reticulum (ER) I. ... 34
3.2. Figure 3.2. Protein targeting to endoplasmic reticulum (ER) II. ... 34
Protein Biotechnology
3.3. Figure 3.3. Protein targeting to endoplasmic reticulum (ER) III. ... 35
3.4. Figure 3.4. Protein targeting to endoplasmic reticulum (ER) and their cotranslational modification. 35 3.5. Figure 3.5. The cotranlational N-glycosidation of proteins in the endoplasmic reticulum. ... 36
3.6. Figure 3.6. The mechanism of N-glycosidation, the formation of oligosaccharide chain on dolichol phosphate. ... 36
3.7. Figure 3.7. Quallity control in the endoplasmic reticulum (ERAD). ... 37
3.8. Figure 3.8. The route of proteins among different compartments. ... 38
3.9. Figure 3.9. The modification of proteins in the Golgi compartments. ... 38
3.10. Figure 3.10. In Golgi apparatus different N-glycosilated proteins are formed with various sugar composition. ... 39
3.11. Figure 3.11. Protein targeting to the mitochondrium. ... 39
3.12. Figure 3.12. Protein targeting to the nucleus. ... 40
4.1. Figure 4.1.The relation between protein structure and the presence of intrinsic disorder. ... 41
4.2. Figure 4.2. Determination of protein structure with X-ray crystallography I. ... 41
4.3. Figure 4.3. Determination of protein structure with X-ray crystallography II. ... 42
4.4. Figure 4.4. The quality of amino acid residue fitting in the electron density map determines the quality of the crystal structure. ... 42
4.5. Figure 4.5. Determination of protein structure with nuclear magnetic resonance (NMR). ... 43
4.6. Figure 4.6. Protein Data Bank (PDB) – the repository of determined protein structures. ... 44
4.7. Figure 4.7. The structure of a mass spectrometer. ... 44
4.8. Figure 4.8. The theory of MALDI – Matrix Assisted Laser Desorption Ionization. ... 45
4.9. Figure 4.9. The principle of electro spray ionisation (ESI). ... 45
4.10. Figure 4.10. The ion path in the Time-Of-Flight (TOF) mass analyzer. ... 46
4.11. Figure 4.11. Improvement of mass resolution of mass spectrometers by the administration of a reflectron. ... 46
4.12. Figure 4.12. The ion path in the quadrupole. ... 47
4.13. Figure 4.13. The ion path in the ion trap. ... 47
4.14. Figure 4.14. The electrospray ionization tandem MS (ESI MS.MS) is suitable for amino acid sequence determination. ... 48
4.15. Figure 4.15. The ion path in the high definition mass spectrometers. ... 48
5.1. Figure 5.1. Points to be considered in choosing the optimal protein purification procedure. .... 50
5.2. Figure 5.2. Purification of proteins using affinity chromatography. ... 51
5.3. Figure 5.3. Separation of proteins with analytical gel filtration. ... 51
5.4. Figure 5.4. Desalting of proteins with dialysis. ... 52
5.5. Figure 5.5. SDS-polyacrilamide gel electrophoresis (PAGE) – separation of proteins according to their size. ... 52
5.6. Figure 5.6. Isoelectric focusing of proteins on a pH 3-10 focusing strip. ... 53
5.7. Figure 5.7. Two dimensional electrophoresis. ... 53
5.8. Figure 5.8. The visualization of proteins with different staining methods. ... 54
5.9. Figure 5.9. Immunoprecipitation of proteins. ... 54
5.10. Figure 5.10. Protein analysis with Western blot. ... 55
5.11. Figure 5.11. The proteomics workflow. ... 55
5.12. Figure 5.12. The analysis of quantitative and qualitative differences of protein expression using two dimensional gel electrophoresis (2DE). ... 56
5.13. Figure 5.13. The analysis of quantitative and qualitative differences using difference gel electrophoresis (DIGE). ... 57
5.14. Figure 5.14. Metabolic labeling with SILAC – stable isotop labeling with amino acids in cell culture. ... 57
5.15. Figure 5.15. The structure of the iTRAQ label. ... 58
5.16. Figure 5.16. Chemical labeling with iTRAQ (iTRAQ - isobaric tag for relative and absolute quantitation) technique. ... 58
5.17. Figure 5.17. Detection of specific proteins using multiple reaction monitoring (MRM). ... 59
6.1. Figure 6.1. Glycation. ... 60
6.2. Figure 6.2. The modification of proteins by phosphorylation and dephosphorylation. ... 60
6.3. Figure 6.3. The modification of proteins by prenylation. ... 61
6.4. Figure 6.4. The modification of proteins by fatty acid modifications ... 61
Protein Biotechnology
6.8. Figure 6.8. Formation of isopeptide bonds in the transglutaminase catalyzed reaction. ... 63
6.9. Figure 6.9. Specific staining procedures used for the detection of posttranslational modifications. 64 6.10. Figure 6.10. The fate of phosphate groups of proteins in the course of mass spectrometry analysis. 65 6.11. Figure 6.11. The study of posttranslational modifications using precursor ion scan. ... 65
6.12. Figure 6.12. The study of posttranslational modifications using neutral loss scan. ... 65
6.13. Figure 6.13. The study of posttranslational modifications using multiple reaction monitoring (MRM). ... 65
7.1. Figure 7.1. Protein interaction map. ... 66
7.2. Figure 7.2. Study of protein-protein interactions with co-immunoprecipitation. ... 67
7.3. Figure 7.3. Study of protein-protein interactions with pull-down technique. ... 68
7.4. Figure 7.4. Study of protein-protein interactions with far-Western technique. ... 68
7.5. Figure 7.5. Chemical structure of dithiobis-sulfosuccinimidyl-propionate. ... 69
7.6. Figure 7.6. Chemical structure of bis-sulfosuccinimidyl-suberate. ... 69
7.7. Figure 7.7. The study of protein-protein interactions with photoactive crosslinking agents. .... 69
7.8. Figure 7.8. The study of protein-protein interactions with yeast two hybrid system. ... 70
7.9. Figure 7.9. Study of protein-protein interactions using protein chips. ... 71
7.10. Figure 7.10. Study of protein-protein interactions of immobilized proteins on the surface of the protein chip using SELDI technique. ... 71
7.11. Figure 7.11. The phage display technology. ... 72
7.12. Figure 7.12. The study of protein-protein interactions with FRET. ... 73
7.13. Figure 7.13. Study of protein-protein interactions with surface plasmone resonance. ... 73
7.14. Figure 7.14. Study of protein-protein interactions with Biacore based on surface plasmone resonance. ... 73
8.1. Figure 8.1. Common structure of expression vectors ... 75
8.2. Figure 8.2. The role of RNA I and RNA II in the replication of plasmids ... 77
8.3. Figure 8.3. Integration based on levan sucrase selection. ... 77
9.1. Figure 9.1. Comparison of the Sec and the Tat secretory pathways. Sec-pathway: folding after translocation. Tat-pathway: folding before translocation ... 79
9.2. Figure 9.2. Mechanism of the Sec-pathway. ... 79
9.3. Figure 9.3. Structure of the S. carnosus expression cassette. ... 80
9.4. Figure 9.4. Representative N-glycoside oligosaccharides of Saccharomyces cerevisiae and Pichia pastoris. ... 81
9.5. Figure 9.5. Artificial chromosomes – the alternatives of integration. ... 81
10.1. Figure 10.1. Position-mediated expression enhancement – functionalized cells. ... 85
10.2. Figure 10.2. Representative plant N-glycoside oligosaccharides. ... 85
10.3. Figure 10.3. Parts of Agrobacterium tumefaciens Ti plasmid. ... 86
10.4. Figure 10.4. Transformation with Agrobacterium tumefaciens. ... 87
10.5. Figure 10.5. Representative insect N-glycoside oligosaccharides. ... 87
10.6. Figure 10.6. Integration of expression cassette into the bacmid. ... 88
11.1. Figure 11.1. Impact of de novo protein design. ... 90
11.2. Figure 11.2. Structure of a protein developed by de novo protein design. ... 90
11.3. Figure 11.3. Receptor tyrosine kinase (RTK) – mechanism of action. ... 91
11.4. Figure 11.4. Synthetic growth factors. ... 91
11.5. Figure 11.5. Development of receptor-specific peptide hormones. ... 92
11.6. Figure 11.6. PCR based site directed mutagenesis. ... 93
11.7. Figure 11.7. Directed evolution. ... 93
11.8. Figure 11.8. DNA Shuffling 1. ... 94
11.9. Figure 11.9. DNA Shuffling 2. ... 94
11.10. Figure 11.10. Staggered extension process (StEP). ... 95
11.11. Figure 11.11. Exon shuffling. ... 95
12.1. Figure 12.1. Insulin. ... 98
12.2. Figure 12.2. Pharmacokinetic properties of different insulin variants. ... 99
12.3. Figure 12.3. The hepatitis B virus. ... 100
12.4. Figure 12.4. Simplified life cycle of Hepatitis B virus. ... 100
12.5. Figure 12.5. Geographic distribution of hepatitis B genotypes. ... 101
12.6. Figure 12.6. The expression vector of Hansenula polymorpha. ... 102
13.1. Figure 13.1. Urate oxidase (uricase or urate oxygen oxidoreductase). ... 104
13.2. Figure 13.2. Human α-galactosidase. ... 105
Protein Biotechnology
13.3. Figure 13.3. Human glucocerebrosidase. ... 105
14.1. Figure 14.1. Reaction catalyzed by GOX (glucose oxidase). ... 108
14.2. Figure 14.2. GOX – mechanism of action. ... 108
14.3. Figure 14.3. GOX is produced by batch, fed-batch fermentation in submerged cultures. ... 109
14.4. Figure 14.4. Reaction catalyzed by GAOX (galactose oxidase). ... 110
14.5. Figure 14.5. GAOX – mechanism of action. ... 110
14.6. Figure 14.6. Reactions catalyzed by ChOX (cholesterol oxidase). ... 111
14.7. Figure 14.7. Reaction catalyzed by HrP (horseradish peroxidase). ... 112
14.8. Figure 14.8. Application of HrP in immunoassays. ... 113
14.9. Figure 14.9. Biosensors based on HrP. ... 113
15.1. Figure 15.1. Gene therapy versus protein therapy. ... 115
15.2. Figure 15.2. The mechanism of ADCC. (ADCC – antibody dependent cell mediated cytotoxicity). 117 15.3. Figure 15.3. Administration of antibodies against Her2 in breast cancer. ... 117
15.4. Figure 15.4. Administration of protein therapeutics with TNF alfa inhibitor effect in order to suppress the immune system. ... 118
Index
List of figures
• Figure 1.1. The twenty protein-constituent amino acids
• Figure 1.2. The structure of globular proteins
• Figure 1.3. Classification of detergents according to their charge
• Figure 1.4. The effect of detergents on protein structure
• Figure 1.5. The effect of reducing agents on protein structure
• Figure 1.6. The structure of tRNA
• Figure 1.7. The activation of amino acids
• Figure 1.8. The structure of prokaryotic and eukaryotic mRNA
• Figure 1.9. The differences between the prokaryotic and eukaryoitic mRNA
• Figure 1.10. The structure of ribosomes
• Figure 1.11. The structure of the active ribosome
• Figure 1.12. The initiation of protein synthesis in prokaryotes
• Figure 1.13. The initiation of protein synthesis in eukaryotes
• Figure 1.14. The initiation ends with the formation of 70S/80S ribosome compex
• Figure 1.15. The second step of protein synthesis:
the elongation
• Figure 1.16. The major features of elongation
• Figure 1.17. The third step of protein synthesis: the termination
• Figure 1.18. The localization of protein synthesis in eukaryotes
• Figure 1.19. The localization of protein synthesis in prokaryotes
• Figure 2.1. The most abundant bonds in the living system: hydrogen bonds
• Figure 2.3. The most abundant bonds in the living system: hydrophobic interactions
• Figure 2.4. The polar water molecules stabilize the structures in the living systems
• Figure 2.5. The protein folding
• Figure 2.6. The structure of proteins
• Figure 2.7. The primary structure of proteins: the amino acid sequence
• Figure 2.8. The peptide bond
• Figure 2.9. The structure of alfa helix
• Figure 2.10. The structure of beta sheet and beta
• Figure 2.11. The prediction of protein structure based on the position of hydrophobic amino acids
• Figure 2.12. The tertiary structure of the proteins is made up of secondary structure elements
• Figure 2.13. The Anfinsen experiment
• Figure 2.14. The folding of proteins through metastabile intermediates
• Figure 2.15. The structure of intrinsically disordered proteins
• Figure 2.16. The intrinsically disordered proteins can adopt alpha helix or beta sheet structure upon interacting with other proteins
• Figure 2.17. The crystal structure of the GroEL chaperon (pdb code: 2NWC)
• Figure 2.18. The function of chaperons
• Figure 2.19. The role of chaperons in the formation and maintenance of the protein 3D structure
• Figure 2.20. Classification of chaperons according to their structure
• Figure 2.21. The function of Hsp60
• Figure 2.22. The function of Hsp70
• Figure 2.23. The function of Hsp90
• Figure 2.24. The function of Hsp110
• Figure 2.25. The function of calnexin and calreticulin
• Figure 2.26. The function of protein disulfid
Index
• Figure 2.27. The function of peptidil-prolyl isomerase
• Figure 2.28. In the course of the folding process proteins with abnormal structure can be formed as well
• Figure 2.29. The number of “bad” prions increase upon coming in contact with native, endogenious forms
• Figure 2.30. The probable mechanism of amyloid plaque formation
• Figure 3.1. Protein targeting to endoplasmic reticulum (ER) I.
• Figure 3.2. Protein targeting to endoplasmic reticulum (ER) II.
• Figure 3.3. Protein targeting to endoplasmic reticulum (ER) III.
• Figure 3.4. Protein targeting to endoplasmic reticulum (ER) and their cotranslational modification
• Figure 3.5. The cotranlational N-glycosidation of proteins in the endoplasmic reticulum
• Figure 3.6. The mechanism of N-glycosidation, the formation of oligosaccharide chain on dolichol phosphate
• Figure 3.7. Quallity control in the endoplasmic reticulum (ERAD)
• Figure 3.8. The route of proteins among different compartments
• Figure 3.9. The modification of proteins in the Golgi compartments
• Figure 3.10. In Golgi apparatus different N- glycosilated proteins are formed with various sugar composition
• Figure 3.11. Protein targeting to the mitochondrium
• Figure 3.12. Protein targeting to the nucleus
• Figure 4.1. The relation between protein structure and the presence of intrinsic disorder
• Figure 4.2. Determination of protein structure with X-ray crystallography I.
• Figure 4.3. Determination of protein structure with X-ray crystallography II.
• Figure 4.4. The quality of amino acid residue fitting in the electron density map determines the quality of the crystal structure
• Figure 4.5. Determination of protein structure with nuclear magnetic resonance (NMR)
• Figure 4.6. Protein Data Bank (PDB) – the repository of determined protein structures
• Figure 4.7. The structure of a mass spectrometer
• Figure 4.8. The theory of MALDI – Matrix Assisted Laser Desorption Ionization
• Figure 4.9. The principle of electro spray ionisation (ESI)
• Figure 410. The ion path in the Time-Of-Flight (TOF) mass analyzer
• Figure 4.11. Improvement of mass resolution of mass spectrometers by the administration of a reflectron
• Figure 4.12. The ion path in the quadrupole
• Figure 4.13. The ion path in the ion trap
• Figure 4.14. The electrospray ionization tandem MS (ESI MS/MS) is suitable for amino acid sequence determination
• Figure 4.15. The ion path in the high definition mass spectrometers
• Figure 5.1. Points to be considered in choosing the optimal protein purification procedure
• Figure 5.2. Purification of proteins using affinity chromatography
• Figure 5.3. Separation of proteins with analytical gelfiltration
• Figure 5.4. Desalting of proteins with dialysis
• Figure 5.5. SDS-polyacrilamide gel electrophoresis (PAGE) – separation of proteins according to their size
• Figure 5.6. Isoelectric focusing of proteins on a pH 3-10 focusing strip
• Figure 5.7. Two dimensional electrophoresis
• Figure 5.8. The visualization of proteins with different staining methods
• Figure 5.9. Immunoprecipitation of proteins
• Figure 5.10. Protein analysis with Western blot
• Figure 5.11. The proteomics workflow
Index
• Figure 5.12. The analysis of quantitative and qualitative differences of protein expression using two dimensional gel electrophoresis (2DE)
• Figure 5.13. The analysis of quantitative and qualitative differences using difference gel electrophoresis (DIGE)
• Figure 5.14. Metabolic labeling with SILAC – stable isotop labeling with amino acids in cell culture
• Figure 5.15. The structure of the iTRAQ label
• Figure 5.16. Chemical labeling with iTRAQ (iTRAQ - isobaric tag for relative and absolute quantitation) technique
• Figure 5.17. Detection of specific proteins using multiple reaction monitoring (MRM)
• Figure 6.1. Glycation
• Figure 6.2. The modification of proteins by phosphorylation and dephosphorylation
• Figure 6.3. The modification of proteins by prenylation
• Figure 6.4. The modification of proteins by fatty acid modifications
• Figure 6.5. The modification of proteins by proteolysis
• Figure 6.6. The site of proteolytic cleavage
• Figure 6.7. The effect of posttranslational modifications on gene transcription
• Figure 6.8. Formation of isopeptide bonds in the transglutaminase catalyzed reaction
• Figure 6.9. Specific staining procedures used for the detection of posttranslational modifications
• Figure 6.10. The fate of phosphate groups of proteins in the course of mass spectrometry analysis
• Figure 6.11. The study of posttranslational modifications using precursor ion scan
• Figure 6.12. The study of posttranslational modifications using neutral loss scan
• Figure 6.13. The study of posttranslational modifications using multiple reaction monitoring (MRM)
• Figure 7.1. Protein interaction map
• Figure 7.3. Study of protein-protein interactions with pull-down technique
• Figure 7.4. Study of protein-protein interactions with far-Western technique
• Figure 7.5. Chemical structure of dithiobis- sulfosuccinimidyl-propionate
• Figure 7.6. Chemical structure of bis- sulfosuccinimidyl-suberate
• Figure 7.7. The study of protein-protein interactions with photoactive crosslinking agents
• Figure 7.8. The study of protein-protein interactions with yeast two hybrid system
• Figure 7.9. Study of protein-protein interactions using protein chips
• Figure 7.10. Study of protein-protein interactions of immobilized proteins on the surface of the protein chip using SELDI technique
• Figure 7.11. The phage display technology
• Figure 7.12. The study of protein-protein interactions with FRET
• Figure 7.13. Study of protein-protein interactions with surface plasmone resonance
• Figure 7.14. Study of protein-protein interactions with Biacore based on surface plasmone resonance
• Figure 8.1. Common structure of expression vectors
• Figure 8.2. The role of RNA I and RNA II in the replication of plasmids
• Figure 8.3. Integration based on levan sucrase selection
• Figure 9.1. Comparison of the Sec and the Tat secretory pathways. Sec-pathway: folding after translocation. Tat-pathway: folding before translocation
• Figure 9.2. Mechanism of the Sec-pathway
• Figure 9.3. Structure of the S. carnosus expression cassette
• Figure 9.4. Representative N-glycoside oligosaccharides of Saccharomyces cerevisiae and Pichia pastoris
• Figure 9.5. Artificial chromosomes – the alternatives of integration
Index
• Figure 10.2. Representative plant N-glycoside oligosaccharides
• Figure 10.3. Parts of Agrobacterium tumefaciens Ti plasmid
• Figure 10.4. Transformation with Agrobacterium tumefaciens
• Figure 10.5. Representative insect N-glycoside oligosaccharides
• Figure 10.6. Integration of expression cassette into the bacmid
• Figure 11.1. Impact of de novo protein design
• Figure 11.2. Structure of a protein developed by de novo protein design
• Figure 11.3. Receptor tyrosine kinase (RTK) – mechanism of action
• Figure 11.4. Synthetic growth factors
• Figure 11.5. Development of receptor-specific peptide hormones
• Figure 11.6. PCR based site directed mutagenesis
• Figure 11.7. Directed evolution
• Figure 11.8. DNA Shuffling 1.
• Figure 11.9. DNA Shuffling 2.
• Figure 11.10. Staggered extension process (StEP)
• Figure 11.11. Exon shuffling
• Figure 12.1. Insulin
• Figure 12.2. Pharmacokinetic properties of different insulin variants
• Figure 12.3. The hepatitis B virus
• Figure 12.4. Simplified life cycle of Hepatitis B virus
• Figure 12.5. Geographic distribution of hepatitis B genotypes
• Figure 12.6. The expression vector of Hansenula polymorpha
• Figure 13.1. Urate oxidase (uricase or urate oxygen oxidoreductase)
• Figure 13.2. Human α-galactosidase
• Figure 13.3. Human glucocerebrosidase
• Figure 14.1. Reaction catalyzed by GOX (glucose oxidase)
• Figure 14.2. GOX – mechanism of action
• Figure 14.3. GOX is produced by batch, fed-batch fermentation in submerged cultures
• Figure 14.4. Reaction catalyzed by GAOX (galactose oxidase)
• Figure 14.5. GAOX – mechanism of action
• Figure 14.6. Reactions catalyzed by ChOX (cholesterol oxidase)
• Figure 14.7. Reaction catalyzed by HrP (horseradish peroxidase)
• Figure 14.8. Application of HrP in immunoassays
• Figure 14.9. Biosensors based on HrP
• Figure 15.1. Gene therapy versus protein therapy
• Figure 15.2. The mechanism of ADCC. (ADCC – antibody dependent cell mediated cytotoxicity)
• Figure 15.3. Administration of antibodies against Her2 in breast cancer
• Figure 15.4. Administration of protein therapeutics with TNF alfa inhibitor effect in order to suppress the immune system
Chapter 1. 1. Biochemical
characteristics of proteins. Protein synthesis. The overview of the
differences between the eukaryotic and prokaryotic protein synthesis
1.
Proteins in living organisms have different roles. They can be catalysts (enzymes), they can participate in the intracellular or intercellular transport of different molecules (e.g., dynein, kinesin, transferrin), they can have storage function (e.g., ferritin) or they can have mechanical strengthening roles (e.g., collagen). The movement of cells and their communication, the generation and transmission of nerve impulses, the cell growth and differentiation are processes implemented and controlled by proteins. The defense of the organism against the intruder pathogens is done by means of proteins (antibodies). The highly regulated and harmonized function of proteins helped our ancestors to escape from the predators.
The structure of proteins
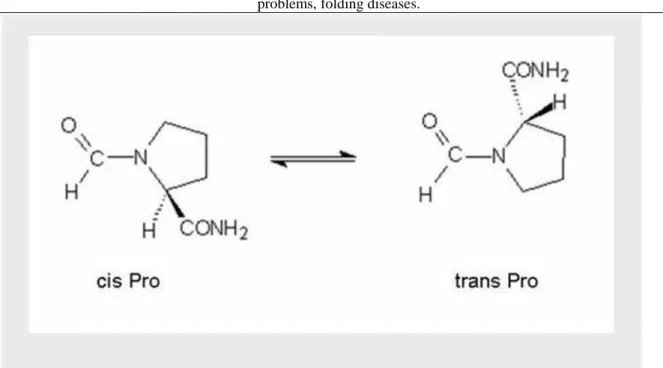
Proteins are made up of different combinations of 20 amino acids. The amino acids can have L or D configuration but the protein forming amino acids usually have L configuration. In the proteins the amino acids bind to each other via peptide bond which is a planar structure. The peptide bond can have cis or trans conformation. The trans form is more favorable energetically, so its abundance is higher but in the case of proline, the abundance of cis form is considerably higher than in case of any other amino acid. Based on their chemical properties the amino acids can have a hydrophobic or hydrophilic character, they can be aliphatic, aromatic, positively or negatively charged, polar or apolar molecules (Figure 1.1.).
Figure 1.1. Figure 1.1. The twenty protein-constituent amino acids.
1. Biochemical characteristics of proteins. Protein synthesis. The overview of the differences between
the eukaryotic and prokaryotic protein synthesis
The chemical character of the amino acids can have a role in the course of the folding, as in the hydrophilic environment characteristic of living systems, the hydrophobic amino acids tend to be buried in the protein core, while the hydrophilic ones are exposed on the protein surface at solvent accessible areas (Figure 1.2.).
Figure 1.2. Figure 1.2. The structure of globular proteins.
The proteins can fulfill their roles only if they are solubilized. Protein solubility is determined by the amino acid composition and the physical and chemical parameters of hydrophilic systems.
1. pH – the protein solubility is the lowest around their isoelectric point (pI);
2. Ionic strength – high ionic strength decreases protein solubility
3. Amino acid composition – proteins containing more hydrophobic amino acids have lower solubility in aqueous systems
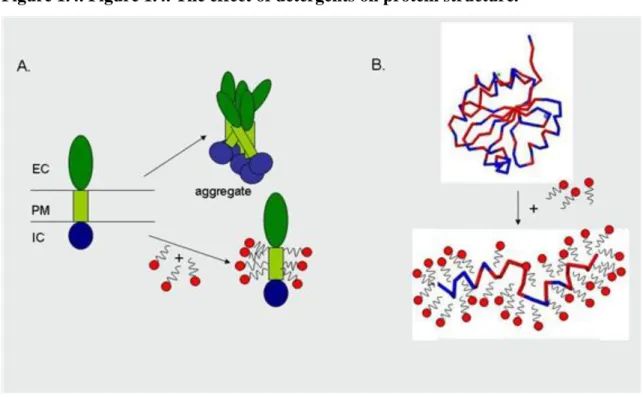
4. The presence of detergents (Figure 1.3.) and reducing agents increases protein solubility.
Figure 1.3. Figure 1.3. Classification of detergents according to their charge.
1. Biochemical characteristics of proteins. Protein synthesis. The overview of the differences between
the eukaryotic and prokaryotic protein synthesis
Detergents can lead to structural changes, the proteins lose their three dimensional structure required for their proper functioning and are denatured (Figure 1.4.) but, at the same time, the detergents prevent the aggregation of isolated membrane proteins. Reducing agents reduce the S-S bonds in proteins leading to their denaturation (Figure 1.5.).
Figure 1.4. Figure 1.4. The effect of detergents on protein structure.
Figure 1.5. Figure 1.5. The effect of reducing agents on protein structure.
1. Biochemical characteristics of proteins. Protein synthesis. The overview of the differences between
the eukaryotic and prokaryotic protein synthesis
Protein synthesis
Protein synthesis is a process in the course of which ribosomes attach the amino acids to each other building up a polypeptide chain based on the information coded in the genome and transcribed to mRNA. Amino acids, tRNA and mRNA molecules, genetic code and ribosomes are needed for protein synthesis. The base-sequence of the DNA is translated into amino acid-sequence of the protein with the help of the genetic code. Genetic code is composed of the 64 possible triplet combinations of the four base types, also called codons, each of them encoding a well-defined amino acid. Transfer RNA (tRNA) is a shamrock or a converted L shaped molecule (Figure 1.6.), which transfers the proper amino acid from the cytosol to the place of protein synthesis. All the 61 tRNA molecules possess an amino acid attachment site and an anticodon arm (Figure 1.6.), which specifically recognizes the appropriate codons of the mRNA.
Figure 1.6. Figure 1.6. The structure of tRNA.
1. Biochemical characteristics of proteins. Protein synthesis. The overview of the differences between
the eukaryotic and prokaryotic protein synthesis
The formation of the aminoacyl-tRNA has two steps. At first amino acids have to be activated then the proper tRNA has to be charged by this activated molecule. Both reactions are catalyzed by amino acid tRNA synthase enzyme (Figure 1.7.).
Figure 1.7. Figure 1.7. The activation of amino acids.
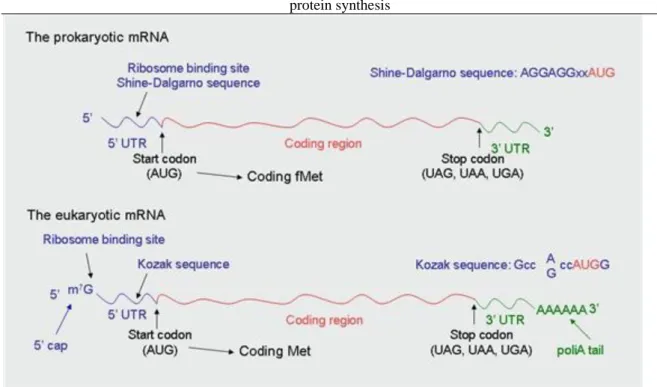
The mRNA structure of prokaryotes and eukaryotes is different: the eukaryotic mRNA possess 5’ cap structure and 3’-poly(A) tail, unlike the prokaryotic mRNA. In prokaryotes, the localization of the ribosome is facilitated by Shine-Dalgarno sequence located in the 5’ UTR (untranslated region); while in eukaryotes this is the duty of Kozak sequence in a similar region (Figure 1.8.). Prokaryotic mRNA is polycistronic – a single mRNA responsible for coding several proteins – while eukaryotic mRNA is monocistronic. Start codon encodes fMet and is preceded by the Shine-Dalgarno sequence in prokaryotes. In eukaryotes the start codon is the first AUG following the 5’ cap and encodes Met; inner AUG cannot be initiation site, as it always encodes Met (Figure 1.9.).
Figure 1.8. Figure 1.8. The structure of prokaryotic and eukaryotic mRNA.
1. Biochemical characteristics of proteins. Protein synthesis. The overview of the differences between
the eukaryotic and prokaryotic protein synthesis
Figure 1.9. Figure 1.9. The differences between the prokaryotic and eukaryoitic mRNA.
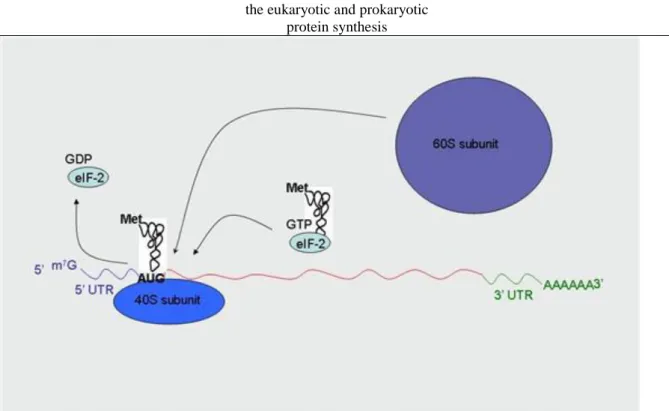
Ribosomes are made up of small and large subunits composed of numerous rRNA and protein molecules (Figure 1.10.). Different sites can be formed in the functional ribosome (Figure 1.11.), which provide binding surface for the participants of the protein synthesis and ensures fine tuning of aminoacyl-tRNA entrance (A site); peptide bound formation (P site) and empty tRNA exit (E site). In the course of the initiation of protein synthesis in prokaryotes the fMet-tRNA connects to the small subunit assisted by initiation factor-2 (IF-2), then the small subunit recognizes the Shine-Dalgarno sequence (AGGAGG) in mRNA since its 16S RNA contains anti-Shine-Dalgarno sequence (UCCUCC). The attachment of the complementary sequences results in the proper positioning of the small subunit to the start (AUG) codon (Figure I-12). In the eukaryotes the initiation of the protein synthesis is similar: Met-tRNA binds to the small subunit with the help of eukaryotic initiation factor-2 (eIF-2). The small subunit recognizes the first AUG codon following 5’ cap structure of mRNA
1. Biochemical characteristics of proteins. Protein synthesis. The overview of the differences between
the eukaryotic and prokaryotic protein synthesis
(scanning) and the Kozak sequence promotes the connection between the mRNA and the small subunit (Figure 1.13.). Initiation is ended by the formation of the 70S or 80S ribosome complex (Figure 1.14.).
Figure 1.10. Figure 1.10. The structure of ribosomes.
Figure 1.11. Figure 1.11. The structure of the active ribosome.
Figure 1.12. Figure 1.12. The initiation of protein synthesis in prokaryotes.
1. Biochemical characteristics of proteins. Protein synthesis. The overview of the differences between
the eukaryotic and prokaryotic protein synthesis
Figure 1.13. Figure 1.13. The initiation of protein synthesis in eukaryotes.
Figure 1.14. Figure 1.14. The initiation ends with the formation of 70S/80S ribosome
compex.
1. Biochemical characteristics of proteins. Protein synthesis. The overview of the differences between
the eukaryotic and prokaryotic protein synthesis
The second step of protein synthesis is elongation – lengthening of the polypeptide chain (Figure 1.15.). An aminoacyl-tRNA binds to the A site. The attachment of the aminoacyl-tRNA to the ribosome is an energy- requiring process, which takes place with the help of Tu elongation factor. The amino acid in A site gets closer to the amino acid in P site, whereby it will be enabled to form a peptide bond. Peptide bond formation is catalyzed by the peptidyl-transferase activity of the ribosome. In the course of the translocation of the ribosome peptidyl-tRNA in A site moves to the P site by the sliding of the ribosome, A site stays empty. At the end of the process, the empty tRNA moves to E site, and from there it moves on to the cytosol. P site contains the growing polypeptide chain linked to a tRNA molecule, while the next aminoacyl-tRNA can bind to the empty A site. In the course of the elongation, the protein is synthesized in the amino-to-carboxyl direction, in the course of which the ribosome moves from the 5’ end to the 3’ end of mRNA (Figure 1.16.). At the same time, multiple ribosomes can be attached to one mRNA molecule (polysome) and synthesize proteins. Elongation is an energy- requiring process, but energy is not needed for the peptide bond formation itself.
Figure 1.15. Figure 1.15. The second step of protein synthesis: the elongation.
1. Biochemical characteristics of proteins. Protein synthesis. The overview of the differences between
the eukaryotic and prokaryotic protein synthesis
Figure 1.16. Figure 1.16. The major features of elongation.
The third and the final step of protein synthesis is termination. Termination factors, the so-called ’Release Factors’ (such as RF1) recognize the stop codon, bind to it and lead to the disassembly of the ribosome-tRNA- mRNA complex (Figure 1.17.).
Figure 1.17. Figure 1.17. The third step of protein synthesis: the termination.
1. Biochemical characteristics of proteins. Protein synthesis. The overview of the differences between
the eukaryotic and prokaryotic protein synthesis
In the case of eukaryotes the protein synthesis occurs in the cytosol, while transcription and mRNA maturation take place in the nucleus (Figure 1.18.). Only the completely mature mRNA can get out of the nucleus, therefore, erroneously synthesized or half-matured mRNA cannot serve as a template for protein synthesis. In prokaryotes the localization of transcription and protein synthesis is the same (Figure 1.19.).
Figure 1.18. Figure 1.18. The localization of protein synthesis in eukaryotes.
Figure 1.19. Figure 1.19. The localization of protein synthesis in prokaryotes.
1. Biochemical characteristics of proteins. Protein synthesis. The overview of the differences between
the eukaryotic and prokaryotic protein synthesis
Chapter 2. 2. Protein folding, 3D structure formation. Chaperons.
Folding problems, folding diseases.
1.
Hydrogen bonds (Figure 2.1.), electrostatic (Figure 2.2.) and hydrophobic (Figure 2.3.) interactions play an important role in the formation of the protein structure. Proteins gain their characteristic structure in aqueous environment and they also work in such an environment. Polar water molecules that are present in the living organisms stabilize the structure of proteins with bonds formed with the hydrophilic groups of proteins (Figure 2.4.). Protein folding is the process through which proteins gain their spatial structure (Figure 2.5.).
Figure 2.1. Figure 2.1. The most abundant bonds in the living system: hydrogen bonds.
Figure 2.2. Figure 2.2. The most abundant bonds in the living system: electrostatic
interactions.
2. Protein folding, 3D structure formation. Chaperons. Folding
problems, folding diseases.
Figure 2.3. Figure 2.3. The most abundant bonds in the living system: hydrophobic interactions.
Figure 2.4. Figure 2.4. The polar water molecules stabilize the structures in the living
systems.
2. Protein folding, 3D structure formation. Chaperons. Folding
problems, folding diseases.
Figure 2.5. Figure 2.5. The protein folding.
Protein structure
Proteins have a primary, secondary, tertiary and quaternary structure (Figure 2.6.). The primary structure is basically the order of the amino acids (Figure 2.7.), which bind to each other by means of peptide bonds. The delocalized electron pair in the peptide bond provides a rigid structure thus the peptide bond is rigid and rotation is possible only at the level of angles φ and ψ (Figure 2.8.). Due to the rotation, the peptide bond can adopt theoretically any conformation, but due to the steric hindrance the number of the possible conformations is limited. The Ramachandran diagram shows the possible combinations of the φ and ψ angles.
The primary structure of proteins is not favorable, which is why the secondary structure is formed. The
2. Protein folding, 3D structure formation. Chaperons. Folding
problems, folding diseases.
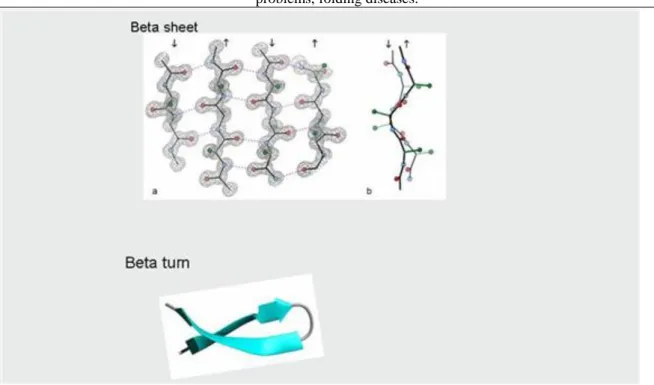
present very often. In the case of the β-sheet, the hydrogen bridges are formed between the chains and not in the chain, the polypeptide chains do not fold, a sheet structure is formed. Depending on the orientation of the chains the β-sheet can be parallel or antiparallel (Figure 2.10.). Val, Ile, Phe, Tyr, Trp and Thr aminoacids prefer the β- sheet structures. The β-turn is a structure made of few amino acids that link two β-sheets or α-helixes (Figure 2.10.). Gly, Ser, Asp, Asn and Pro are the most preferred amino acids in the case of the β-turns. The type of the probable secondary structure of a polypeptide chain can be predicted by the chemical features of the amino acids and the position of the hydrophobic amino acids in a protein (Figure 2.11.).
Figure 2.6. Figure 2.6. The structure of proteins.
Figure 2.7. Figure 2.7. The primary structure of proteins: the amino acid sequence.
Figure 2.8. Figure 2.8. The peptide bond.
2. Protein folding, 3D structure formation. Chaperons. Folding
problems, folding diseases.
Figure 2.9. Figure 2.9. The structure of alfa helix.
Figure 2.10. Figure 2.10. The structure of beta sheet and beta.
2. Protein folding, 3D structure formation. Chaperons. Folding
problems, folding diseases.
Figure 2.11. Figure 2.11. The prediction of protein structure based on the position of hydrophobic amino acids.
In the course of protein folding, the secondary structures form so-called supersecondary elements or modules, and the further organization of these results in a three-dimensional structure, the tertiary structure (Figure 2.12.). Some proteins have quaternary structures as well. This is important in those cases, when the proteins with tertiary structure organize further and will achieve their functional form in this way (e.g., hemoglobin).
Figure 2.12. Figure 2.12. The tertiary structure of the proteins is made up of secondary
structure elements.
2. Protein folding, 3D structure formation. Chaperons. Folding
problems, folding diseases.
Protein folding
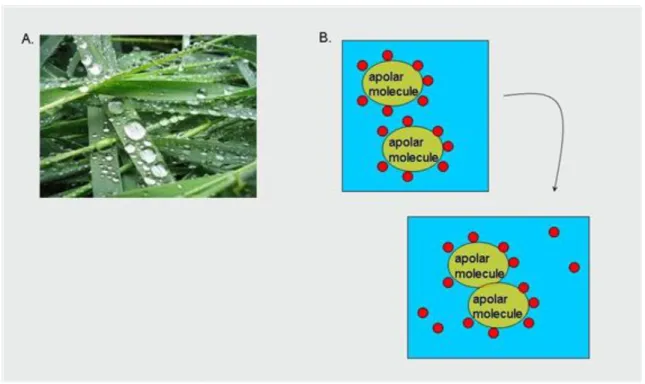
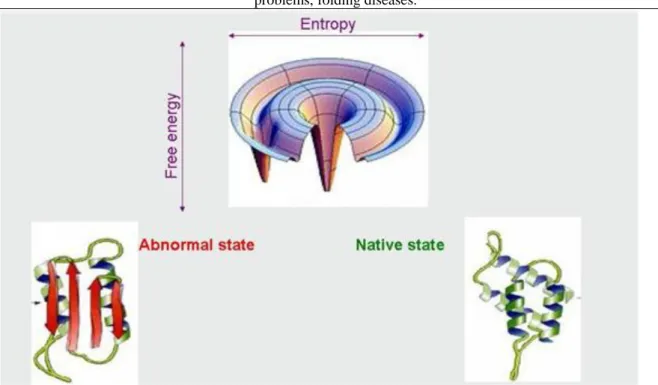
According to the Anfinsen experiment, the conformation of the proteins is determined by the order of the amino acids (Figure 2.13.). According to the Levinthal paradox, the proteins gain their three-dimensional structure from within a few seconds to several hours, but their reorganization in a different conformation, in case of a 100 amino acid long poly-peptide chain ca. 10-13 takes seconds, so the total folding of the protein takes ca.1081 seconds (the age of the Universe is ca. 6x10¹⁷ seconds). Thus, we can conclude that the proteins do not try each possible conformation in the course of folding. The folding of proteins happens through metastable intermediate states (Figure 2.14.), first some particular parts fold independently of each other and then they further organize in order to reach the minimal energy level characteristic of the protein. The main driving force in the organization of the protein structure is the entropy of hydrophobic exclusion, which happens due to the fact that the non-polar side chains cannot interact with water. In the course of folding, the water molecules are excluded, so the entropy of the water increases. In the case of the folded, globular amino acids, the hydrophobic amino acids are inside, while the hydrophylic amino acids are outside.
Figure 2.13. Figure 2.13. The Anfinsen experiment.
2. Protein folding, 3D structure formation. Chaperons. Folding
problems, folding diseases.
Figure 2.14. Figure 2.14. The folding of proteins through metastabile intermediates.
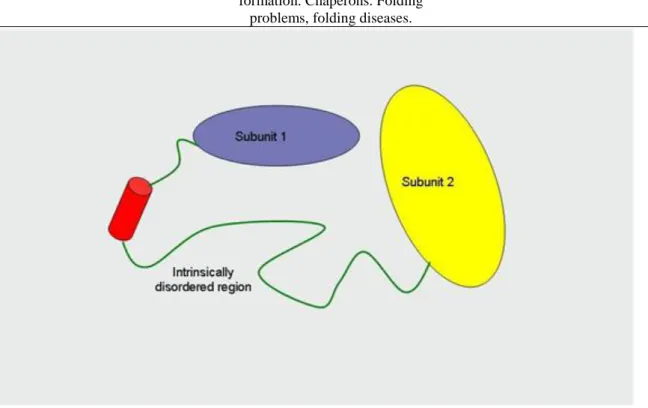
Not each protein has a stable tertiary structure. The intrinsically disordered proteins are proteins that do not have a stable spatial structure (Figure 2.15.). The structure of these proteins changes through protein-protein interactions, in the course of these interactions the proteins can get an α-helix or β-sheet structure (Figure 2.16.).
The intrinsically disordered proteins have several functions. They have a role in the intra-molecular motions (some domains are connected through flexible linker regions), numerous times they are the place of posttranslational modifications and as they can strongly bind the small molecules, they can have storage and protective roles (e.g., the acidic glycoproteins found in saliva, beta-casein, calreticulin). They play a role in molecular interactions and thus in the regulation (e.g., the protein mdm2 regulates the functioning of p53). They are able to form multiple protein-protein interactions as well – the intrinsically disordered proteins are often located in the hubs of protein networks.
Figure 2.15. Figure 2.15. The structure of intrinsically disordered proteins.
2. Protein folding, 3D structure formation. Chaperons. Folding
problems, folding diseases.
Figure 2.16. Figure 2.16. The intrinsically disordered proteins can adopt alpha helix or beta sheet structure upon interacting with other proteins.
The protein folding does not always happen spontaneously. In many cases, special molecules, the so-called chaperon or "Gardedame" proteins (Figure 2.17.) help the proteins to achieve their spatial structures and correct the misfolded structures. In the course of correction the chaperons permit the relaxation of the misfolded structure and enable once again the correct folding of the proteins (Figure 2.18.). The functioning of chaperons requires a significant amount of energy in the form of ATP (Figure 2.19.).
Figure 2.17. Figure 2.17. The crystal structure of the GroEL chaperon (pdb code:
2NWC).
2. Protein folding, 3D structure formation. Chaperons. Folding
problems, folding diseases.
Figure 2.18. Figure 2.18. The function of chaperons.
Figure 2.19. Figure 2.19. The role of chaperons in the formation and maintenance of the
protein 3D structure.
2. Protein folding, 3D structure formation. Chaperons. Folding
problems, folding diseases.
The chaperons can be monomers (Hsp70), dimers (Hsp90) and oligomers (Hsp 20-30, Hsp60, Hsp110) according to their structure (Figure 2.20.). The Hsp60 forms with Hsp10 a special medium forming the so-called Anfinsen cage, in which the misfolded proteins can gain their native structure (Figure 2.21.). The Hsp70 plays a role in the formation of the proper structure and the transport of the protein to the mitocondrium (Figure 2.22.).
The proteins that cannot be fixed by chaperons will be degraded by proteasomes. The Hsp90 plays an important role in the functioning of the steroid receptors (Figure 2.23.), while Hsp110 is responsible mainly for the correction of denatured and aggregated proteins in the cell (Figure 2.24.).
Figure 2.20. Figure 2.20. Classification of chaperons according to their structure.
Figure 2.21. Figure 2.21. The function of Hsp60.
2. Protein folding, 3D structure formation. Chaperons. Folding
problems, folding diseases.
Figure 2.22. Figure 2.22. The function of Hsp70.
Figure 2.23. Figure 2.23. The function of Hsp90.
2. Protein folding, 3D structure formation. Chaperons. Folding
problems, folding diseases.
Figure 2.24. Figure 2.24. The function of Hsp110.
The special chaperons of the endoplasmic reticulum, the calreticulin and calnexin are correcting the misfolded proteins in the lumen of the endoplamic reticulum (Figure 2.25.).
Figure 2.25. Figure 2.25. The function of calnexin and calreticulin.
2. Protein folding, 3D structure formation. Chaperons. Folding
problems, folding diseases.
Beside the chaperons, other proteins also play a role in the organization of the spatial structure of proteins. Such protein is the protein disulfide-isomerase enzyme that catalyzes the formation and reorganization of disulfide bridges (Figure 2.26.) and the peptidil-prolyl isomerase (Figure 2.27.), which catalyzes the Pro cis-trans conversion.
Figure 2.26. Figure 2.26. The function of protein disulfid isomerase (PDI).
Figure 2.27. Figure 2.27. The function of peptidil-prolyl isomerase.
2. Protein folding, 3D structure formation. Chaperons. Folding
problems, folding diseases.
Folding errors and folding diseases
There exist proteins that have more than one stable structure. Beside the normal, functional structure, they are able to form stable, abnormal structures as well (Figure 2.28.). Such proteins are the prion proteins. In normal conditions, some prion proteins are present in the living cells in their native form but under certain circumstances in the case of some prion proteins, the normal to abnormal transition occurs. As soon as an abnormal prion form gets in contact with the normal prion proteins, it forces them into an abnormal state (Figure 2.29.). A high number of abnormally structured prion proteins cause the death of cells and so-called prion- diseases (kuru, Creutzfeld-Jakobs disease, etc.) develop. A similar process leads to the formation of amyloid plaques. Beside its native and denatured forms, the amyloid proteins can take up a so-called molten globule intermediate status, which stabilizes with the aggregation of proteins forming amyloid fibers and later amyloid plaques (Figure 2.30.). These amyolid plaques make impossible the functioning of neurons, causing their death.
Diseases, such as Alzheimer-disease or Parkinson-disease caused by the death of neurons have an ever higher impact on the society.
Figure 2.28. Figure 2.28. In the course of the folding process proteins with abnormal
structure can be formed as well.
2. Protein folding, 3D structure formation. Chaperons. Folding
problems, folding diseases.
Figure 2.29. Figure 2.29. The number of “bad” prions increase upon coming in contact with native, endogenious forms.
Figure 2.30. Figure 2.30. The probable mechanism of amyloid plaque formation.
2. Protein folding, 3D structure formation. Chaperons. Folding
problems, folding diseases.
Chapter 3. 3. Protein sorting and targeting
1.
The proteins of different organelles are synthesized either in the cytosol on the free ribosomes or on the ribosomes linked to the surface of endoplasmic reticulum (ER). The signals encoded in the amino acid sequence of proteins target them to the different organelles. These so-called signal sequences are recognized and bound by specific proteins, thus making possible the protein targeting to the required places.
Protein targeting to the endoplasmic reticulum
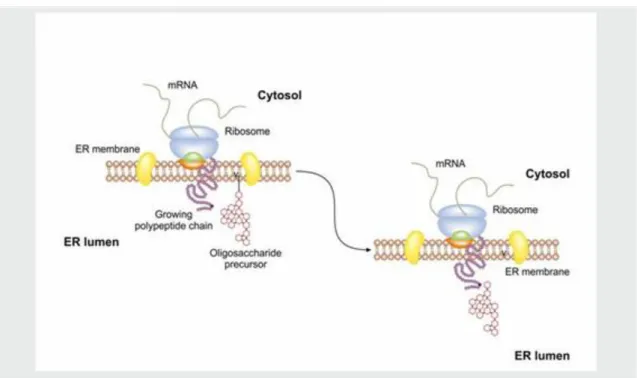
The protein translation starts in the cytosol. The proteins targeted to ER have a signal sequence at their N- terminal part and this signal sequence is recognized by a signal recognition particle (SRP) targeting the ribosome to the SPR receptor in the ER membrane (Figure III-1). As soon as the signal sequence enters the ER lumen the SRP is released and it is able to participate in a new cycle. The synthesized protein enters the ER lumen, where the signal peptidase enzyme cleaves off the signal sequence while the ribosome will be linked with special linker proteins to the ER membrane forming the rough endoplasmic reticulum (RER) (Figure III-2).
When the translation is finished, the ribosome complex is dissociated (Figure III-3).
Figure 3.1. Figure 3.1. Protein targeting to endoplasmic reticulum (ER) I.
Figure 3.2. Figure 3.2. Protein targeting to endoplasmic reticulum (ER) II.
3. Protein sorting and targeting
Figure 3.3. Figure 3.3. Protein targeting to endoplasmic reticulum (ER) III.
The protein in the ER lumen is cotranslationally (at the same time as the translation) modified, it gets N- glycosylated (Figure 3.4. and Figure 3.5.).
Figure 3.4. Figure 3.4. Protein targeting to endoplasmic reticulum (ER) and their
cotranslational modification.
3. Protein sorting and targeting
Figure 3.5. Figure 3.5. The cotranlational N-glycosidation of proteins in the endoplasmic reticulum.
The oligosaccharide precursor starts to get synthesized on the dolichol-phosphate group in the ER membrane.
The first steps of the synthesis take part in cytosol and later with reorientation the sugar harboring dolichol phosphate translocates to the luminal side of the ER membrane where the last steps of synthesis occur. The newly formed 14 sugar unit containing oligosaccharide molecule is transferred to the corresponding Asn side chain of the nascent protein (Figure 3.6.).
Figure 3.6. Figure 3.6. The mechanism of N-glycosidation, the formation of
oligosaccharide chain on dolichol phosphate.
3. Protein sorting and targeting
In the ER the proteins acquire their three dimensional structure with the help of specific chaperon proteins. The chaperons increase the rate of folding while prevent the aggregation and misfolding. In the ER lumen the attached oligosaccharide chain will be further modified. The proper S-S bonds are formed in proteins with the help of protein disulphide isomerases, and the peptidyl-prolyl isomerases help the cis-trans rearrangements of peptide bonds. As soon as the proper three dimensional structure is achieved, the glucose is cleaved off and the protein is wrapped into specific vesicles and transported to the Golgi system. The assembly of the multimer proteins happens in the ER as well. The presence of glucose indicates that the protein is not ready for transport into the Golgi system thus the ER chaperons the calnexin and calreticulin bind the glucose containing proteins, helping their folding. In the ER, there is an efficient quality control system which prevents the transport of partially folded or misfolded proteins. When the misfolded proteins cannot be fixed, the ER associated degradation (ERAD) system targets them back to the cytosol where they will be ubiquitinated and degraded by the proteasome (Figure 3.7.).
Figure 3.7. Figure 3.7. Quallity control in the endoplasmic reticulum (ERAD).
3. Protein sorting and targeting
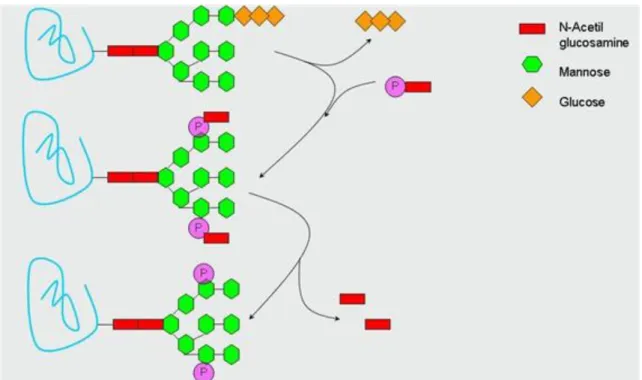
Proteins with proper structure are targeted to the Golgi and after the Golgi-specific modifications are sorted and transported to the different compartments or are secreted (Figure 3.8.). In the case of the ER proteins, the KDEL sequence is present at their C terminal regions help their recirculation to the ER. In the Golgi compartments the oligosaccharide chain of proteins is further modified (Figure 3.9.) giving rise to various sugar complexes (Figure 3.10.). The generated sugar is an important localization signal determining the protein targeting to different organelles.
Figure 3.8. Figure 3.8. The route of proteins among different compartments.
Figure 3.9. Figure 3.9. The modification of proteins in the Golgi compartments.
3. Protein sorting and targeting
Figure 3.10. Figure 3.10. In Golgi apparatus different N-glycosilated proteins are formed with various sugar composition.
Protein targeting to mitochondria
The mitochondrial proteins are synthesized on the free ribosomes in cytosol. On their N-terminal part a mitochondrial signal sequence can be found orienting them to the mitochondrium. With the help of Hsp70 proteins the mitochondrial proteins can reach the mitochondrium where they bind to the import receptor in the outer mitochondrial membrane. The proteins enter the mitochondria through a channel spanning the membrane and in the mitochondrial matrix the signal sequence is cleaved off by the signal peptidase. In the mitochondrial matrix, the proteins achieve their proper three dimensional structures with the help of mitochondrial Hsp70 (mHsp70) (Figure 3.11.). The completely folded proteins cannot enter the mitochondria.
3. Protein sorting and targeting
Protein targeting to the nucleus
Proteins targeted to the nucleus can enter the nucleus through specialized structures, the nuclear pore complexes, situated in the nuclear envelope. The transport is a complex and energy consuming process involving different proteins making possible for nuclear localization signal (NLS) containing proteins to enter the nucleus (Figure 3.12.).
Figure 3.12. Figure 3.12. Protein targeting to the nucleus.
Chapter 4. 4. The examination of protein structure: X-ray
crystallography, NMR, mass spectrometry
1.
The structure of proteins can give valuable information regarding the function of proteins and can also give us insight into the possible functional defects. As the size of the proteins falls into the nm (10-9 m) range, X-rays can be administered most effectively for determining their structure.
Protein structure determination by X-ray crystallography
The method can be used for structure determination in case of crystallized materials. A good quality crystal structure can be achieved, providing a multitude of information. One drawback of the technique is that only suitable crystals can be analyzed – in the case of many proteins, the crystallization is not possible as the whole protein or only some parts of it are too flexible to be crystallized (Figure 4.1.). Another drawback is that the crystal structure reflects the static structure without giving any information about protein dynamics.
Figure 4.1. Figure 4.1.The relation between protein structure and the presence of intrinsic disorder.
The first step in X-ray crystallography is to crystallize proteins and create suitable crystals, which can be analyzed with the help of X-ray (Figure 4.2.). In the following steps from the diffraction map an electron density map is generated and the amino acid sequence is fitted into this electron density map (Figure 4.3.).
Figure 4.2. Figure 4.2. Determination of protein structure with X-ray crystallography I.
4. The examination of protein structure: X-ray crystallography,
NMR, mass spectrometry
Figure 4.3. Figure 4.3. Determination of protein structure with X-ray crystallography II.
The quality of amino acid fitting will define the quality of the crystal structure; the better the resolution the more detailed the crystal structure is (Figure 4.4). In case of substances which do not crystallize well, alternative methods need to be applied like NMR (nuclear magnetic resonance), Raman spectroscopy, infrared spectroscopy etc.
Figure 4.4. Figure 4.4. The quality of amino acid residue fitting in the electron density
map determines the quality of the crystal structure.
4. The examination of protein structure: X-ray crystallography,
NMR, mass spectrometry
Protein structure determination by nuclear magnetic resonance (NMR)
The method is suitable for structure determination of proteins dissolved in solution. The essence of the method is that the energy level of the so-called NMR active atoms (1H, 13C, 15N) will change when placed in a magnetic field and this change depends on the magnetic field and the local geometry of the atoms (Figure 4.5.).
The major advantage is that this method gives us information about protein dynamics, its drawback is that it can be used only in the case of small proteins.
Figure 4.5. Figure 4.5. Determination of protein structure with nuclear magnetic resonance (NMR).
The protein structures determined by various means are deposited in the protein databank (PDB), a freely
4. The examination of protein structure: X-ray crystallography,
NMR, mass spectrometry
Figure 4.6. Figure 4.6. Protein Data Bank (PDB) – the repository of determined protein structures.
Protein structure analysis by mass spectrometry
Mass spectrometry is an instrumental analytical technique, which is suitable for the analysis and the isolation of gas-phase ions by mass to charge ratio. A mass spectrometer is a system consisting of an ion-source, a mass analyzer and a detector. The ion-source converts the sample to gas-phase ions, the mass analyzer is used for the separation and/or fragmentation of ions, and the detector detects ions arriving from the analyzer (Figure 4.7.).
Figure 4.7. Figure 4.7. The structure of a mass spectrometer.
Simple mass spectrometers contain a single mass analyzer (e.g.,: MALDI-TOF). Tandem spectrometers consist mainly of two analyzers that can operate on the same or on different principles (e.g. TOF-TOF, Q-TOF, QTRAP). The different mass spectrometers contain various combinations of ion sources and analyzers (e.g.
MALDI-TOF-TOF, ESI-Q-TOF, ESI-QTRAP etc.). Mass spectrometry can be successfully applied for protein identification and localization analysis, protein sequencing, determination of protein amount and for the analysis of protein complexes. In special conditions, it can be utilized for gaining information regarding the protein structure.
4. The examination of protein structure: X-ray crystallography,
NMR, mass spectrometry
The ionization of the sample can take place via various methods. Most frequently-used techniques are MALDI (Matrix-Assisted Laser Desorption.Ionization) and ESI (Electrospray Ionization).
In the course of MALDI method crystallized sample is converted to gas-phase sample ions (Figure 4.8.). The sample is mixed with an excessive amount of matrix solution and is crystallized together with the matrix, and then energy is transferred to the sample by laser irradiation. The ionization of the sample is promoted by the matrix ions. In the course of the process single- or double-charged ions are formed. The selection of the matrix is an important step; its type always depends on the type of the sample to be analyzed.
Figure 4.8. Figure 4.8. The theory of MALDI – Matrix Assisted Laser Desorption Ionization.
In the course of the ESI, the vaporization and the ionization of the sample dissolved in liquid takes place leading to the formation of multiply charged ions. It is suitable for the on-line connection of liquid-chromatography and mass spectrometry, thus for the analysis of the sample separated by liquid-chromatography (HPLC). It can be applied in wide volume range (nl-ml), but the use of drying gas (nitrogen) is needed. The dissolved sample arriving from HPLC is ionized by the effect of the connected high voltage (1800-3500 V). The volume of the ionized drops gradually decreases due to the drying gas while its charge is steady, then the ionized drops fall apart into smaller pieces due to the Coulomb explosion (Figure 4.9.). This process is repeated several times, thus the material that enters the mass spectrometer practically contains only sample ions.
Figure 4.9. Figure 4.9. The principle of electro spray ionisation (ESI).
4. The examination of protein structure: X-ray crystallography,
NMR, mass spectrometry
The different mass spectrometers can consist of various types of mass analyzers. The most frequently used ones are the time of flight (TOF) analyzers, the quadrupoles and the ion traps.
In TOF analyzers, ions move according to their size and their kinetic energy; small ions move faster than the larger ones in the analyzer. The longer the way the ions traverse, the better the separation will be (Figure 4.10.).
Figure 4.10. Figure 4.10. The ion path in the Time-Of-Flight (TOF) mass analyzer.
In the flight tube, the way of the ions is lengthened by the application of reflectron, improving the resolution of the mass spectrometer (Figure 4.11.).
Figure 4.11. Figure 4.11. Improvement of mass resolution of mass spectrometers by the
administration of a reflectron.
4. The examination of protein structure: X-ray crystallography,
NMR, mass spectrometry
The quadrupole analyzer consists of four semiconductor electrodes and the ion permeability of the quadrupole can be regulated by the voltage electrodes. With voltages applied to these electrodes specific ions will be stabilized and will be able to go through the quadrupole (Figure 4.12.).
Figure 4.12. Figure 4.12. The ion path in the quadrupole.
The structure of the ion trap is similar to that of the quadrupole. It stabilizes all the ions that entered the ion trap;
some of the trapped ions can be specifically destabilized with the help of the voltages applied to the electrodes of the ion trap and released toward the detector (Figure 4.13.).