Non-linearities in bird responses across urbanisation gradients: a meta-analysis Running head: Effects of urbanisation on birds
Péter Batáry1,2,*, Kornélia Kurucz3, Marcela Suarez-Rubio4 and Dan E. Chamberlain5
1Agroecology, University of Goettingen, Grisebachstr. 6, 37077 Göttingen, Germany, pbatary@gmail.com
2GINOP Sustainable Ecosystems Group, MTA Centre for Ecological Research, Klebelsberg Kuno u. 3, 8237 Tihany, Hungary
3Szentágothai Research Centre, University of Pécs, Ifjúság útja 20, 7624 Pécs, Hungary kornelia.kurucz@gmail.com
4Institute of Zoology, University of Natural Resources and Life Sciences, Gregor-Mendel- Straße 33, 1180 Vienna, Austria, marcela.suarezrubio@boku.ac.at
5Dipartimento di Scienze della Vita e Biologia dei Sistemi, University of Turin, Via Accademia Albertina 13, 10123 Torino, Italy, dan.chamberlain99@googlemail.com
Corresponding author: Péter Batáry, Agroecology, University of Goettingen, Grisebachstr.
6, D-37077 Göttingen, Germany, Tel.: +49-551-3922358; Fax: +49-551-398806. E-mail:
pbatary@gmail.com
Keywords: abundance, biodiversity, city size, gradient length, species richness, suburban, systematic review, rural.
Type of paper: Primary Research Article
Author contributions:
PB and KK designed the study with support from MSR and DEC; KK collected and prepared data; PB and KK analysed data; all authors contributed to the writing of the manuscript.
Abstract
Urbanisation is one of the most extreme forms of environmental alteration, posing a major threat to biodiversity. We studied the effects of urbanisation on avian communities via a systematic review using hierarchical and categorical meta-analyses. Altogether, we found 42 observations from 37 case studies for species richness and 23 observations from 20 case studies for abundance. Urbanisation had an overall strong negative effect on bird species richness, whereas abundance increased marginally with urbanisation. There was no evidence that city size played a role in influencing the relationship between urbanisation and either species richness or abundance. Studies that examined long gradients (i.e. from urban to rural) were more likely to detect negative urbanisation effects on species richness than studies that considered short gradients (i.e. urban vs. suburban or urban vs. rural areas). In contrast, we found little evidence that the effect of urbanisation on abundance was influenced by gradient length. Effects of urbanization on species richness were more negative for studies including public green spaces (parks and other amenity areas) in the sampled landscapes. In contrast, studies performed solely in the urban matrix (i.e., no green spaces) revealed a strong positive effect on bird abundance. When performing subset analyses on urban-suburban, suburban- rural and suburban-natural comparisons, species richness decreased from natural to urban areas, but with a stronger decrease at the urban–suburban interface, whereas bird abundance showed a clear intermediate peak along the urban-rural gradient, although abundance in natural areas was comparable to that in suburban areas. This suggests that species loss happens especially at the urban-suburban interface, and that the highest abundances occur in suburban areas compared to urban or rural areas. Thus, our study shows the importance of suburban areas, where the majority of birds occur with fairly high species richness.
Introduction
Urbanisation is one of the most extreme forms of environmental alteration, posing a major threat to biodiversity and altering fundamental ecosystem services upon which human civilisation depends (Aronson et al., 2014; Sol et al., 2014). The problems caused by urbanisation are diverse. As environmental conditions are significantly altered, natural habitats of many plant and animal species are rapidly reduced and transformed (Grimm et al., 2008). Cities are novel ecosystems, characterised by fragmented environments with a higher level of disturbance than natural habitats and with a strongly altered pattern of resources (Rebele, 1994; Alberti, 2015). However, with the rapid expansion of urban development (Cohen et al., 2006; Seto et al., 2013) and the associated modification of habitats, it is crucial to understand the relationship between biodiversity and urban habitats (Clergeau et al., 1998).
Bird abundance and community composition in urban areas have been well described, with the main conclusion that bird community composition becomes increasingly
impoverished with urban development, leading to the dominance of a few abundant species (Kelcey & Rheinwald, 2005), and hence resulting in long-term reduction in diversity (Chace
& Walsh, 2006; Sol et al., 2014). Researchers have commonly observed lower species richness in urban areas relative to that of the surrounding rural landscapes (Clergeau et al., 2006; Sandström et al., 2006). However, these patterns are by no means universal, and other studies have found a non-linear response, in which areas with intermediate levels of
urbanisation exhibit the highest richness (Blair, 1996; Marzluff, 2001; McKinney, 2002;
Tratalos et al., 2007), whilst overall bird abundance often increases from rural to urban areas (Chase & Walsh, 2006; Faeth et al., 2011; Njorge et al. 2014), although other studies have found no trend (Chamberlain et al., 2017) or inconsistent responses across different cities (Garaffa et al., 2009; Jokimäki et al., 2002).
The variety of responses of bird communities to urbanisation gradients may arise for a number of reasons. First, there is no generally accepted definition of what is an ‘urban’
landscape, and considerable differences in classification of urban, suburban and rural habitats exist among countries and continents (McIntyre et al., 2000; Seto et al., 2013). Thus,
behavioural responses of animals to urban gradients may differ between individual studies, in part due to variations in gradient composition. Second, gradient length and resolution may affect the conclusions of studies. In particular, many studies often reduce the urban-rural gradient to a simple dichotomy, which may obscure important non-linear effects in terms of urban-suburban and suburban-rural transitions (Alberti, 2015). Third, the characteristics of individual cities may affect responses along the urban-rural gradient. Whilst this may be underpinned by a large number of interacting factors (e.g. pollution levels, socioeconomic conditions, habitat management, availability of green space), human population size in cities can be a general indicator of key characteristics (Bettencourt & West, 2010), such as habitat loss, fragmentation and disturbance. Thus human population size has been shown to be important in affecting patterns of bird species richness within cities (Gagné et al., 2016) and of bird abundance responses to urban-rural gradients (Garaffa et al., 2009), although Clergeau et al. (2001) found no effect of human population size on species richness.
The main objective of this study was to perform a set of meta-analyses based on a comprehensive and systematic literature review, thereby synthesising the relative impact of urbanisation on bird assemblages. Importantly, we also assessed factors that may have
underpinned the wide variation in responses detected in previous studies. In particular: (1) we adopted an objective definition of urban, suburban and rural areas (e.g. Clergeau et al., 2001 and Saari et al., 2016) in order that different gradients can be broadly comparable; (2) we assessed bird responses across a simple urban-rural contrast, but also assessed intermediate levels of urbanisation, thus allowing detection of non-linear responses; and, (3) we assessed the responses of bird communities in relation to city size, which is assumed to be a good indicator of city-level characteristics (as per Bettencourt & West, 2010). This type of analysis
provides a statistical framework for integrating results of previous studies, and aids our understanding of both the ecological implications of increasing urbanisation and how to mitigate its threat to biodiversity.
Materials and Methods
We studied the effects of urbanisation on bird communities within a systematic review framework using meta-analysis. In ecology, there is a growing need for quantitative research syntheses to generate higher order conclusions (Gurevitch et al., 2001; Stewart, 2010). In contrast to qualitative and descriptive traditional reviews, meta-analysis allows the quantification and summary of results of several independent studies examining the same question (Gurevitch et al., 1992; Cooper et al., 2009). In meta-analysis, the magnitude of standardised effects (effect size) is quantified from each individual study, and these are then used to calculate the combined (overall) magnitude and significance of the effect under the meta-analytical study (Hedges & Olkin, 1985).
Literature search and study selection
We conducted a systematic literature survey using Web of Science and Scopus databases (until 15th June 2015) for topics including the following so called PICO (Population, Intervention, Comparator and Outcome) combination of search terms (Higgins & Green 2008): (bird OR avian) AND (urban* OR rural OR suburban) AND (“species richness” OR diversity OR abundance OR density). We refined the searches by excluding (editorial material OR review OR meeting abstract OR book chapter) document types in Web of Science Core Collection, and (book series OR book OR conference proceedings OR review) source types in Scopus. This resulted in a total of 2351 potential publications.
Only studies published in peer-reviewed journals were included in the meta-analysis, relying on the peer-review process as a first step of quality control. After a duplicate filtering for hits located by both databases with Mendeley reference manager software (Mendeley 2015), we performed a filtering through the title and abstracts of each article, then through the full text of each potentially relevant article to decide whether the article matched our selection criteria (for the detailed selection process see the PRISMA flow diagram in supplementary Fig. S1). We applied the following inclusion criteria for study selection: (1) studies that investigated the changes in bird species richness and/or abundance along an urbanisation gradient (urban vs. suburban vs. rural areas or urban-rural gradient); (2) studies that were carried out in cities and included at least four spatial replicates per urbanisation gradient category; and (3) studies that reported mean, standard deviation, standard errors of mean or confidence interval (CI), and sample size for urbanisation gradient categories, or studies that reported statistics (F, t or Chi-square values and sample size) on urbanisation gradient effect on birds. Studies that investigated a single group of birds or a single functional guild, which did not represent the whole community, were excluded. Altogether, we found 39 relevant papers, comprising 42 observations of 37 case studies for species richness (Table S1), and 23 observations of 20 case studies for abundance (Table S2). A list of articles excluded during full text filtering and reasons for exclusion is presented in Table S3. In cases where an article was excluded due to under-reported statistics, we contacted the authors for further
information (15 articles), but the response rate was low (40%).
Data extraction
To test the dependence of the urbanisation effect on city size, we used the human population data provided in the articles or checked the population size of a city for the year when the study was carried out using online databases and websites (Tables S1-2). Given the
inconsistent and often subjective classifications of urban land use types (Seto et al., 2013), we standardised definitions based on descriptions provided in the articles used in the meta-
analysis and re-categorised the data according to the following classification to provide more homogenous comparison across studies: “Natural” – natural or semi-natural habitats with little or no human habitation; “Rural” – very low density of housing in a modified, usually farmland matrix; “Suburban” – residential areas, consisting of low-rise houses with lawns and/or private gardens, and relatively high vegetation cover (ca. 50% or more, where
quantified); and, “Urban” – dominated by artificial, sealed surfaces (>50% where quantified), and characterized by commercial/industrial buildings or high-rise residential areas. In cases where only qualitative descriptions were given, we accepted, or re-classified as necessary, categories which were stated to be predominated by the land uses described above (i.e. we assumed the 50% thresholds, as above). However, in some cases, it was still not possible to separate categories, in particular urban and suburban classes.
Of the 39 studies used in the meta-analyses, we accepted the classification of 22 studies (Tables S1-2). We changed the original classification of urban land use types according to our categorization for eleven studies, either in terms of changing the definition (e.g. from
suburban to urban), amalgamating groups used in a given study into one of our four
categories, or changing the terminology to fit in with our classification. Among them, there were six studies where urban and suburban classifications could not be clearly separated, and so were classified as “Urban + Suburban”. Additionally, there were six further studies that investigated a gradient of settlement size or a grid-based urbanisation gradient, where such a classification was not possible. The latter were included in the summary analyses and calculation of overall mean effect size, but not in the categorical or subset analyses (see below).
Based on this re-classification, the species richness and abundance datasets were divided into two groups according to which part of the urbanisation gradient was studied.
Thus we defined a “short gradient”, if the comparison was urban vs. suburban or suburban vs.
rural habitats, and a “long gradient”, if the whole urban to rural gradient was analysed (Fig.
S2). Importantly, urban public green spaces, including parks, public gardens and other
amenity areas, can be significant contributors to overall biodiversity (e.g. Fernández-Juricic &
Jokimäki, 2001), but may occur across the urban-rural gradient, and yet themselves form rather separate habitats within a given land use category. To account for this (11 studies), we incorporated green spaces (referred to in the analysis as parks for simplicity, but
encompassing a range of urban green spaces) as a factorial moderator in the meta-analyses (i.e. presence or absence of parks included within the sampled landscapes for a given land use type). There were nine studies that did not specify whether green spaces were included and which were omitted from this analysis.
Effect size calculation
For an effect size measure, we used Pearson’s correlation coefficient (r). The effect sizes and their varianceswere calculated for all observations in different ways depending on the type of source data: (1) from two-level categorical data (e.g. urban vs. rural classes), Hedges’ g (i.e.
the unbiased standardised mean difference) was calculated based on the mean, standard deviation and sample size (number of study sites) of species richness and abundance of urban and rural areas. This was then transformed to Pearson’s correlation coefficient; (2) from continuous urbanisation gradients, Pearson’s r was calculated from t, F or χ2 data; (3) from three-level categorical data (e.g. urban-suburban-rural classes), Hedges’ g was calculated for urban-suburban and suburban-rural data separately, then these were transformed to Pearson’s r (Lajeunesse, 2013). Then we computed the combined urban-suburban and suburban-rural effect sizes considering multiple comparisons within a study (Borenstein et al., 2009); (4) if studies did not provide data for the whole community (e.g. overall abundance), but they provided data separately for traits (e.g. abundance presented only for feeding groups and not for all species), we first calculated effect sizes for the separate traits, then combined them in
one Pearson’s r considering multiple outcomes within a study (Borenstein et al., 2009), and finally we corrected these effect sizes by weighting them based on the relative abundance of the feeding groups. All Pearson’s r values were transformed to Fisher’s z for all analyses, but were back-transformed for data visualization, since the interpretation of Pearson’s r is more straightforward. A negative effect size indicated a decrease in species richness or abundance from rural to urban areas.
Meta-analysis
We performed hierarchical meta-analyses separately for species richness and abundance, which allowed the specification of nesting factors. Then we performed mixed effects models with fixed effects (see moderators, i.e. predictor variables, below) and random effects to account for differences across studies, assuming that they do not share a common mean effect, but that there is random variation among studies, in addition to within-study sampling
variation (Borenstein et al., 2009; Harrison, 2011). The models also took into account the hierarchical dependence in our data due to cases where multiple observations (i.e. effect sizes) were obtained from the same study. Having several effect sizes from the same publication violates the assumption that effect sizes are independent (Rossetti et al., 2017). Therefore, we included a publication-level random effect as a nesting factor to incorporate this dependency of multiple outcomes within study observations (see Appendix S2 for model codes).
Additionally, we also considered the geographic dependencies of the studies by including continent as the first nesting factor in all models.
First, we performed random effects summary meta-analyses to calculate the overall mean effect size for all species richness data and all abundance data separately (Appendix S2). This provided a general measure of the overall effect of urbanisation, which implicitly assumes a linear relationship. Given that more than 80% of papers reported a simple measure of species richness (number of species observed), rather than using richness estimates
adjusted for sampling effort or abundance (e.g. rarefaction), we used this metric in the analysis. When type of index (simple or adjusted richness) was included as a factorial moderator, there was no significant moderation effect (Qm= 2.875; p= 0.090). The output of each statistical test consisted of the mean effect size for the analysis with accompanying 95%
Cis, and a total heterogeneity statistic (Q). The heterogeneity statistic is a weighted sum of squares and is tested against a χ2 distribution with d.f. = n-1. Estimates of the effect size were considered to be significantly different from zero if their 95% CIs did not include zero (Borenstein et al., 2009).
Second, we performed categorical meta-analyses using gradient length (short or long) and inclusion of urban green spaces in the sample for a given study (referred to as park or non-park) as moderators (Appendix S2). The total heterogeneity in categorical meta-analysis can be partitioned into variance explained by the categorical factor in the model (between- group heterogeneity) and residual error variance (within-group heterogeneity) with χ2 tests indicating their significance. A significant between-group heterogeneity indicated that species richness or abundance responses to urbanisation differed based on gradient length or inclusion of green spaces. Additionally, we performed meta-regressions using city size as a continuous moderator (city size was measured as population size and was log-transformed to achieve a normal distribution and hence a better model fit). There was no relationship between city size and gradient length (two sample t-test for species richness: t = -1.42, df =26, p = 0.167; for abundance: t = 1.38, df =15, p = 0.187). We did not include season in which species richness was measured as moderator as the majority of studies were carried out in the breeding season.
Third, to assess potential non-linear responses in species richness and abundance along the urbanisation gradient, we performed subset analyses for urban-suburban, suburban-rural and suburban-natural comparisons using studies that considered the four categories: urban, suburban, rural and natural, and provided data for at least one of the comparisons. This
enabled us to calculate effect sizes (Fisher’s z transformed to Pearson’s correlation
coefficient) for urban-suburban, suburban-rural and suburban-natural comparisons. Here, we often analysed dyads of urban-suburban, suburban-rural and suburban-natural comparisons together, which meant that suburban categories were included in many studies twice. To account for the non-independence of multiple treatments with a common control (Borenstein et al., 2009), we included the dyad containing the corresponding urban-suburban and
suburban-rural, or urban-suburban and suburban-natural, comparisons as a nesting factor (Tables S4-5; Appendix S2).
Publication bias
Studies finding a significant effect may be more likely to be published than studies finding no effects, which can bias the outcome of meta-analyses. We therefore explored the possibility of publication bias graphically (funnel plots) and statistically (regression test; Rothstein et al., 2005). The regression test for funnel plot asymmetry examines the relationship between the standardised effect size and sample size across the studies. A significant P value may indicate publication bias, whereby studies with small sample size are only published if they show large effect sizes. All analyses were performed with the metafor package (Viechtbauer, 2010) in R (R Development Core Team, 2015).
Results
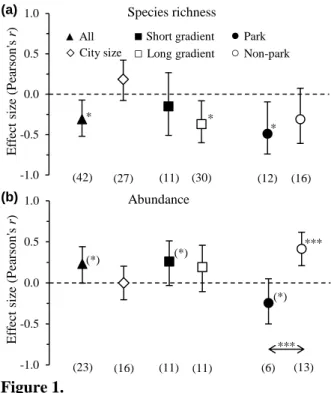
In the summary meta-analysis of all data, we found a significant overall negative effect of urbanisation on bird species richness, showing that in general species richness was
consistently lower towards more urbanised landscapes (Table 1, Fig. 1a). Bird abundance increased with urbanisation with a small, marginally significant effect (Fig. 1b).
Including city size as a moderator, we found only a small, positive, non-significant moderation effect of urbanisation on bird richness (Table 1, Fig. 1a). For abundance, there was no marked moderation effect of city size at all (Fig. 1b). When we analysed the potential effect of gradient length, we found stronger negative effects in long than in short gradients on species richness (although this between-group heterogeneity was not significant as shown in Table 1). Additionally, for the short gradient, the effect was not significantly different from zero (Fig. 1a). For bird abundance, there was a small, marginally significant, positive effect in short gradients and no effect in long gradients, but there was no significant difference
between the two gradient lengths (Table 1, Fig. 1b). Finally, studies including green spaces showed a large and significantly negative urbanisation effect on species richness in contrast to studies not including them, but their effect sizes did not differ from each other (Table 1, Fig.
1a). However, in the case of abundance, the urbanisation effects in ‘parks vs. non-parks’
showed a strong contrast, with significant positive effects in the absence of green spaces and marginal negative effects when green spaces were present (Fig. 1b).
When considering urban-suburban vs. suburban-rural or suburban-natural contrasts, bird species richness showed that urbanisation had a large negative effect from suburban to urban areas, a less strong, but still significant decrease from natural to suburban areas, but no change from rural to suburban areas (Table 2, Fig. 2a,b). Additionally, effect sizes of urban-suburban vs. suburban-rural comparisons, and also urban-suburban vs. suburban-natural comparisons, differed from each other significantly. For abundance, we found that bird numbers increased with a small effect from natural to suburban areas, and with a large effect from rural to suburban areas, but then decreased with a small effect from suburban to urban areas (Fig. 2 c,d). Finally, these two pairs of effect sizes (urban-suburban vs. suburban-rural and urban- suburban vs. suburban-natural) also differed from each other significantly. These results therefore demonstrate a non-linear, intensifying decrease in species richness along the
gradient from natural to urban areas, with a steady state from rural to suburban areas followed by a strong decrease toward urban areas (Fig. 2b). Finally, we observed a non-linear, hump-
shaped pattern in abundance along the gradient with the highest values being in suburban areas, and a marked increase from rural to suburban areas (Fig. 2d). Natural areas had similar, though slightly lower, abundance compared to suburban areas.
None of the funnel plots of effect size vs. standard error of mean showed strong skewness (Fig. S3), indicating no initial evidence of publication bias in our dataset.
Regression tests did not show significant relationships between effect sizes and sample sizes (species richness: z = 1.76, P = 0.078; abundance: z = 0.16, P = 0.866). Therefore, there was no evidence of publication bias.
Discussion
Our meta-analysis of urbanisation effects showed opposing general trends between bird species richness and abundance, richness decreasing and abundance increasing with
increasing urbanisation, although effect size and significance level were lower for the latter.
When considering urban-suburban-rural/natural contrasts, the overall richness trend was confirmed in that there was an increasing trend from urban to natural landscapes. However, abundance showed a clear intermediate peak along the urban-rural gradient, although abundance in natural areas was markedly higher than that in rural areas.
The overall effect sizes indicated that urbanisation affects species diversity (as
measured by species richness) negatively, but has a positive effect on bird abundance, which confirms the general finding that overall abundance and biomass of birds typically increases with increasing urbanisation as the number of species declines, with just a few species
contributing to the majority of individuals (e.g. Blair, 2004; Cam et al., 2000, Chace & Walsh, 2006; Clergeau et al., 2006), although these effects were relatively weak. When accounting for potential non-linearities by assessing urban-suburban, suburban-rural and suburban- natural contrasts, the pattern of decline in species richness with increasing urbanisation was still evident and stronger when natural landscapes were considered. These results therefore support a more-or-less constant negative impact of urbanisation on bird diversity (as per, for example, Clergeau et al., 2001, 2006; Sandström et al., 2006), rather than a peak at
intermediate levels of the gradient, which has been commonly assumed (e.g. Marzluff, 2017).
In contrast to other studies, however, there was evidence of an intermediate peak in abundance in relation to the urban-rural gradient. This suggests that suburban habitats as defined in this study, whilst supporting fewer species than natural areas and similar number of species as rural areas, can support a greater abundance of individuals of those species that can exploit this habitat. There are a number of reasons that may underpin this pattern, which could include greater energy availability (e.g. through bird feeding – Robb et al., 2008) or reduced competition or predation (Alberti, 2015). However, considering the whole gradient from urban to natural habitats (rather than being restricted to the typical urban-rural gradient), it is evident that abundance in suburban areas is similar to that in natural areas, whereas it is markedly lower in rural areas (Fig. 2). Given that most rural areas comprise low density housing within an agricultural matrix, this pattern may also be related to negative impacts of farming practices on bird communities (e.g. Chamberlain et al. 2000).
Whilst there have been several reviews of bird community composition along urbanisation gradients, there are very few which have taken a quantitative meta-analytical approach (Saari et al., 2015), and assumptions about consistent patterns seem to be based more on qualitative assessments (e.g. Chace & Walsh, 2006; Grimm et al., 2008). Indeed, Saari et al. (2015), in a multi-taxa meta-analysis of terrestrial animals based on 26 studies, found weak evidence of negative effects of urbanisation on species richness, and no evidence of consistent responses of abundance. Clergeau et al. (2001) did find evidence of negative effects of urbanisation on bird species richness in a meta-analysis of 18 studies, but they did not consider abundance. Our meta-analysis provides further support to the negative effects of urbanisation on bird species richness with a much larger sample size (37 studies) using robust
statistical techniques, but it also is the first to provide evidence of a non-linear response of bird abundance to an urbanisation gradient.
There was no evidence that city size played a role in influencing the relationship between urbanisation and either species richness or abundance. Whilst other studies have found relationships between city size and either species richness or abundance (Garaffa et al., 2009; Gagné et al., 2016), Clergeau et al. (2001) also did not find any association between bird species richness and human population size, nor urban extent or the bird diversity of adjacent rural habitats. To some extent, these differences may have arisen due to the nature of the sample of cities. Both Garaffa et al. (2009) and Gagné et al. (2016) considered a sample from more restricted geographical areas than our study and that of Clergeau et al. (2001), thus there may have been less influence of large scale biogeographic factors. However, Clergeau et al. (2001) also found that more fine-scaled habitat variables were better determinants of bird communities than landscape-level metrics. Similarly, Evans et al. (2009) concluded based on a literature review that in general, local factors are more important than regional factors in influencing bird communities. Further quantification of finer-scale, local habitat composition would be useful in this respect, although such detailed information is currently available in too few studies to undertake the meta-analysis carried out here.
The effect of urbanisation on species differed between different gradient types. The overall negative effect on species richness was especially clear (i.e. strong, negative
significant effect) in studies that examined the whole urban to rural gradient, while there was no significant effect in studies which compared two urbanisation categories only. In contrast, there was little evidence that the effect of urbanisation on abundance was influenced by gradient length.
There was a decrease in abundance with increasing urbanization in studies where green spaces were included in the sampled landscapes, and an increase in abundance where they were absent. It is possible that generalist and opportunistic species well adapted to urban environments, and thus occurring in high numbers in several cities, could increase their population numbers in heavily developed land-uses (e.g., residential, commercial, industrial) more than in landscapes including green space (Carbó-Ramírez & Zuria, 2011). There was evidence that bird species richness was more negatively impacted by urbanisation when green spaces were present. Given that parks have generally been assumed to be of benefit to urban biodiversity (e.g. Nielsen et al., 2014), this result is unexpected. Urban parks are thought to contain most species occurring in cities, but this in itself may be why they might experience a more expressed negative effect of urbanisation in contrast to the urban matrix (Fernández- Juricic & Jokimäki, 2001), i.e. urbanisation effects in species rich areas which include green spaces may be more evident than urbanisation effects where species richness is already low.
Additionally, it should be stressed that these analyses did not test species richness in green spaces per se against species richness in the urban matrix. Rather, the comparison was between studies which included green spaces within the sampled landscape and those that did not. Furthermore, a range of public green spaces were included (mostly parks, but also
‘recreation areas’, golf courses and urban woodlands), hence our analyses covers a wide range of green space types. Given these factors, it is not really possible to draw firm conclusions on the value of green space for bird diversity based on these results. Nevertheless, our findings suggest that the value of green spaces to urban bird diversity may be influenced by landscape context. Further dedicated studies are needed to assess the role of urban green spaces on wider avian communities across urban-rural gradients.
The majority of the papers analysed did not consider separate groups of species (e.g.
defined on the basis of taxonomic relatedness or ecological requirements), but rather used fairly simple measures of species richness and abundance of the whole community. However, bird species vary greatly in the extent to which they exploit urban habitats (e.g. Evans et al., 2010, Sol et al., 2014). In particular, urban habitats often have a higher species richness
and/or greater abundance of non-native species (e.g. Sol et al., 2012). The extent to which native and non-native species may have responded differently to the gradients analysed here is impossible to assess (only four papers considered native and exotic species separately), but future gradient studies should invest more effort in measuring responses of different species, especially non-native species.
Biodiversity studies on urban-rural gradients typically use land use classifications (i.e.
urban, suburban, rural) to assess responses to urbanization, as for the vast majority of studies considered in this paper. This does, however, have some drawbacks. First, category
definitions may differ widely from study to study. We have attempted to account for these differences by taking our own (admittedly broad) definitions of land use categories and re- classifying where necessary. In most cases, descriptions were sufficient to achieve this, even when no quantitative information was presented. Second, comparing categories, rather than assessing responses to a continuous gradient, may restrict the ability to detect more subtle non-linear patterns along the length of the gradient, and importantly may be limited in terms of planning urban development where threshold effects of urbanization on bird communities could be identified. Despite our relatively simple classification, it is nonetheless notable that we did detect non-linear effects. Nevertheless, future studies should seek to measure
urbanization using clearly defined and continuous measures, or at the very least should provide full quantitative descriptions of any defined land use categories.
Urbanisation affects bird species diversity. Though species loss is more marked from suburban to urban than from rural to suburban areas, our results nonetheless suggest that urbanisation exerts a consistent more-or-less negative linear effect on bird species richness.
Previous reviews have found that the universality of richness and abundance responses is unclear (Saari et al. 2015). Here, in the most comprehensive quantitative review of birds yet, we find linear responses for richness (which have been less commonly found in literature) and non-linear responses for abundance (which are previously unreported). By examining the whole urban to rural gradient (i.e. long gradients), patterns in species richness are likely to be detected, although this is unclear for bird abundance. Non-linear response of bird
communities to urbanisation should be accounted for in the future, preferably by adopting a universally accepted definition of urbanization measured along continuous axes, thus enabling a more precise estimate of its effects, for example to identify threshold values where
communities change in order to improve conservation planning for urban development.
Acknowledgements
PB was supported by the German Research Foundation (DFG BA 4438/2-1) and by the Economic Development and Innovation Operational Programme of Hungary (GINOP–2.3.2–
15–2016–00019). KK was supported by the Austrian Agency for International Cooperation in Education and Research and by the Szentágothai Talent Program, financed by the
Szentágothai Research Centre, University of Pécs.
References
Alberti, M. (2015) Eco-evolutionary dynamics in an urbanizing planet. Trends in Ecology &
Evolution, 30, 114-126.
Aronson, M. F. J., La Sorte, F. A., Nilon, C. H., Katti, M., Goddard, M. A., Lepczyk, C. A.,
… Winter, M. (2014). A global analysis of the impacts of urbanization on bird and plant diversity reveals key anthropogenic drivers. Proceedings of the Royal Society of London B, 281, 20133330.
Bettencourt, L. M. A., & West, G. (2010). A unified theory of urban living. Nature, 467, 912–
913.
Blair, R. B. (1996). Land use and avian species diversity along an urban gradient. Ecological Applications, 6, 506–519.
Blair, R. (2004). The effects of urban sprawl on birds at multiple levels of biological organization. Ecology and Society, 9, 2.
Borenstein, M., Hedges, L. V., Higgins, J. P. T., & Rothstein, H. R. (2009). Introduction to meta-analysis, 1st edn. Chichester: Wiley. 421 pp.
Cam, E., Nichols, J. D., Sauer, J. R., Hines, J. E., & Flather, C. H. (2000). Relative species richness and community completeness: birds and urbanization in the Mid-Atlantic States. Ecological Applications, 10, 1196–1210.
Carbó-Ramírez, P., & Zuria, I. (2011). The value of small urban greenspaces for birds in a Mexican city. Landscape and Urban Planning, 100, 213–222.
Chace, J. F., & Walsh, J. J. (2006). Urban effects on native avifauna: a review. Landscape and Urban Planning, 74, 46-69.
Chamberlain, D. E., Fuller, R. J., Bunce, R. G. H., Duckworth, J. C., & Shrubb, M. (2000).
Changes in the abundance of farmland birds in relation to the timing of agricultural intensification in England and Wales. Journal of Applied Ecology, 37, 771–788.
Chamberlain, D., Kibuule, M., Skeen, R., & Pomeroy, D. (2017) Trends in bird species richness, abundance and biomass along a tropical urbanization gradient. Urban Ecosystems, in press. doi: 10.1007/s11252-016-0621-6
Clergeau, P., Savard, J. P., Mennechez, G., & Falardeau, G. (1998). Bird abundance and diversity along an urban-rural gradient: a comparative study between two cities on different continents. Condor, 100, 413–425.
Clergeau, P., Jokimäki, J., & Savard, J. P. (2001). Are urban bird communities influenced by the bird diversity of adjacent landscapes? Journal of Applied Ecology, 38, 1122–1134.
Clergeau, P., Croci, S., Jokimäki, J., Kaisanlahti-Jokimäki, M. L., & Dinetti, M. (2006).
Avifauna homogenisation by urbanisation: analysis at different European latitudes.
Biological Conservation, 127, 336–344.
Cohen, B. (2006). Urbanization in developing countries: current trends, future projections, and key challenges for sustainability. Technology in Society, 28, 63–80.
Cooper, H., Hedges, L.V., Valentine, J.C. (2009). The handbook of research synthesis and meta-analysis. 2nd edn. New York: Russell Sage Foundation. 632 pp.
Evans, K. E., Newson, S. J., & Gaston, K. J. (2009). Habitat influences on urban avian assemblages. Ibis, 151, 19–39.
Faeth, S. H., Bang, C., & Saari, S. (2011). Urban biodiversity: patterns and mechanisms.
Annals of the New York Academy of Sciences, 1223, 69–81.
Fernández-Juricic, E. & Jokimäki, J. (2001). A habitat island approach to conserving birds in urban landscapes: Case studies from southern and northern Europe. Biodiversity and Conservation, 10, 2023–2043.
Gagné, S. A., Sherman, P. J., Singh, K. K., & Meetemeyer, R. K. (2016). The effect of human population size on the breeding bird diversity of urban regions. Biodiversity and
Conservation, 25, 653–671.
Garaffa, P. I., Filloy, J., & Bellocq, M. I. (2009). Bird community responses along urban–
rural gradients: does the size of the urbanized area matter? Landscape and Urban Planning, 90, 33–41.
Grimm, N. B., Faeth, S. H., Golubiewski, N. E., Redman, C. L., Wu, J., Bai, X., & Briggs, J.
M. (2008). Global change and the ecology of cities. Science, 319, 756–760.
Gurevitch, J., Curtis, P. S., & Jones, M. H. (2001). Meta-analysis in ecology. Advances in Ecological Research, 32, 199-247.
Gurevitch, J., Morrow, L. L., Wallace, A., & Walsh, J. S. (1992). A meta-analysis of competition in field experiments. American Naturalist, 140, 539–572.
Harrison, F. (2011). Getting started with meta-analysis. Methods in Ecology and Evolution, 2, 1–10.
Hedges, L. V., & Olkin, I. (1985). Statistical methods for meta-analysis. 1st edn. San Diego:
Academic Press. 369 pp.
Higgins, J., & Green, S. (2008). Cochrane handbook for systematic reviews of interventions.
1st edn. Chichester: Wiley. 649 pp.
Jokimäki, J., Clergeau, P., & Kaisanlahti-Jokimäki, M. L. (2002). Winter bird communities in urban habitats: a comparative study between central and northern Europe. Journal of Biogeography, 29, 69–79.
Kelcey, J. G., & Rheinwald, G. (2005). Birds in European cities. St. Katharinen: Ginster Verlag. 450 pp.
Lajeunesse, M. J. (2013). Recovering missing or partial data from studies: a survey of conversions & imputations for meta-analysis. In J. Koricheva, J. Gurevich, & K.
Mengersen (Eds.), Handbook of meta-analysis in ecology and evolution (pp. 195–206).
Princeton: Princeton University Press.
Marzluff, J. M. (2001). Worldwide urbanization and its effects on birds. In J. M. Marzluff, R.
Bowman, & R. Donelly (Eds.), Avian Ecology and Conservation in an Urbanizing World (pp. 19–48). New York: Kluwer.
Marzluff, J. M. (2017). A decadal review of urban ornithology and a prospectus for the future.
Ibis, 159, 1–13.
McIntyre, N. E., Knowles-Yánez, K., & Hope, D. (2000). Urban ecology as an
interdisciplinary field: differences in the use of “urban” between the social and natural sciences. Urban Ecosystems, 4, 5–24.
McKinney, M. L. (2002). Urbanization, biodiversity, and conservation. Bioscience, 52, 883–
890.
Mendeley (2015). Mendeley Reference Manager. Version 1.15.2. London: Mendeley Ltd.
URL: http://www.mendeley.com
Nielsen, AB, van den Bosch M., Maruthaveeran S., van den Bosch CK (2014). Species richness in urban parks and its drivers: A review of empirical evidence. Urban Ecosystems, 17, 305–327.
Njorge, J. B., NdaNg’ang’a, P. K., & Natuhara, Y. (2014). The pattern of distribution and diversity of avifauna over an urbanizing tropical landscape. Urban Ecosystems, 17, 61–
75.
R Development Core Team (2015). R: A Language and Environment for Statistical Computing. Version 3.2.3. Vienna: R Foundation for Statistical Computing. URL:
http://www.R-project.org
Rebele, F. (1994). Urban ecology and special features of urban ecosystems. Global Ecology and Biogeography Letters, 4, 173–187.
Robb, G. N., MacDonald, R. A., Chamberlain, D. E., & Bearhop, S. (2008). Food for thought:
supplementary feeding as a driver of ecological change in avian populations. Frontiers in Ecology and the Environment, 6, 476–484.
Rossetti, M. R., Tscharntke, T., Aguilar, R., & Batáry, P. (2017). Responses of insect
herbivores and herbivory to habitat fragmentation: a hierarchical meta-analysis. Ecology Letters, 20, 264–272.
Rothstein, H. R., Sutton, A. J., & Borenstein, M. (2005). Publication bias in meta-analysis.
1st edn. Chichester: Wiley. 356 pp.
Saari, S., Richter, S., Higgins, M., Oberhofer, M., Jennings, A., & Faeth, S. H. (2016).
Urbanization is not associated with increased abundance or decreased richness of terrestrial animals – dissecting the literature through meta-analysis. Urban Ecosystems, 19, 1251–1264.
Sandström, U. G., Angelstam, P., & Mikusinski, G. (2006). Ecological diversity of birds in relation to the structure of urban greenspace. Landscape and Urban Planning, 77, 39–
53.
Seto, K. C., Parnell, S., & Elmqvist, T. (2013). A global outlook on urbanization. In T.
Elmqvist, M. Fragkias, J. Goodness, B. Güneralp, P. J. Marcotullio, R. I. McDonald, … C. Wilkinson (Eds.), Urbanization, biodiversity and ecosystem services: challenges and opportunities (pp. 1–12). Dordrecht: Springer.
Sol, D., Bartomeus, I., & Griffin, A. S. (2012). The paradox of invasion in birds: competitive superiority or ecological opportunism? Oecologia, 169, 553–564.
Sol, D., González-Lagos, C., Moreira, D., Maspons, J., & Lapiedra, O. (2014). Urbanization tolerance and the loss of avian diversity. Ecology Letters, 17, 942–950.
Stewart, G. (2010). Meta-analysis in applied ecology. Biology Letters, 6, 78–81.
Tratalos, J., Fuller, R. A., Evans, K. L., Davies, R. G., Newson, S. E., Greenwood, J. J. D., &
Gaston, K. J. (2007). Bird densities are associated with household densities. Global Change Biology, 13, 1685–1695.
Viechtbauer, W. (2010). Conducting meta-analyses in R with the metafor package. Journal of Statistical Software, 36, 1–48.
Table 1. Summary table of meta-analyses showing total heterogeneity (‘all’, only effects of urbanisation without moderators), and heterogeneities explained by moderators (city size [continuous gradient on log scale], gradient length [short vs. long] and green space [‘park’, yes vs. no]) with corresponding residual heterogeneities.
d.f. Q P
Species richness
all 41 1901.95 <0.001
city size 1 1.92 0.166
residual 26 298.88 <0.001
gradient length 1 1.10 0.295
residual 39 1899.58 <0.001
park 1 0.80 0.371
residual 26 317.07 <0.001
Abundance
all 22 308.62 <0.001
city size 1 <0.01 0.994
residual 15 133.18 <0.001
gradient length 1 0.15 0.697
residual 20 307.68 <0.001
park 1 12.88 <0.001
residual 17 208.83 <0.001
Table 2. Summary table of subset meta-analyses showing tests of moderators (between-group heterogeneities; groups: urban-suburban, suburban-rural and suburban-natural comparisons) with residual heterogeneities.
d.f. Q P Species richness
between-group 2 66.67 <0.001 residual 26 188.43 <0.001 Abundance
between-group 2 59.25 <0.001 residual 18 173.49 <0.001
FIGURE CAPTIONS
Figure 1. The effects of urbanisation on (a) species richness and (b) abundance of birds depending on city size (continuous gradient on log scale), gradient length (short vs. long) and green spaces (‘Park’, yes vs. no). Mean effect sizes and 95% CIs are shown. Numbers under symbols indicate sample size. Asterisks ((*)P < 0.1; *P < 0.05; **P < 0.01; ***P < 0.001) above effect size symbols denote a significant difference from zero (within-group
heterogeneity), whereas one above a horizontal arrow indicates a significant difference between park and non-park studies (Table 1). The effects of urbanisation on (a) species richness and (b) abundance of birds depending on city size (continuous gradient on log scale), gradient length (short vs. long) and green spaces (‘Park’, yes vs. no). Mean effect sizes and 95% CIs are shown. Numbers under symbols indicate sample size. Asterisks ((*)P < 0.1; *P <
0.05; **P < 0.01; ***P < 0.001) above effect size symbols denote a significant difference from zero (within-group heterogeneity), whereas one above a horizontal arrow indicates a significant difference between park and non-park studies (Table 1).
Figure 2. Effects of urbanisation on (a) species richness and (c) abundance of birds for urban- suburban vs. suburban-rural and urban-suburban vs. suburban-natural comparisons and barplots (b, d) presenting relative change compared to suburban areas set to 100 %. For figures a and c, values shown represent effect size estimates and 95% CIs, and numbers under symbols represent sample size. Asterisks ((*)P < 0.1; *P < 0.05; **P < 0.01; ***P < 0.001) above effect size symbols denote a significant difference from zero (within-group
heterogeneity), whereas those above a horizontal arrow indicate a significant difference between urban-suburban and suburban-rural and urban-suburban vs. suburban-natural comparisons (Table 2). Barplots are based on individual effects (Pearson’s r) corresponding to the slope of simple regressions. urb: urban, sub: suburban, rur: rural and nat: natural areas.
SUPPORTING INFORMATION
Appendix S1 References of studies included in meta-analyses Appendix S2 Details of meta-analysis models
Figure S1 PRISMA flow diagram of the literature screening process
Figure S2 Illustration of classification of short and long urbanisation gradients Figure S3 Funnel plots
Table S1-S2 Lists of observations/studies included in meta-analyses Table S3 Excluded papers and reasons for exclusions
Table S4-S5 Lists of observations/studies included in subset meta-analyses on non-linear responses
Figure 1.
-1.0 -0.5 0.0 0.5 1.0
Effect size(Pearson'sr)
Species richness Park Non-park Short gradient
Long gradient All
City size
(42) (11) (30) (12) (16)
* *
* (a)
(27)
-1.0 -0.5 0.0 0.5 1.0
Effect size(Pearson's r)
Abundance
(23) (11) (11) (6) (13)
(*)
(*) (b)
(*) ***
***
(16)
Figure 2.
-1.0 -0.5 0.0 0.5 1.0
Effect size(Pearson's r)
Species richness Urban-Suburban Suburban-Rural Suburban-Natural (a)
(10) (10)
***
***
(9)
**
* 0
25 50 75 100 125 150
% change to suburban
Species richness (b)
urb sub rur/nat
-1.0 -0.5 0.0 0.5 1.0
Effect size (Pearson's r)
Abundance (c)
(8) (6)
***
***
(7)
** 0
20 40 60 80 100 120
% change to suburban
Abundance (d)
urb sub rur/nat
![Table 1. Summary table of meta-analyses showing total heterogeneity (‘all’, only effects of urbanisation without moderators), and heterogeneities explained by moderators (city size [continuous gradient on log scale], gradient length [short vs](https://thumb-eu.123doks.com/thumbv2/9dokorg/1386563.114794/14.892.106.470.193.510/summary-heterogeneity-urbanisation-moderators-heterogeneities-explained-moderators-continuous.webp)