Autonomous sound recording outperforms human observation for sampling birds: a 1
systematic map and user guide 2
Running title: Autonomous sound recording vs. human observation 3
4
Authors: Kevin Darras1*, Péter Batáry1,2, Brett Furnas3, Ingo Grass1, Yeni A Mulyani4, Teja 5
Tscharntke1 6
*: corresponding author 7
8
1 Department of Crop Sciences, Agroecology, University of Goettingen, Grisebachstr. 6, 37077 9
Göttingen, Germany 10
2MTA Lendület Landscape and Conservation Ecology Research Group, Alkotmány u. 2-4, 2163 11
Vácrátót, Hungary 12
3Wildlife Investigations Laboratory, California Department of Fish and Wildlife, 1701 Nimbus 13
Road, Suite D, Sacramento, California, 95670, USA 14
4Department of Forest Resources Conservation and Ecotourism, Faculty of Forestry, Bogor 15
Agricultural University, Bogor, Indonesia 16
email addresses: kdarras@gwdg.de, pbatary@gmail.com, brett.furnas@wildlife.ca.gov, 17
yamulyani@gmail.com, igrass@gwdg.de, ttschar@gwdg.de 18
19
Abstract 20
Autonomous sound recording techniques have gained considerable traction in the last decade, 21
but the question remains whether they can replace human observation surveys to sample sonant 22
animals. For birds in particular, survey methods have been tested extensively using point counts 23
and sound recording surveys. Here, we review the latest evidence for this taxon within the frame 24
of a systematic map. We compare sampling effectiveness of these two survey methods, the 25
output they produce, and their practicality. When assessed against the standard of point counts, 26
autonomous sound recording prove to be a powerful tool that samples just as many species. This 27
technology can monitor birds in an exhaustive, standardized and verifiable way. Moreover, 28
sound recorders give access to entire soundscapes from which new data types can be derived 29
(vocal activity, acoustic indices…). Variables such as abundance or detection distance can be 30
obtained to yield data sets that are comparable to and compatible with point counts. Finally, 31
autonomous sound recorders allow investigations at high temporal and spatial resolution and 32
coverage, which are more cost-effective and cannot be achieved by human observations alone, 33
even though small-scale studies might be more cost-effective when carried out with point counts.
34
Sound recorders can be deployed in many places, they are more scalable, and reliable, making 35
them the better choice for bird surveys in an increasingly data-driven time. We also provide an 36
overview of currently available recorders and discuss their specifications to guide future study 37
designs.
38 39
Key-words: acoustic recording, point count, microphone, sound recorders, passive acoustic 40
monitoring, autonomous recording units 41
Introduction
42
In the face of the current threats to global biodiversity, ecologists strive to devise efficient survey 43
methods to measure our vanishing, under-sampled biodiversity. We need more extensive 44
sampling coverage on temporal and spatial scales to detect trends across regions and with time 45
(Magurran et al. 2010, Ahumada et al. 2011). We need to sample animals thoroughly to detect 46
species at risk, implement conservation strategies, and monitor their results. Material and 47
personal resources must be deployed with greater efficiency. To enable international cooperation 48
and re-use of data (Wilkinson et al. 2016), a minimal bias should be attained with standardized, 49
comparable, and repeatable sampling methods.
50
Vertebrates pose a particular challenge for sampling because they are mobile, often evading 51
detection (Thompson et al. 1998). Many vertebrates are usually surveyed by direct human 52
observation methods (e.g. point counts, transect surveys) because capture methods are inherently 53
more intrusive and effort-demanding. Human observers rely on aural and visual detection to 54
count animals and identify species, but given that some insects (e.g. cicadas and orthopterans) 55
and most terrestrial vertebrates (birds, amphibians, mammals, some reptiles) commonly use 56
sound, passive acoustic monitoring methods have recently gained more users (Shonfield and 57
Bayne 2017).
58
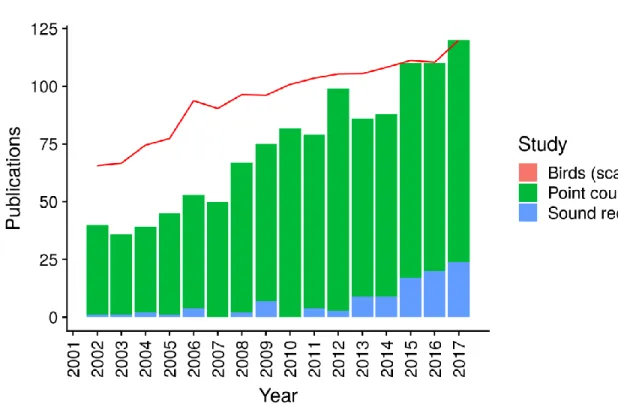
For birds in particular, passive acoustic sampling methods have been used extensively and 59
increasingly (Fig. 1). Many different autonomous sound recorders (Merchant et al. 2015, 60
Whytock and Christie 2016) and software solutions for automatic species classification have 61
been developed (Priyadarshani et al. 2018). However, human observation survey methods are 62
still the standard, most widely-used method (Bibby et al. 2000). Although some research has 63
compared acoustic methods with these traditional survey methods, results were controversial as 64
some studies showed that acoustic surveys detect more bird species than point counts 65
(Haselmayer and Quinn 2000), whereas other studies concluded the opposite (Hutto and 66
Stutzman 2009). A recent meta-analysis found no detectable difference between both methods in 67
terms of alpha and gamma species richness (Darras et al., 2018).
68
Still, many other points are yet to be discussed to determine how autonomous sound recorders 69
match up agaisnt traditional human observation. Bird studies provide ample material for an 70
interesting methodological comparison using a systematic map, which is an overview of the 71
available evidence in relation to a topic of interest (James et al. 2016). Indeed, a qualitative 72
review (Shonfield and Bayne 2017) and a commentary discussing applications and challenges of 73
acoustic data collection in the tropics (Deichmann et al., 2018) have been published recently, and 74
an appraisal of passive acoustic monitoring has exposed the opportunities and challenges that the 75
technology presents 76
77 . 78
In the present study, we provide a more comprehensive evaluation of autonomous sound 79
recorders, starting with the comparison with point counts in avian diversity research. We use a 80
systematic map of studies that surveyed birds with both survey methods paired, anddiscuss the 81
inherent advantages of either method using additional references. We focus on their sampling 82
effectiveness, their output variables, and practicality aspects. We provide a table summarizing 83
pros and cons succinctly to help design future studies and present different cost scenarios. We 84
also show the latest results of our previously published meta-analysis, including three more 85
studies, linking to a figure that will be updated as the literature body grows. Additionally, we 86
present a guide of currently available autonomous sound recorders for prospective users, also 87
linking to a comparison table that will be updated as new autonomous sound recorders are 88
launched. We finally give perspectives and identify challenges and remaining knowledge gaps 89
for realising the potential of autonomous sound recorders.
90
Systematic Map
91
Data collection 92
We conducted a systematic map, which is an overview of the available evidence in relation to a 93
topic of interest (James et al., 2016). We aimed for an unbiased comparison of bird sampling 94
methods based on autonomous sound recordings versus those based on direct human 95
observation. However, publications about bird surveys are too numerous to review, and most 96
survey methods used with autonomous sound recorders and human observers are not equivalent, 97
so that separate literature searches on both topics would not be effective for our systematic map.
98
Thus, we decided to search only for publications where comparable sampling methods were used 99
for both humans and sound recorders for our quantitative analyses. However, we complemented 100
this comparison with additional relevant articles to discuss more broadly how human observers 101
perform against autonomous sound recording.
102
Mobile autonomous sound recording devices have not been developed yet for terrestrial habitats, 103
consequently, the majority of studies comparing human to recorder-based surveys directly did 104
point counts (but see Wimmer et al., 2012), where observers stay in one point – rather than 105
transects where human samplers are moving. Point counts are written records of the birds 106
detected aurally and visually by a human observer from a fixed position during a specified 107
duration. Similarly, sound recorders can generate audio records of birds recorded from a fixed 108
position during a specified time, which are then processed to obtain written records of the bird 109
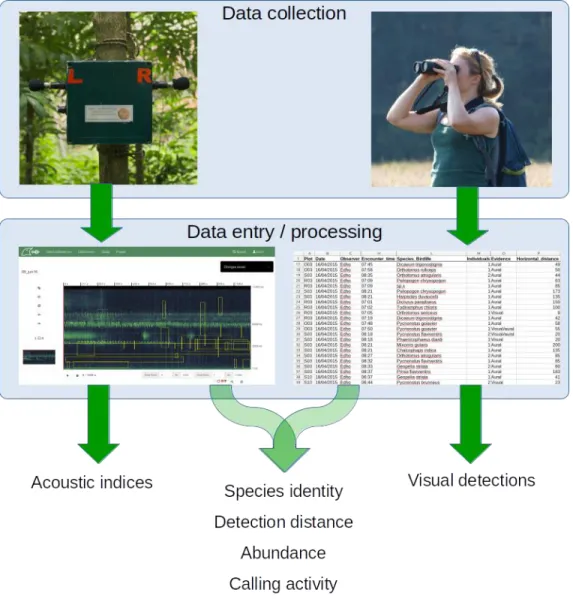
detections. Both of these bird sampling methods yield bird detections data, which are a record of 110
the number and species of birds detected in a particular site and time (Figure 2). These data can 111
be used to derive occupancy, density and abundance, species richness, and activity of birds.
112
We searched for studies comparing point counts to sound recorders and reviewed them.
113
Scientific publications were retrieved on February 5, 2019, using the following search string 114
combination in ISI Web of Science Core Collection (Citation Indexes) covering all years:
115
TS=((bird* OR avian OR avifaun*) AND ("sound record*" OR "acoustic record*" OR 116
"automated record*" OR "acoustic monitor*" OR "recording system*") AND ("point count*"
117
OR "bird count*" OR "point survey*" OR "point-count*" OR “point transect*”)). We used the 118
following search string for Google Scholar: “point count” AND “sound recording”, sorted by 119
relevance, checking all search results.
120
We screened all articles to determine the relevance of each study for the systematic map. Only 121
peer-reviewed references in English were considered. Studies that discussed and compared both 122
acoustic and observational bird survey methods were included in our systematic map. Relevant 123
full text publications were retrieved and read entirely. We found 41 studies with our Web of 124
Science search string and 196 studies through Google scholar. We used these studies to structure 125
our methodological comparison and complemented the discussion using references cited in these 126
studies and with additional external, relevant articles.
127
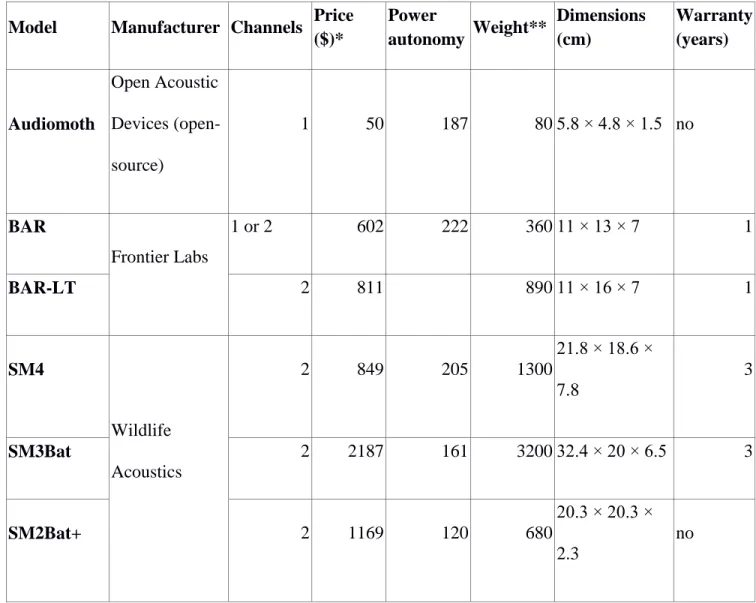
Overview of recorders 128
For the overview of currently available autonomous recorders, we included all recorders that can 129
currently be purchased as of February 5, 2019, and also those that are open-source and can be 130
built with freely available instructions (Beason et al., 2018; Sethi et al., 2017; Turner, 2015;
131
Whytock and Christie, 2016). We compiled and calculated comparable specifications for all 132
recorders by screening technical documentation or asking manufacturers directly. We refrain 133
from recommending any particular model as the best choice will depend on project needs and 134
budgets. However, we explain the relevance of the technical specifications for acoustic studies.
135
Publication trends 136
We generated an overview of the publication trends with time for each sampling method. We 137
queried ISI Web of Science on 17 September 2018, covering all years and indices: SCI- 138
EXPANDED, SSCI. We used the search string TS=(bird* OR avifauna* OR avian OR 139
ornitholog*) AND ((autonom* OR automat* OR unattend*) AND (sound* OR acoustic OR 140
audio) AND (record* OR monitor*)) for autonomous sound recorders, and TS=((bird* OR 141
avifauna* OR avian OR ornitholog*) AND ("point count*") NOT ((autonom* OR automat* OR 142
unattend*) AND (sound* OR acoustic OR audio) AND (record* OR monitor*))) for point 143
counts, excluding autonomous sound recorders. We retrieved the number of publications for the 144
field of ornithology over the same time range, queried using TS=(bird* OR avifauna* OR avian 145
OR ornitholog*), refined by the Web of Science categories of ecology, zoology, ornithology, 146
biodiversity conservation, environmental sciences, and forestry.
147
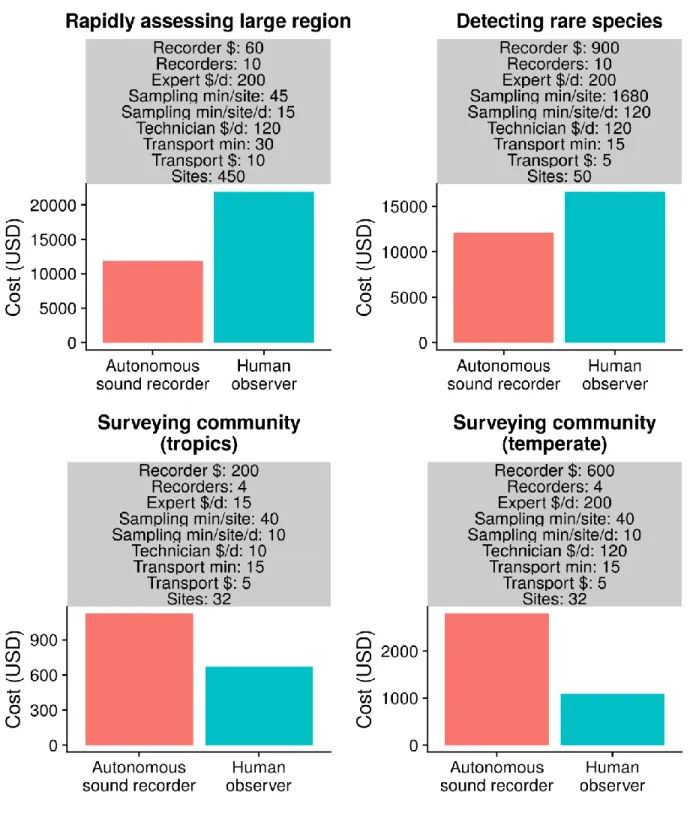
Analysis of survey costs 148
To illustrate the costs of different studies based on autonomous sound recorders or human 149
observers, we estimated the total costs in USD (material, travel, and labor) required for both 150
survey methods using all possible combinations of the following parameters (R script calculator 151
in the Supplementary Materials): recorder prices and numbers, total sampling time in minutes per 152
site, daily sampling time per site, expert ornithologist daily wages, technician daily wages, site 153
numbers, transport costs, and average site-to-site transport durations. Our calculation considered 154
the number of travels required depending on the type of survey method and the autonomy of the 155
recorder. We used a constant continuous recording autonomy of 200 minutes, which is 156
representative of most audible sound recorders. The costs of human observers were defined as 157
follows: (total sampling time per site × number of sites × expert wage) + (transport cost + 158
transport time × expert wage) × (total sampling time per site / daily sampling time per site) × 159
number of sites. The cost of using recorders was defined as follows: (recorder price × number of 160
recorders) + (transport cost + transport time × technician wage) × (1 + ceiling(total sampling 161
time per site / recorder autonomy)) × number of sites. We compare costs of both survey methods 162
for four different scenarios representing different study types: conservation studies for rare 163
species (inspired by Holmes et al. 2014), large-scale rapid assessments (inspired by Furnas and 164
Callas 2015), and bird community surveys (in tropical versus temperate zones).
165
Comparison of survey methods
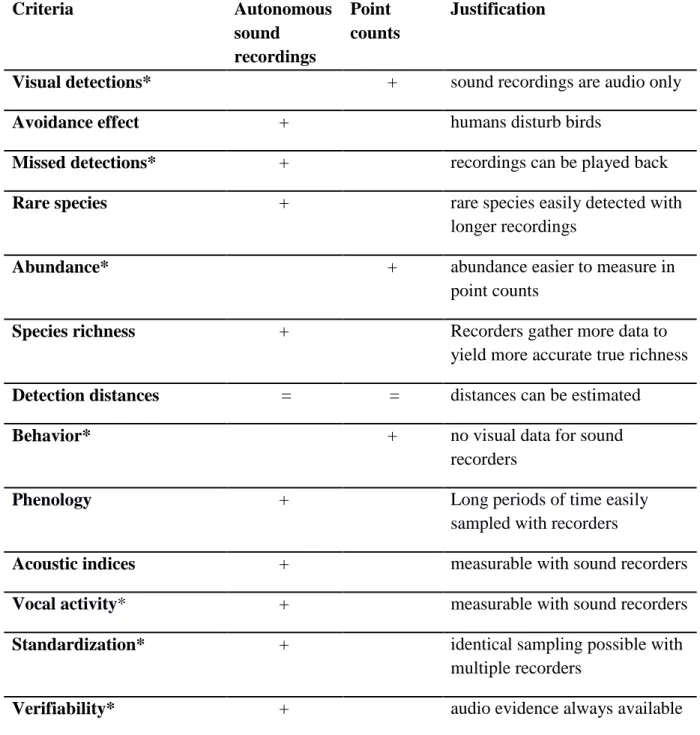
166
Firstly, we detail aspects of sampling effectiveness, which we define as the ability of either 167
method to detect birds that are present: visual detections, the avoidance effect, overlooked birds.
168
These aspects determine the overall performance of recorders versus humans for measuring 169
species richness, which we show using updated results of a separate meta-analysis. We also 170
discuss the sampling of rare species and the feasibility of hybrid approaches combining both 171
methods. Secondly, we compare the output variables of both survey methods: number of 172
detections, density, species richness, behavior, phenology, acoustic indices, and vocal activity.
173
Lastly, we discuss practicality issues such as standardization, verifiability, travel time, 174
scalability, expert labor, material and labor costs, mobility, and sampling after rain. Our results 175
are synthesized in Table 1. Even though some of the studies from our literature search used 176
regular sound recorders, we primarily expose the features of autonomous sound recorders, which 177
have several additional, unique advantages due to their outdoor usability and the possibility of 178
scheduling unattended recordings.
179
Sampling effectiveness 180
Visual detections 181
Point count data include visual detections, which is an undeniable advantage. Too few of the 182
studies comparing point counts with sound recordings report the proportion of visual-only 183
detections for a quantitative analysis. Hutto and Stutzman (2009), who had 7% visual-only 184
detections overall (pers. comm.), showed that they were the main reason why detections within 185
100m of the recorder were missed in recordings. In open habitats, visual detections can be more 186
common; however, even there point counts do not have a large advantage: In open woodland 187
savanna, Alquezar and Machado (2015) had only 8% visual-only detections in point counts; in a 188
mixture of open and wooded sites, Celis-Murillo et al. (2012) found 5% visual-only detections 189
(pers. comm.) and they also argue that visual detections do not provide a great advantage, which 190
is echoed by Hingston et al. (2018). Vold et al. (2017) showed that even in tundra bird 191
communities, visual obstruction was not associated with detected bird abundance. In more 192
heterogeneous montane habitats, McGrann and Furnas (2016a) only detected 1% of birds only 193
visually and in forest, Darras et al. (2018) only detected 4% of birds only visually. Finally, visual 194
detections mostly concern birds flying over the sampling point, which have large ranges and are 195
relatively unrelated to the sampled location (Kułaga and Budka 2019). In habitats where 196
vegetation obstructs the observers’ sight , te low proportion of visual detections is primarily due 197
to visual ranges being much shorter than acoustic ranges. Eventually, most birds vocalize, so that 198
they can be detected in longer duration recordings. Also, a human avoidance effect – discussed 199
below – might exacerbate the problem by keeping birds out of sight of the observers.
200
Avoidance effect 201
Human observers introduce an avoidance effect, especially when there is more than one (Hutto 202
and Mosconi, 1981). Disturbance effects from observers on birds are not well documented (but 203
see Fernández-Juricic et al., 2001). Distance-sampling approaches can show that bird detections 204
close to the observer are lower than predicted, especially when excluding data from 205
predominantly close range visual-only detections (Darras et al., 2018). Even clothing color 206
influences birds’ responses to human observers as seen in a reduction in detection probability 207
when observers wear hunter-orange vests (Gutzwiller and Marcum, 1993). The calling activity of 208
birds can also be affected by human presence (Bye et al. 2001). On the contrary, it is possible 209
that some curious birds, which are patrolling their territory, are attracted by human presence (like 210
some true babblers in tropical forests or Corvidae in temperate regions). Furthermore, birds can 211
also be unaffected by human observers, as determined by locating birds with a microphone array 212
when human observers are present or absent, even though the authors of the study were careful 213
not to generalise their results to other bird communities (Campbell and Francis, 2012). The 214
avoidance effect could depend on the bird community and sampling habitat: as Prabowo et al.
215
(2016) illustrated based on detection distances (Fig. S1), birds in disturbed systems tend to be 216
attracted to human presence, while birds in natural systems tend to avoid it. The avoidance effect 217
can be mitigated by camouflaged bird watching hides. Seeing that the currently available 218
evidence is inconclusive, and the fact that distance sampling is rarely used (Buckland et al.
219
2008),an overall synthesis or meta-analysis of point count data based on detection distances 220
would be helpful to determine the conditions in which the avoidance effect occurs. Overall 221
though, humans introduce a bias in the bird observation data, and in contrast, there is no reason 222
to believe that the smaller, immobile, odourless, dull-coloured, and silent autonomous sound 223
recorders would affect birds.
224
Assuming that autonomous sound recorders lack an avoidance effect, they should yield more 225
detections close to the survey centre. This is useful when bird surveys are carried out on small 226
plots (homegardens, smallholdings, etc.) where human presence would affect birds in the entire 227
plot, or even in open habitats, where human observers are too visible. The fact that the sound 228
recordings put more weight on the centre is also convenient when environmental co-variates are 229
measured close to it, enabling a closer linkage between these and bird community variables.
230
Overlooked birds 231
In point counts of species-rich sites, birds can be overlooked (or rather “overheard”) when they 232
occur simultaneously or because of human error, especially during the dawn chorus or the first 233
minutes of the study (Hutto and Stutzman, 2009). Abundance can also be underestimated for 234
common birds (Bart and Schoultz, 1984). In contrast, sound recordings can be played back 235
repeatedly, often leading to higher detectability for infrequently vocalizing birds (Celis-Murillo 236
et al., 2012). Campbell and Francis (2011) showed that people simulating “blind” point counts 237
(by listening to uninterrupted sound recordings only once) detected consistently less species than 238
were present in the recordings. In the previous study, listeners did not visualize spectrograms 239
(i.e. sonograms), which are routinely generated and inspected while listening to audio recordings, 240
so that in a sense, bird calls can actually be detected both visually and aurally. Spectrograms can 241
even be used exclusively to detect single species of interest visually, faster than by listening to 242
the recordings (Swiston and Mennill, 2009). This further enhances detectability, especially when 243
higher frequency hearing ability declines with age, which affects the point count data (Emlen and 244
DeJong 1992, Gates and Mills 2005).
245
Species richness sampled with recorders versus point counts 246
There is much debate among traditional and more technology-inclined ornithologists whether 247
sound recorders can detect as many bird species as human observers. A recent meta-analysis 248
measured the performance of sound recorders, measured in terms of species richness, against the 249
performance of human point counts when identical sampling durations are used and detection 250
ranges are considered (Darras et al., 2018). It showed that the key aspects differentiating sound 251
recorders from human point counts, namely visual detections, avoidance effects, and overlooked 252
birds, appear to have no detectable overall negative impact on the performance of recorders 253
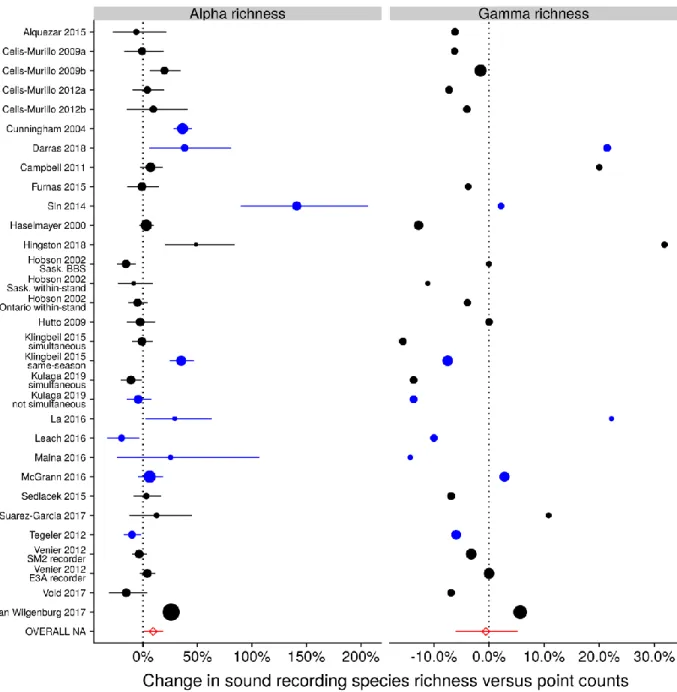
versus humans. Here, we depict updated results of the same meta-analysis, which now includes 254
two new studies and one that was previously not considered (Campbell and Francis 2011, 255
Hingston et al. 2018, Kułaga and Budka 2019) in Figure 2. These new results reveal that 256
recorders record a significantly higher species richness per sampling site, whereas total species 257
richness is still statistically indistinguishable between methods.
258
Sampling rare species 259
Ecologists are debating whether sound recordings are more or less effective than point counts in 260
detecting rare birds. Rare birds, even if they vocalise often when present, vocalise rarely overall.
261
As Celis-Murillo et al. (2012) pointed out, point counts were more effective in some studies at 262
detecting those (Haselmayer and Quinn, 2000; Hutto and Stutzman, 2009), possibly because 263
visual cues allow rare birds to be identified with more certainty (Hutto and Stutzman, 2009;
264
Leach et al., 2016). However, in the latter studies (which used identical microphone elements), 265
the sound recorders had shorter detection ranges than the unlimited range point counts they were 266
compared against: Hutto and Stutzman (2009) found that most detections missed by sound 267
recorders were too distant to be recorded (52.7%). Probably, for vocalizing birds and with 268
identical detection ranges, rare birds are not inherently more detectable with either method.
269
Venier et al. (2012) even argue that detecting rare species is more cost-effective with 270
autonomous sound recorders because of easily repeated, unattended sound recordings which can 271
span much longer durations than in-person visits that are inherently more limited in time. It 272
follows that passive acoustic monitoring systems have a greater potential for detecting rare 273
species or confidently concluding their absence, especially when combined with automated 274
identification algorithms, which can scan long recordings in an automated way (Tegeler et al., 275
2012).
276
Combining point counts with sound recorders 277
In the light of the specific advantages offered by each survey method, it appears desirable to 278
combine point counts with autonomous sound recorders. When less vocal birds are important, 279
combining both methods can increase the chances of detection of relatively silent birds, even 280
though this can also be achieved by processing longer duration recordings with automated 281
detection methods (see 4.1 in Darras et al. 2018). Using both methods has been recommended for 282
surveying rare bird species-at-risk (Holmes et al. 2014). Presence/absence data from sound 283
recordings can also be merged with point count data, leading to more complete assessments of 284
the bird communities (McGrann and Furnas, 2016a). There is considerable overlap in the species 285
detected by each method but data from both methods can be combined to detect all unique 286
species (Leach et al., 2016). Abundance data from either survey method can also be made 287
comparable through modelling that addresses differences in detection probability (Royle and 288
Nichols, 2003). Even though skilled personnel is not always available to conduct point counts in 289
these hybrid surveys, occupancy modeling can handle missing data, thus studies can even be 290
designed with point counts conducted at a portion of the sites where sound recorders are 291
deployed. However, the added logistical effort (when ornithologists are not available) and 292
statistical complexity (for assessing mixed datasets of different sample numbers and survey 293
method) of such hybrid surveys should be carefully considered.
294
Output variables 295
Number of detections 296
Rough abundance estimates are readily obtained from the number of detections in point counts, 297
since it is intuitive to estimate the position of the birds and relate it to previous activity as to 298
guess individuals’ numbers. Abundance estimates are generally deemed robust, in spite of high 299
variation at the site level (Toms et al. 2006). However, especially in dense habitats, birds are 300
rarely seen and hard to distinguish anyway, so that we cannot know whether two non- 301
simultaneous sightings correspond to different individuals. We recommend a more conservative 302
estimate of abundance: the maximum number of simultaneously detected individuals of one 303
species. It has been used in point counts (Teuscher et al. 2015) and is easily applicable to sound 304
recordings. Still, it is also possible to count uniquely identified individuals in stereo recordings in 305
a similar manner as in point counts because the birds’ location is audible (Hedley et al., 2017).
306
Individual birds also have unique calls which can be distinguished from another upon close 307
analysis (Beer, 1971; Ehnes and Foote, 2015), and software solutions tackle this (Ptacek et al., 308
2016). Only two of the publications included in our literature search estimated abundances from 309
sound recordings (Hobson et al. 2002, Sedláček et al. 2015), and both found that abundance 310
estimates correlated strongly with those obtained from point counts, even though species 311
occurring in flocks can be underestimated in sound recordings (Sedláček et al. 2015). More 312
studies should test whether sound recordings can yield accurate abundance estimates. Indeed, it 313
can be challenging to measure abundance from sound recordings when large groups of animals 314
are recorded (Denes et al., 2018), but this challenge is also present in bird point counts.
315
Density 316
Going further than simple abundance estimates derived from numbers of detections, the 317
estimation of bird densities and true abundances requires estimating detectability, which itself 318
relies on bird detection distances (Buckland et al. 2008). The estimation of bird distances in point 319
counts can be inaccurate (Alldredge et al., 2007). Even though the distance is measured, it is also 320
often an estimation based on the presumed bird position, except when it can be seen. Distances to 321
landmarks can be measured before the point count starts to be used as references in estimating 322
distances, and sometimes, when visibility allows, laser rangefinders can also be used to measure 323
distances accurately. When using sound recordings however, Hobson et al. (2002) previously 324
suggested that spectrograms could be used to estimate bird call distance when the sound source 325
level is known. Indeed, when microphones are calibrated and transmission patterns are known, it 326
is theoretically possible to calculate a detection distance (Darras et al., 2016), even though there 327
is much variation in acoustic directionality (Patricelli et al. 2007) or loudness of bird calls.
328
Previously, Shonfield and Bayne, (2017) also stressed that more work is needed to estimate 329
distances to birds in sound recordings. Recent, we showed that recording test sound sequences at 330
measured distances can be used as a reference to estimate distances to birds reliably, enabling the 331
use of distance sampling with sound recordings (Darras et al., 2018). In that context, 332
simultaneous point counts can be useful to gather reference material from aural bird detection at 333
measured distances. However, knowledge of the real-world bird vocalisation loudness is still 334
required with this method. Alternatively, reference recordings of birds at known distances can be 335
used to fit models of how the vocalisation loudness decreases with distance to infer detection 336
distances (Yip et al. In press). Taking all the evidence together, bird densities can be obtained 337
from human observer and sound recording surveys.
338
Species richness 339
Point counts and acoustic recordings can both be used to estimate species richness. For either 340
method, naïve estimates of richness based solely on the number of species detected will be 341
biased low if site-level detection probability is lower than one, which is frequently the case in 342
avian studies (Bibby et al., 2000). There are a variety of analytical approaches for correcting 343
species richness estimates from survey data including rarefaction and occupancy modeling 344
(MacKenzie, 2006). Multispecies occupancy modeling (MSOM) is gaining acceptance as a 345
standard technique for robustly estimating richness using a series of temporally replicated 346
surveys over a short period of time when populations can be assumed closed (Iknayan et al., 347
2014). Although MSOMs have been used with both point counts and acoustic recordings 348
(McGrann and Furnas, 2016a; Tingley et al., 2012), it is more practical to use autonomous sound 349
recorders to obtain multiple (>3) survey replicates at comparable times of the day (Brandes, 350
2008). For example, Furnas and McGrann (2018) found that average detection probability of 351
temperate forest passerines per 5-minute survey was similar for automated recorders and 50 m 352
point counts; it was about 0.25 which suggests that 6 survey replicates would be required to 353
achieve a site-level detection probability higher than 0.8.
354
Behavior 355
Visual point count detections can yield data about behaviour, food items, occurrence strata, 356
sometimes even the sex and age of the bird. Such data are auxiliary and seldom used in studies 357
designed for measuring avian diversity and community composition, as it is challenging to get a 358
dataset large enough for statistical analysis. However, these data are useful to put results from 359
avian studies into perspective, so we shortly discuss them here. To some degree, sound 360
recordings can also convey information through the bird vocalisations, since they have different 361
functions: territorial advertisement, mate attraction, and alarm calls all relate to bird behaviour.
362
Also, distinguishing between songs – which are typically territorial – and calls can reveal 363
whether the habitat is suitable for breeding or only visited by stray or foraging birds. It is also 364
possible to infer habitat use by pinpointing the animals’ position (Bower and Clark, 2005), and 365
tracking moving birds with microphone arrays (Blumstein et al., 2011). Finally, miniaturised 366
acoustic recording devices could theoretically be installed directly on birds to study physiology 367
and behavior; this is already used for mammals (Lynch et al. 2013).
368
Phenology 369
With sound recordings spanning long time periods, temporal dynamics throughout the day, 370
between days, and between seasons can be analysed, and phenological trends and fine-scale 371
temporal dynamics can be assessed (Blumstein et al. 2011, Lellouch et al. 2014, Thompson et al.
372
2017). Acoustic recordings and point counts have been used for timing the singing phenology of 373
birds (McGrann and Furnas, 2016b); recordings had an advantage over point counts because 374
phenology inferences are based on the detection probability parameters, the precision of which 375
are directly increasing with the number of survey replicates. Open-source automated detection 376
methods also exist to process large datasets spanning thousands of hours (Potamitis et al. 2014).
377
It is also easier to sample the same times of day at one site with sound recorders, as point count 378
observers have to travel to the site repeatedly on different days.
379
Acoustic indices 380
Sound recordings provide continuous audio records where human observation only provides a 381
filtered interpretation of the original audio-visual events. Using sound recordings, one can 382
generate sound diversity indices (eg. Acoustic richness or dissimilarity, (Sueur et al., 2008)) for 383
large datasets computationally, which can correlate well with field measures of species richness 384
(Depraetere et al., 2012). However, there are notable differences among the indices, and some 385
authors caution against adopting them too early or widely (Jorge et al., 2018; Mammides et al., 386
2017). Still, combining the most informative indices in statistical models can accurately predict 387
terrestrial species richness (R2 = 0.97) using only recordings (Buxton et al., 2018), thus 388
bypassing the time-consuming process of identifying species from recordings manually. An 389
added advantage is that all sonant animal taxa are included in audio recordings, allowing a more 390
holistic biodiversity survey which would be difficult to conduct with human observers who are 391
usually specialised on particular taxa. For example, anuran surveys are also often made by 392
human observers, but passive acoustic monitoring is increasingly used (Koehler et al., 2017).
393
Recording full-spectrum audio gives access to a relatively new field of research called 394
soundscape ecology, which focuses on the entirety of biological, geophysical, or anthropogenic 395
sounds emanating from landscapes (Pijanowski et al. 2011), 396
Vocal activity 397
Vocal activity of birds can be measured in time as an alternative to abundance. Cunningham et 398
al. (2004) showed that vocal activity and abundance are only weakly related, meaning that it 399
represents a different measure. The time that birds spend on calling and singing allows to weigh 400
detections more meaningfully: very short detections of birds who are only calling once when 401
they pass by the sampling location should not be considered equivalent to detections of 402
continuous bird songs that span the entire survey duration. Also, detecting bird songs – as 403
opposed to calls – implies that the singing bird is defending a territory or attracting mates, which 404
is an important distinction that underlines the importance of the habitat in which it is detected.
405
Bird vocal activity should correlate better with bird activity than abundance, which does not 406
consider the duration of the bird’s detection. Thus, there is potential that vocal activity represents 407
a more relevant measure for functional analyses of bird communities. For measuring vocal 408
activity, sound recordings are inherently better suited, as one can take the time to pinpoint the 409
timings when birds are vocal without error. In point counts, the time of the first detection cue is 410
commonly tracked, however, recording the end of the birds’ vocalisations is much more 411
challenging, especially when multiple individuals and species are being observed. Thus, sound 412
recordings are better suited for measuring vocal activity than point counts.
413
Practicality 414
We depict and compare the data collection and entry procedure when doing point counts versus 415
using autonomous sound recorders in Figure 2 and detail it here. Recommendations have been 416
made for conducting point counts (Bibby et al., 2000), during which an observer stands in the 417
middle of the sampling site and counts birds heard or observed for a specific duration. Field 418
notes serve as a basis for entering data into digital spreadsheets later. Sometimes, audio 419
recordings are made to assist with identification later, and doubtful aural detections can be re- 420
checked. Binoculars routinely support the identification of visual detections and in rare cases, 421
photographic data may complement the survey.
422
Standard recommendations exist for using autonomous sound recorders (Darras et al., 2018).
423
Recording schedules are programmed before installing recorders. On-site, recorders should be 424
installed on a support at a constant recording height. The recorders’ function can be shortly 425
checked. Test sound recordings from different distances are recommended to estimate detection 426
distances for distance sampling (Darras et al., 2018). Recorders will start recording at their 427
programmed time, and they are retrieved after the program ends. Typically, batteries are 428
swapped, data are checked and backed up, and after this, recorders can be installed again.
429
Finally, the retrieved data can be processed in different ways: The recordings can either be 430
analysed directly for computing soundscape-level acoustic diversity indices, or they can be 431
processed with automated classification software or manual identification using spectrograms 432
and sound playback.
433
Standardization 434
We discuss standardization by assessing the features of either method that enable unbiased 435
comparisons of biodiversity estimates (richness, abundance, composition) between studies and 436
sampling sites. Point counts suffer from a trade-off between a time and sampler bias: with an 437
increasing number of observers, more simultaneous – and thus temporally unbiased – data points 438
can be obtained, but the number of observer-specific – thus observer biased – data points 439
increases. The observer bias is commonly recognised (Sauer et al. 1994) and it can lead to an 440
under- or overestimation of the actual number of species present (from 81% to 132%, Simons et 441
al., 2007), and it also has been quantified by comparing interpretations of single observers to 442
completely annotated and multiply checked sound recordings as a reference (Campbell and 443
Francis, 2011). In contrast, sound recorders incur no sampler bias in the raw audio data when the 444
equipment and settings are identical. Their microphones are manufactured within given signal- 445
to-noise ratio tolerances, but it may change with time, due to environmental stress (rainfall, 446
temperature variations, mechanical shocks, etc.), thus requiring regular calibration (Turgeon et 447
al., 2017). However, the raw audio data should be processed by the same interpreter to avoid an 448
observer bias. Even though the bias between observers can be relatively low when using multiple 449
interpreters (Rempel et al. 2005), crucially, it can be quantified thereafter by verifying the 450
recordings.
451
Verifiability and updatability 452
Verifiability and updatability aspects concern features of the survey methods which allow 453
respectively to confirm the quality of the data, or to correct the data themselves (mainly species 454
identifications) as to eliminate possible biases. The verifiability of point counts is low as we are 455
depending on the identification skills, current physical state, and memory of a single observer.
456
Especially in tropical regions, the many species vocalizing simultaneously makes correct 457
identification of all individuals a challenging task. Moreover, auditory detections are sometimes 458
uncertain (Mortimer and Greene, 2017). When point count observations have corresponding 459
photographic or audio evidence material, the observer bias can be lessened, but this is rarely 460
done. The bias can also be corrected with high numbers of replicates, expertise checks, and 461
observer shifts in one site (Lindenmayer et al., 2009). With sound recordings, audio evidence is 462
available at no additional cost, and interpretation of recordings can be carried out whenever it is 463
convenient, even by a single person. Venier et al. (2012) showed how sound recordings can be 464
re-interpreted to correct the initial species identifications. Even when sound recordings are 465
processed by different people, the result can be reviewed and standardized by one person, which 466
is helpful in long-term monitoring projects.
467
Travel time 468
Observers carrying out point counts need only one visit per survey replicate. In contrast, sound 469
recorders need to be installed before they start recording and must be picked up for collecting the 470
data or recharging batteries (but see Aide et al., 2013 for remote data collection and continuous 471
power supply). However, it is also possible to install them, leave the sampling site, record sound, 472
and take them back with one travel, in cases when human presence is known to affect birds, or 473
when ornithologists are not available, or even when only few recorders are available. When 474
recorders are installed and picked up by ornithologists, this can be combined with a point count 475
(McGrann and Furnas, 2016b), which can yield useful reference data for distance estimation 476
(Darras et al., 2018). Depending on the study design, either one of the survey methods could be 477
more practical: if sampling replicates on consecutive days at the same site are needed, sound 478
recorders will prove handy. If the number of sampling sites is high and replicate visits are few, 479
either many recorders or frequent travels will be needed. Our cost analysis considers these 480
aspects in the calculation.
481
Scalability 482
Temporal coverage is easily increased with autonomous sound recorders and this is one of the 483
main advantages of these devices. Usually, the duration of point counts needs to be optimised so 484
that all sites can be reached within the birds’ activity window and sampled long enough, as there 485
is only a limited number of sites that can be reached within one day. Acoustic surveys, however, 486
allow for greater flexibility in scaling up sampling effort. Provided multiple recorders are 487
available, multiple sites can be sampled simultaneously. It is straightforward to record for long 488
durations or multiple days only at the expense of data storage, energy supply, and data transfer 489
time, all of which are cheap compared with specialised ornithological labour. Currently available 490
recorders can record continuously for 5 to 33 days (Table 2). Some recorders have even higher 491
autonomy by relying on solar panels for their energy supply. Transmitting data automatically 492
through wireless networks enables sampling for even longer durations (Aide et al., 2013).
493
Interestingly, choosing intermittent parts from long recordings enables to detect more species 494
than a single continuous recording of the same duration would yield (Cook and Hartley, 2018;
495
Klingbeil and Willig, 2015), due to temporal species turnover. In species occupancy modelling, 496
the increased number of replicates also considerably improves site-level detectability, and overall 497
accuracy and precision of state variables such as richness. For example, additional acoustic 498
survey replicates doubled the alpha richness estimate of montane avian communities through 499
occupancy modelling (McGrann and Furnas, 2016a), which was not possible previously with 500
point counts only (McGrann et al., 2014).
501
Spatial coverage is also easily increased as recorders become more affordable. However, when 502
recorders are scheduled for multiple repeated recordings, they cannot be used elsewhere except 503
after an additional transportation. This potentially leads to a trade-off between increasing 504
temporal coverage and spatial coverage but this issue is offset by the recent, lowest price point of 505
50 USD at which autonomous sound recorders can be purchased (Audiomoth). For a given 506
budget, 40 times more units can be purchased, and even though the sound detection spaces 507
should be smaller, these more numerous units would cover a much larger sampling area than 508
possible when using the most expensive recorders. In some cases, large coverages were achieved 509
with the help of citizen scientists (Jeliazkov et al., 2016). It also becomes feasible to conduct 510
linear acoustic transects, analogous to the common line transect surveys conducted by human 511
observers, but with all transect points sampled simultaneously. However, any spatial 512
arrangement can be used. Random placement of recorders would allow sampling sites more 513
independently, which simplifies statistical analysis and removes bias in spatial upscaling. With 514
sufficient numbers of recorders, even a complete, full-time coverage of a given territory can be 515
achieved, leading to an enhanced version of territory mappings that are conducted by humans.
516
Expert labor 517
It is costly to hire ornithologists for field surveys; demand is high during the short breeding 518
season, and in some regions (e.g. the tropics) experts may be unavailable. Passive acoustic 519
monitoring systems, however, can be installed and picked up by technical staff to assign experts 520
to the interpretation of recordings only (Rempel et al. 2005). The units can be set up as quickly 521
as humans need time for getting ready for a point count. Scheduling sound recorders also usually 522
does not require programming experience, and programs can sometimes be saved onto storage 523
media to be loaded by technical staff (e.g. Song Meters of Wildlife Acoustics). Some custom 524
open-source solutions do require some command-line input (e.g. Solo recorder, Whytock and 525
Christie, (2016). Thus, by following simple protocols, it is possible to gather raw audio data 526
without the help of ornithologists; for analysing these data however, experts are still required.
527
Autonomous sound recorders allow for a more efficient use of expert ornithologists. When 528
ornithologists are required to design and start new avian surveys in the field, they can carry out 529
initial point counts to gather data about non-vocal species, as well as reference recordings for 530
estimating bird detection distances more accurately (Darras et al. 2018). Funds for taxonomic 531
experts can be minimized to assign them only to processing or reviewing recordings, or even 532
postpone that until funds become available. Even non-experts can attain high accuracy levels 533
when using automated species classification methods (Goyette et al., 2011), and sound 534
recordings are easier to process for surveyors with little ornithological (Kułaga and Budka 2019).
535
Moreover, data can be sent to ornithologists or accessed online from anywhere (see for example 536
http://soundefforts.uni-goettingen.de/). Even citizen scientists have been mobilised to 537
successfully sample Orthopterans to subsequently automatically detect focal species (Jeliazkov et 538
al., 2016). It is often stated that identifying birds inside sound recordings is a time-consuming 539
process, but the processing time can be halved by filtering out sections without bird vocalisations 540
(Eichinski and Roe, 2017; Zhang et al., 2015) and in some cases the “search space” - or the 541
number of recordings that need to be screened – can be reduced by 94% (Potamitis et al. 2014).
542
In analyses of selected species, acoustic recordings also require less time in the field and the lab 543
(Holmes et al., 2014). It is also possible to listen to a recording without interruption, thereby 544
simulating a “blind” point count (Campbell and Francis, 2011; Venier et al., 2012) of the same 545
duration. Such a procedure incurs the same labour cost as for a point count, or even less when 546
considering that data can be entered directly in an electronic format. Altogether, we argue that 547
the labor cost of processing audio data from autonomous sound recorders is entirely dependent 548
on the researchers' needs and decisions. On the one hand, minimal sampling intensity and labor 549
cost can be achieved that is identical with point counts. On the other hand, the full potential can 550
be realised with maximal sampling intensity to find every single vocalisation. Any other 551
processing option in between is possible, but only automonous sound recorders offer this choice.
552
The trade-off of higher sampling intensities lies in the increased processing effort, which can be 553
minimised with automated detection methods.
554
Automation 555
Automated species identification is possible only with sound recordings; this procedure 556
diminishes reliance on expert workforce and allows to process large datasets in much shorter 557
time than would be possible using human labor. Different open-source and commercial solutions 558
for automated detection exist and it is widely recognised that automated analysis is the only 559
practical solution to realize the full potential of long-duration field recordings, as it allows to 560
process longer recordings in an unattended way to increase detection chances. Usually, the focus 561
has been on single species can be detected with a measurable probability and accuracy (Brandes 562
2008). The field of automated species detection is burgeoning and has been reviewed recently 563
(Priyadarshani et al. 2018). In this review, “recall” measures for automated detection are 564
emphasized, as they describe the true positive rate of a particular method; recall rates reported by 565
the publications had a median of 85%. The tested methods are usually deemed to perform very 566
accurately, and some disadvantage that they might have compared to manual identification can 567
be made up by processing larger data sets. Species counts from manual processing can be 568
expanded by the addition of automated detections from longer recordings (Tegeler et al. 2012).
569
Night birds have been preferably detected with automated methods (Shonfield et al., 2018), 570
presumably because it is easier to detect calls in the typically lower and more constant ambient 571
sound. However, the recordings used for benchmarking are sometimes not representative of real- 572
world, noisier conditions (Priyadarshani et al. 2018). The efficiency of automated species 573
detection methods also depends on the method used, the quality of the recordings, and the target 574
species: efficiency compared to manual processing is sometimes equivalent or lower (Digby et 575
al. 2013, Joshi et al. 2017). Rapid progress is being made and it is also possible to rely only on 576
the vocalisations contained within the field recordings to generate classifiers (Ovaskainen et al., 577
2018). The number of species that can be reliably identified computationally will undoubtedly 578
increase, but it is still challenging to handle complex song structures, noisy field conditions or 579
distant calls (both resulting in low signal-to-noise ratios of the target vocalisations), overlapping 580
calls of non-target species, and large song repertoires (Bardeli et al. 2010, Priyadarshani et al.
581
2018). So far, there are no fully automated methods allowing to identify all species of an entire 582
bird community, even the most "intelligent" automated methods like machine learning still 583
require initial input and final checks from human experts. Even as online audio bird databases 584
such as Xeno-Canto (www.xeno-canto.org) are available, it is impossible to rely entirely as 585
reference recordings for classifiers (such as in Araya-Salas and Smith-Vidaurre 2017) or on their 586
birding community for identifying unknown bird species: Experts should always be accounted 587
for when planning acoustic avian studies.
588
Material and labor costs 589
Autonomous sound recorders generally entail higher material costs, while point counts entail 590
higher labor costs. Point counts usually only require binoculars and field gear, and directional 591
microphones are optional. It is difficult to hire the same ornithologists throughout in long-term 592
studies. Sound recorders however, are purchased once and typically last for years if maintained 593
properly, until irreparably broken or stolen, greatly facilitating long-term data compatibility.
594
Autonomous sound recorders can be costly, but a variety of products exist (Table 2), from 595
budget constructions (Maina et al., 2016; Whytock and Christie, 2016) to commercial products 596
(e.g. Wildlife Acoustics), spanning a price range of fifty to thousands of USD. Still, it is 597
important to plan for replacement costs of batteries, and especially microphones, which are 598
exposed to the elements and which can degrade significantly over time. Microphones are also the 599
most expensive components of recorders, but they can be assembled with open-source designs 600
(Darras et al. 2018). Altogether, the total costs of each survey method (for both labor and 601
materials) is highly context-dependent, but we estimated them for four different study types 602
(Figure 4). We tried to keep the estimation simple and robust while accounting for the most 603
important parameters, as the complexity of such calculations is not bounded by any objective 604
criteria.
605
Mobility 606
Some wilderness sites in forest, at high elevations, or unexplored regions can be difficult to 607
reach. For point counts, the observer preferably has to be present on-site at dawn, which is often 608
impossible or dangerous in inaccessible or unsafe areas. In contrast, placing autonomous sound 609
recorders in such challenging conditions is easier:transport can occur any time without rush 610
when conditions are best (during daylight), and the devices are usually weatherproof so that they 611
can safely stay there for long periods of time. Autonomous sound recorders can reliably meet the 612
programmed schedule as long as they are installed before recording. Furthermore, Prevost (2016) 613
showed that sound recorders were amenable to installation on hot air balloons, due to their low 614
size and weight. Also, deployment to inaccessible areas with unmanned aerial vehicles is feasible 615
(Wilson et al., 2017), and installation on cars can also be envisaged (Jeliazkov et al. 2016). In the 616
future, large geographical scales could also be sampled using autonomous wireless recorder 617
networks that collect and transmit data wirelessly (Collins et al., 2006).
618
Sampling after rain 619
Autonomous sound recorders suffer from a drawback when it is raining: many microphones are 620
not or waterproof and foam screens are commonly used for protection against water and wind.
621
After rain, windscreens are soaked with water, which results in a loss of sensitivity and can take 622
several hours to dry. This is a clear disadvantage and a technical challenge waiting for a solution.
623
In wind-still regions, using acoustic vents with high water ingress protection ratings is a sensible 624
alternative to the use of foam windscreens (Darras et al. 2018).
625
Overview of autonomous sound recorders and their technical specifications 626
We provide an overview of the currently available recorders in Table 2. The technical 627
specifications essentially determine the suitability for a particular study or application and are 628
discussed below.
629
Commercial versus open-source solutions 630
Budget and time constraints determine whether solutions that work out of the box should be 631
purchased or specially tailored recorders should be built. Even commercial recorders can have a 632
steep learning curve, but building recorders from different components usually requires good 633
technical and basic programming skills. Support or warranties are usually not available for non- 634
commercial solutions, as they cost roughly an order of magnitude less. On the other side, 635
custom-built solutions are more flexible, easily repaired or upgraded to meet the desired 636
specifications. Both commercial and open-source solutions suffer from restricted product 637
lifespans, as they get replaced by successor models (as governed by marketing strategy), or when 638
their components become unavailable or discontinued.
639
Audio quality 640
Audio quality is mainly determined by the number of microphones or recording channels, the 641
signal-to-noise ratio of the microphones, and their height (Darras et al., 2018), the latter being 642
independent from the recorder itself. All but one of the recorders (Audiomoth) presented here 643
can be used with cables to install microphones in the desired location, if necessary. However, the 644
number of microphones cannot be changed and at least two microphones are necessary to record 645
binaural cues, which give a more accurate spatial representation of the soundscape when 646
listening.
647
The microphone itself is a crucial element as it is transducing sound energy into electrical 648
energy. Its signal-to-noise ratio, which is equivalent to its self-noise level, describes how 649
faithfully and cleanly it is recording sound, and it is an inherent characteristic of the microphone 650
model (within tolerances). Basically, the higher the signal-to-noise ratio, the higher the sound 651
quality, even though signal amplifiers also affect the final sound quality slightly. Commercial 652
vendors sometimes do not disclose which microphones are used so that you have little 653
knowledge or control over them. However, the acoustic ports are usually standard parts available 654
through electronic retailers, so that cheaper, custom-built solutions also work (Darras et al.
655
2018).
656
The sampling frequency, when divided by two, indicates what maximum sound frequency can be 657
recorded. All of the presented recorders are able to record sound at a sampling frequency of 44.1 658
kHz, which enables to record all audible sound. Some of them however can use higher sampling 659
frequencies, which allows them to be used as ultrasound sampling devices for surveying bats, for 660
instance, as long as suitable full-spectrum microphones are used (Darras et al. 2018).
661
Storage and power 662
All recorders are autonomous only as far as storage is not full and batteries are not depleted.
663
Fully autonomous solutions (power- and storage-wise) do exist (Aide et al., 2013), but they are 664
usually expensive, complicated to set up, and not for sale, so they are not covered here. Thus, we 665
provided an estimate of the run time in approximately equivalent conditions without being able 666
to test actual units in the field. Run time is determined by the batteries’ capacity and the power 667
consumption of the device, which is dependent on many factors (mainly the sampling rate and 668
recording schedule).
669
All recorders record sound in WAV format, which is an uncompressed, qualitatively lossless 670
audio format. Some have proprietary lossless and lossy compressed audio formats (Wildlife 671
acoustics), and proprietary software can be required for conversion or playback, and only one 672
uses an open-source lossless compression format (FLAC, Bioacoustic Recorder). Compression 673
can reduce or increase power consumption, depending on whether the processor or the storage- 674
writing hardware is more efficient, but will always result in storage space savings, which can be 675
crucial.
676
Physical specifications and options 677
The size and weight obviously affects how transportable the units are, and also how sturdy their 678
support has to be. All units considered here are portable, but smaller recorders can be transported 679
in greater quantities in simple backpacks and also strapped to tree branches, drones or animals.
680
Depending on their number, bulky recorders however can make it necessary to use cars for 681
transporting them.
682
Some units have integrated geopositioning sensors, which are especially useful when recorders 683
are used as mobile units in transects. Spatial coordinates also help ascertain the location where 684
the recording took place. Finally, from all the units presented here, only one (Audiomoth) is 685
currently not weatherproof, but a weatherproof case is being developed.
686
Challenges, perspectives, and knowledge gaps 687
Currently, autonomous sound recorders are still used in variable ways, as there is no widely 688
accepted standard, although best practice recommendations have been made for maximum 689
compatibility and comparability with point counts (Darras et al., 2018). On the one hand, the 690
wide range of available hardware solutions reflects the varied needs and possibilities of that 691
technology. On the other hand, comparisons of studies that use different recorders are not 692
straightforward as different recording systems likely have different detection ranges (Darras et 693
al., 2018). Luckily, they can be standardised when estimating detection distances (Darras et al., 694
2018). For the moment however, no standard survey protocols are used (Gibb et al. 2018), and 695
very few studies standardise detection spaces, although they are considerably affected by the 696
sampling sites themselves (Darras et al., 2016). Similarly, for processing audio recordings, there 697
are no widely accepted standards for assessing the performance of recognisers (Knight et al., 698
2017), which hampers a unified benchmarking of the software for automated species 699
identification, even though some benchmark datasets are available (Priyadarshani et al. 2018).
700
Covering large spatio-temporal scales is an important challenge that has been tackled with 701
acoustic surveys (Furnas and Callas, 2015). However, it is still hampered by bottlenecks: limited 702
power autonomy, limited storage capacity, and labour-intensive transport and installation of 703
recorders. Even though almost fully autonomous systems have been developed (Aide et al., 704
2013), there are no easily-implemented solutions available yet. Power limitations are being 705
released gradually through the use of solar-panels (most recorders can be connected to those) and 706
power-efficient components (Audiomoth). Storage issues are still costly to circumvent. Some 707
recorders can transmit little data packages through the mobile network (Song Meters), but no 708
attempt has been made yet to use multiple recorders to transmit data locally in networks, at the 709
only expense of power, like has been done with other sensors (Collins et al., 2006). Transmitting 710
data via low-orbit satellites can be envisioned too (“ICARUS Initiative,” n.d.). Lastly, deploying 711
acoustic recorders on large scales with drones would significantly improve the reach of such 712
systems into little-explored areas.
713
For the moment, autonomous sound recorders inherently – and obviously – generate only aural 714
detections. In the future, it is imaginable to combine them with photographic sensors similar to 715
camera traps, to design devices that make maximal use of all visible and audible events around 716
them. Camera traps can already be set up to take pictures at specific times and some models also 717
record audio while making videos. It is conceivable to create hybrid devices which would 718
entirely mimic a human observer by yielding both visual and audio detections. This would 719
enable detecting not only sonant animals but also larger, seldom vocalising animals, and it would 720
also complement the audio data by giving pictures of the sampled animals to support species 721
identification.
722
Conclusion
723
For identical sampling durations, sound recorders are on par with human observers to sample 724
birds, and if used properly, they can surpass them. Autonomous sound recorders are more 725
practical, scalable, consistent, and deliver verifiable results, but their main advantage lies in their 726
potential to collect many more data than human observers. Identification algorithms for species- 727
specific automated detection are developed at a rapid pace and tackle these growing amounts of 728
data(Priyadarshani et al. 2018), which present new challenges to store and document them 729
(Gaunt et al., 2005), even thoughstandard solutions have been proposed for manage these (Roch 730
et al., 2016). Considering the largely context-specific costs of avian studies, recorders are 731
probably more efficient for conservation-focused work and large-scale assessments, while small 732
bird community surveys can be relatively more efficient with human observers. Even so, at the 733
time of writing, machines do not replace humans yet quite. One might worry that sound 734
recording devices put ornithologists out of a job, but it is more likely that ornithologists will just 735
be able to redirect their time to less repetitive activities. Still, all audio data should ultimately be 736
vetted by experts before conclusions are published, and as bird survey data collection becomes 737
easier and relies more on “citizen scientists” and other non-experts to acquire, the demand for 738
experts could actually increase. Technology could also provide ornithologists greater work 739
flexibility as audio data can be analysed at any time, from anywhere. Ornithologists will continue 740
to fulfil an indispensable function in the field and in the office observing bird behaviour in the 741
field and habitats, designing studies, improving our understanding of avian ecology and 742
evolution, and developing strategies for effective conservation.
743
Acknowledgements
744
We declare that there are no conflicts of interest. This study was financed by the Deutsche 745
Forschungsgemeinschaft (DFG) in the framework of the collaborative German - Indonesian 746
research project CRC990. We warmly thank all collaborators who shared data and provided 747
additional explanations to carry out our meta-analysis. We thank the following persons and 748
organizations for granting us access to and use of their properties: village leaders and local plot 749
owners.
750