Effect of PCB Thickness and Height Position During Heat Level Type Vapour Phase Reflow Soldering
Mohamed Amine Alaya, Attila Géczy
Department of Electronics Technology,
Budapest University of Technology and Economics, Budapest, Hungary
Abstract: The paper investigates specific factors, which may affect the heat transfer during the heat-level type Vapour Phase Soldering (VPS) process. Nowadays many electronics manufacturers rely on the VPS as reflow soldering method, a process based on condensation heating. The article describes the effect of the PCB thickness on the heat transfer and the impact of the PCB height level (vertical positioning) in the workspace of the oven (e.g. same thickness with different height, different thickness with same top PCB surface height). Also, the paper highlights the phenomena of the temperature fall at the start of the cooling process according to these factors. For the investigation, measurements were performed in a heat-level process based VPS oven to fixed parameters, to provide precise and consequent results within the confines of the specific control method. The measurement and calculation of the heating factor help to understand the outcome from both the time and the temperature side of the critical parts of the soldering profile.
1. INTRODUCTION
Many electrical manufacturers rely, in the scale of small and medium enterprises, on the vapour phase soldering (VPS) method, due to its quality factors. The manufacturing companies hesitated to use the vapour phase soldering at the end of the 80's, because of the chemical components used in the process, which contained chlorofluorocarbons (CFCs). However, nowadays Galden fluid is used, which is free of CFC's [1]; this caused a re- emergence of the vapour phase soldering method in the last decade. One of the features of the Vapour Phase Soldering (VPS) is that the used chemicals are environmentally friendly, non-corrosive and stable. The process of the VPS soldering is based on applying heat on the Galden fluid at the bottom of the oven, until the fluid starts boiling at a temperature equal to 230°C, in the case of LS230 type Galden [2]. The saturated vapour of the Galden will start distributing with a temperature of 230°C in the workspace of the oven, in such a way the vapour will cover the positioned PCB inside the workspace. Then, the vapour will transfer its latent heat during condensation, onto the surface, to
reflow the solder paste on the assembly [3]. The thermal energy needed to increase the temperature of the board to the maximum is determined by the following equation: Q = m × c × ΔT, where Q is the thermal energy [J], m is the mass [g], c is the specific heat of object (PCB) [J/(g-ºC], ΔT is the change in temperature [ºC]. As it can be seen, the mass and specific heat capacity basically defines the heating process. Many researches tackle the problems of heat transfer during condensation even recently (for example [4,5]), but the topic of VPS is rarely discussed in details, and the current literature didn't look deeply through the characteristics of the heat transfer of the assembly in the VPS, especially from the aspect of the heat-level method. The temperature measurement of the PCBs during the soldering process can be handled with different temperature sensors. However, the most efficient ones in terms of flexibility and price are the thermocouples (TCs). A thermocouple type was chosen in this experiment to meet usual industrial standards: Type-K version was used for the work.
The Type-K TC has a wide temperature range, and it is relative robustness helps practical application.
To obtain a well assembled electronic board, there is a need of proper control on the stencil printing and
component placement [6, 7], and on the reflow (heat transfer) as well. The monitoring and optimization of the reflow profile in ovens is the key of success in controlling the characteristics of the soldering [8].
The heating factor gives an optimal parameter for evaluating the reflow profile, from the aspect of control of the process. The heating factor provides a quantitative measure between the melting/solidification point and the dynamic heat transfer in time [9].
The primary objective of this paper is to investigate the relation between the positioning height of the assembly inside the workspace and the thickness of the PCB in function of the temperature profile dynamics. The heating factor is widely used for calculations and evaluations [3,9,10] of soldering profiles and will be discussed later.Proper process control is not only necessary because of the assembling quality optimization, but for sensitizing the VPS process for lead-free soldering [11] on heat-sensitive materials, like biodegradable [12,13]
printed circuit boards.
2. EXPERIMENTAL
Vapour Phase Soldering oven used in our experiments is the ASSCON Quicky 450 with the following settings: Heating power = 60%; Vapour temperature = 180°C, Heating delay = 10 s.The settings are widely used by our laboratory for good practice in actual production, so for the experimental, we chose this practical setting. While the Heat-Level method is universal for a wide range of assemblies, the oven is not able to reconfigure itself during the process. The starting point of our experiment is to fix the oven to the given practical settings and investigate arising limitations this way.
2.1 Measurement tools
The measurements of the temperature profiles during the heating is performed with welded tip PFA K-type thermocouples with operating range between -75 ºC to +250 ºC, and the precision of
±1 °C. The thermocouples are connected to a compact thermal profiler (V-M.O.L.E.).
2.2 Materials
The PCB was made of FR4 class glass-fiber epoxy substrate with a thickness of 2 mm. To increase the thickness of the PCB we adhere two or
more boards together by SMD adhesives which (in terms of thermal parameters) are compatible with the FR4 base epoxy. The surface area of the PCBs used in the experiments are 7, 8 and 9 cm², for each PCB size there is a thickness of 2, 4, 6, 8 and 10 mm (the thickness can be ±0.5 mm, because of the adhesive between the boards).
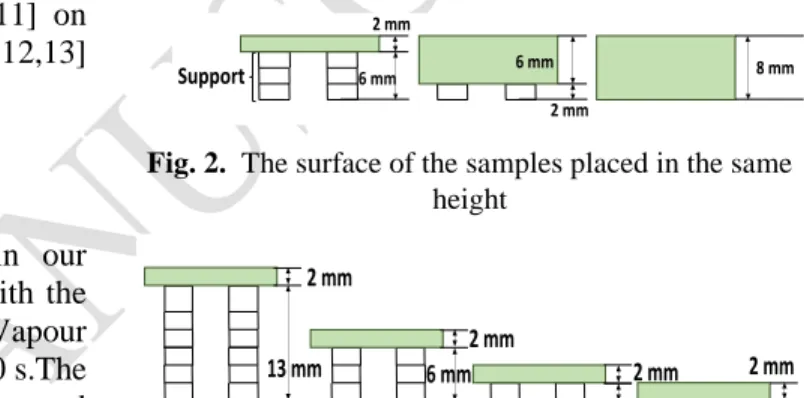
In given cases, the PCB position at determined height in the oven is set by supports in each corner of the board, the material used for the support is the same material for the PCB, and the surface size is one cm² each. Figure 2 shows the use of the support to place the surface of the PCBs in the same height level. Figure 3 presents the use of the support to change the height of the PCB knowing that the PCBs has same dimension (length, width and thickness). Four height used for this experiment:
directly on the sample holder surface of the oven (0 mm), 2 mm, 6 mm and 13 mm.
Fig. 2. The surface of the samples placed in the same height
Fig. 3. The PCBs in the same thickness paced in different height
The attaching method of the TCs to the surface of the PCB can be varied: it is possible to use different fixing materials such as high-temperature solder (HTS), polyimide tape, Alu-tape or SMD adhesives. According to the previous study [14], the proper method in our investigation is the Alu-tape adhesive fixing, because it has good repeatability and no inconsistent thermal conductivity issues (see Fig. 4). The adhesive Alu-tape will cover the exposed welded tip of the TC directly on the surface of the PCB without any bores. The material is negligible from the aspect of heat transfer due to its thin layer compared to the PCB (~0,1 mm compared to 2 mm), the proper adhesion, and high thermal conductivity.
2 mm
2 mm 2 mm
2 mm
2 mm 6 mm
6 mm 8 mm
13 mm
2 mm
Support
2 mm 6 mm 2 mm
2 mm 2 mm
2 mm 2 mm
6 mm
6 mm 8 mm
13 mm Support
2 mm 6 mm
Fig. 4. Fixing with Alu-tape adhesive
2.3 Method
The standard reflow soldering process can be divided to four phases (or zones), each one is featured on a unique thermal profile: preheat, thermal soak, reflow, and cooling. Proper control of the reflow oven profile is a must to optimize the resulting quality of the joint system of a circuit board assembly.
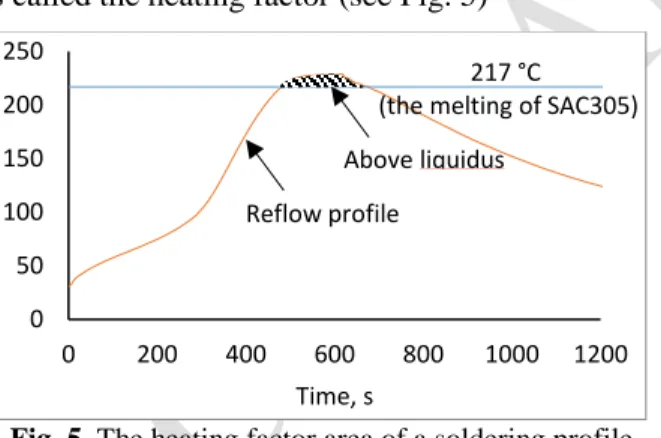
The time spent by the temperature over the solder liquidus temperature is an important factor for measuring differences between profiles The area of the measured temperature above the liquidus temperature, with the respect of the time (integral) is called the heating factor (see Fig. 5)
Fig. 5. The heating factor area of a soldering profile The heating factor of each profile gives a precise analysis of the reflow itself, and it is defined by:
𝑄𝑛 = ∫ 𝑇(𝑡) − 𝑇1 𝑑𝑡𝑡1𝑡2 , (1) where Qη is the heating factor [s·°C], T(t) is the temperature in the center of the PCB [°C], (t2–t1) is the length of time spent above liquidus [s], T1 is the liquidus of the solder (217 °C, it is the temperature of the SAC305 melting).
3. RESULTS
3.1 The effect of the PCB thickness
In each experiment 3 PCBs were placed in the sample holder of the oven in the same time, the surface sizes of the PCBs were 7×7, 8×8 and 9×9 cm. The measurement was performed for thicknesses of 2, 4, 6, 8 and 10 mm respectively.
The results in Figure 6 show that the repeatability is exceptional. However there is a different response in the aspect of the heating transfer if the thickness changed regardless of the size. That means the size of the board surface does not have a significant effect on the heat transfer of the PCB compared to each other.
In addition, Figure 6 shows a faster rise in the temperature on the PCB when the board is thinner.
Figure 7 shows that there is a different maximum reached depending on the thickness as well with the same program
Fig. 6. Measured HL-VPS profiles with different thicknesses (and top areas)
Fig. 7. The maximum temperature reached in various PCB thickness
0 50 100 150 200 250
0 200 400 600 800 1000 1200
Time, s
Above liquidus Reflow profile
217 °C (the melting of SAC305)
50 100 150 200 250
0 200 400 600 800 1000
Temperature, °C
Time, s
2 mm 4 mm 6 mm 8 mm 10 mm
221 222 223 224 225 226 227 228 229
0 2 4 6 8 10
Temperature, C
PCB thickness, mm
The maximum reasonable temperature that can be reached is 228°C (this is practically the boiling point of LS230), and this temperature is achievable with the thinner PCB configurations (which are closer to real use). However, when the PCB is thick (and higher), the temperature cannot reach the maximum boiling point temperature. This is probably due to the fact, that the controlling thermocouple of the oven (set above the PCB level) reached the set temperature before the boards actually did.
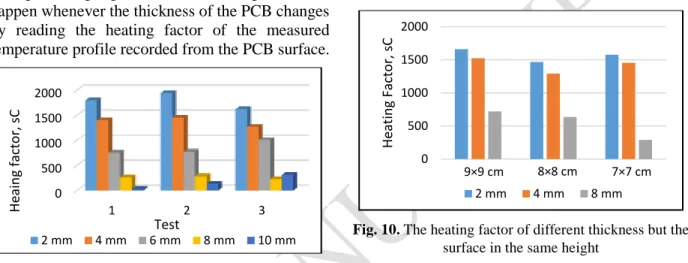
Figure 8 highlights the various changes that can happen whenever the thickness of the PCB changes by reading the heating factor of the measured temperature profile recorded from the PCB surface.
Fig. 8. The heating factor of different PCB thickness According to Figure 8, the thinner PCB has a larger heating factor. Meaning that the peaks of the profiles are profoundly affected by the thickness and the thermal mass of the boards. Figure 9 shows the average of the heating factor with different thickness.
Fig. 9. The decreasing of the heating factor depending on the thickness
The difference between the heating factor values is huge, at the point of 8 and 10 mm it starts to become unacceptably small.
In Heat-Level heating method, the concentration of the vapour is higher in the bottom of the oven, and during the process, the vapour itself is generated onto the surfaces of the board from the bottom. This can make a difference in heating when the surface of the PCB is positioned higher. To perform a cross analysis on this point, the PCBs surfaces are placed in the same height level, but the thicknesses are not the same, as Figure 2 presented.
Figure 10 showed that the result of the heating factor is not similar and even the maximum reached is not the same.
Fig. 10. The heating factor of different thickness but the surface in the same height
The reading of Figure 10 is almost comparable to the previous result (figure 8), meaning the first factor can affect the heat transfer is the thickness and thus the thermal mass of the investigated sample.
3.2 The effect of the PCB height on the heat transfer
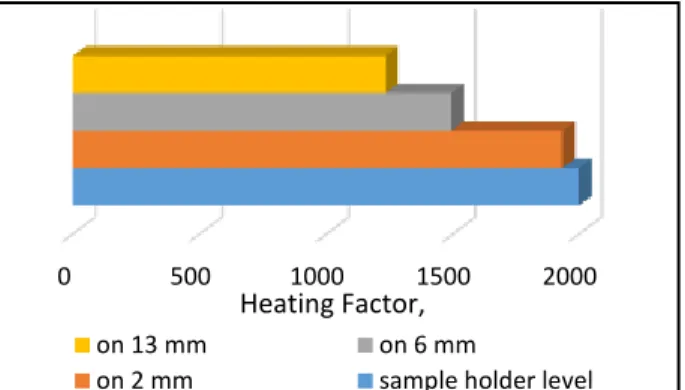
As mentioned in 3.1., the pressure and the concentration of the vapour will decrease in higher position into the oven, and it might have a direct effect on the heat transfer of the PCB. For proving this impact, four PCBs are placed together with the same surface size and thickness but on different height level in the oven (showed in Figure 3).
The support does not affect the reading of the heat transfer significantly, because it is connecting onto the PCB surfaces on a considerably small surface, and its size is negligible compared to the PCB. The support’s thermal capacitance may have a slight effect on the results, which is now neglected. Figure 11 shows a decrease in the heating factor when the PCB gets higher in the oven.
0 500 1000 1500 2000
1 2 3
Heaing factor, sC
Test
2 mm 4 mm 6 mm 8 mm 10 mm
0 500 1000 1500 2000 2500
Heating Factor, sC
Thickness, mm
2 4 6 8 10
Average MAX and min
0 500 1000 1500 2000
Heating Factor, sC
2 mm 4 mm 8 mm
9×9 cm 8×8 cm 7×7 cm
Fig. 1. Heating factor for different height settings inside
the VPS oven.
At this point, we can prove that the height has a clear impact on the heat transfer. Furthermore, (see Fig. 12), with the increase of the height, the decrease of the temperature occurs, similarly to as it was seen in Fig 7.
Fig. 2. The maximum temperatures
3.3 The effect of the PCB thickness on the heat transfer at the cooling zone
Whenever the board is thicker, the cooling of the PCB will be slower because of the increased thermal capacitance of the structure. However, Figure 13 shows that there is a fast fall of the PCB temperature in the first 7 second of the cooling, and when the thickness increases the fall down will be larger.
Figure 14 shows that there is an almost linear increase of this fall in the given range. Presently, the thermal capacitance is the main factor of this phenomenon that might affect the joint formation in the pasty range of the alloy.
For this phenomenon, another finding can be stated. The larger the thermal mass, the faster the fall around the solidus point. This might affect the quality of the joint, and this question needs further investigation from the practical side. From
theoretical side, the phenomenon can be described with the fact, that with the larger mass, the surrounding vapour concentration decrease is more considerable, when the “solder break” effect of the HL type oven comes into focus. It is suggested for future investigations, that the phenomena can be decreased with the increase of the heating power.
Fig. 3. The fall down of the temperature at the start of the cooling process
Fig. 4. Initial temperature falls after the peak.
CONCLUSION
This paper presents investigations pointing to control optimization of the reflow profile basics on a HL-type VPS oven. The elementary investigation of controlling the PCB heat transfer shows that there are several factors, which have a direct effect on the
0 500 1000 1500 2000
Heating Factor,
on 13 mm on 6 mm
on 2 mm sample holder level
205 215 225 235
570 670 770
Temperature, °C
Time, s
13 mm 6 mm 2 mm 0
0 0,2 0,4 0,6 0,8 1 1,2 1,4
2 4 6 8 10
Temperature, °C
Thickness, mm
210 215 220 225 230 235
500 550 600 650 700 750 800
2.4 C
210 215 220 225 230 235
500 550 600 650 700 750 800
3.1 C
210 215 220 225 230 235
500 550 600 650 700 750 800
4.5 C
210 215 220 225 230 235
500 550 600 650 700 750 800
8.5 C
210 215 220 225 230 235
500 550 600 650 700 750 800
8.6 C
2 mm 4 mm
10 mm
6 mm 8 mm Time, s
Time, s Time, s
Time, s Time, s
Temperature, C
210 215 220 225 230 235
500 550 600 650 700 750 800
2.4 C
210 215 220 225 230 235
500 550 600 650 700 750 800
3.1 C
210 215 220 225 230 235
500 550 600 650 700 750 800
4.5 C
210 215 220 225 230 235
500 550 600 650 700 750 800
8.5 C
210 215 220 225 230 235
500 550 600 650 700 750 800
8.6 C
2 mm 4 mm
10 mm
6 mm 8 mm Time, s
Time, s Time, s
Time, s Time, s
Temperature, C
performance of the heating. In this work, the parameters of the oven were fixed to obtain a fixed boundary condition to a practical setting of the machine. The paper comes with three main conclusions:
First, the thickness of the PCB (the thermal mass of the assembly) has an influence on the heat transfer, which is presented by the substantial alterations of the heating factor; also, the maximum temperature will not be the same when the thickness is different. Secondly, the heat transfer of the PCB in different height into the oven provides the same maximum temperatures, but with different parameters of the heating factor. Finally, there is an observation of the PCB temperature fall after the peak in different rates during cooling period. The main reason behind this is the thermal capacitance and the resulting concentration decrease around the board, whenever the thickness of the PCB increases that makes faster cooling around the solidus point, which may effect soldering quality.
The results provided in this paper are preliminary; the investigation is still in progress to establish clear results on parameter settings to enable better overall assembling and joining quality.
Also to enable soldering on heat sensitive polymers, such as biodegradables.
ACKNOWLEDGEMENT
The research reported in this paper was partially supported by the Higher Education Excellence Program of the Ministry of Human Capacities in the frame of Nanotechnology and Materials Science (BME FIKP-NAT) and Biotechnology (BME- FIKP-BIO) research areas of Budapest University of Technology and Economics and partially supported by Bolyai János Research Scholarship.
REFERENCES
[1] D. Suihkonen, “Vapor phase for lead-free reflow”, Global SMT & Packaging, (September 2007), pp.
30–32.
[2] Zabel C. “Condensation Reflow Soldering - The Soldering Process with Solutions for future Technological Demands”, Germany, ASSCON Systemtechnik-Elektronik GmbH,
http://www.amtest.bg/press/Asscon/Vapour%20Pha se%20Process.pdf (accessed at 10th January 2018.)
[3] O Krammer, T Garami, “Investigating the
Mechanical Strength of Vapor Phase Soldered Chip Components Joints”, IEEE 16th International Symposium for Design and Technology in Electronic Packaging, (Pitesti, Romania), (2010) [4] Ali, H. M. (2017). Condensation Heat Transfer on
Geometrically Enhanced Horizontal Tube: A Review, Heat Exchangers - Advanced Features and Applications, Prof. S M Sohel Murshed (Ed.), InTech, DOI: 10.5772/65896.
[5] Ali, H., Kamran, M. S., Ali, H. M., Imran, S., (2019), Condensation Heat transfer enhancement using steam-ethanol mixtures on Horizontal finned tube, Vol. 140, Page 87-95, International Journal of Thermal Sciences
[6] O Krammer, B Gyarmati, A Szilágyi, B Illés, D Bušek, K Dušek; The effect of solder paste particle size on the thixotropic behaviour during stencil printing; Journal of Materials Processing Technology Vol. 262, (2018), pp. 571-576
[7] O Krammer, L Jakab, B Illes, D Bušek, I Beshajová Pelikánová; Investigating the attack angle of squeegees with different geometries; Soldering &
Surface Mount Technology Vol. 30, No. 2, (2017), pp. 112-117
[8] B. Illés, G. Harsányi, Heating characteristics of convection reflow ovens, APPLIED THERMAL ENGINEERING Vol. 29, No. 11-12, (2009) pp.
2166–2171.
[9] Tu, P., Chan, Y., Hung, K., & Lai, J. K. “Study of micro-BGA solder joint reliability”,
Microelectronics Reliability, Vol. 41, No. 2, (2001), pp. 287–293.
[10] Veselý, P., Horynová, E., Starý, J., Bušek, D., Dušek, K., Zahradník, V. Dosedla, M. “Solder joint quality evaluation based on heating factor”. Circuit World, Vol. 44, No. 1, (2018), pp. 37–44.
[11] Zs. Illyefalvi-Vitéz, J. Pinkola, G. Harsányi, Cs.
Dominkovics, B. Illés, L. Tersztyánszky, Present Status of Transition to Pb-free Soldering,
Proceedings of 28th IEEE-ISSE (2005), pp. 72-77.
[12] Henning, C., Schmid, A., Hecht, S., Harre, K. and Bauer, R. “Applicability of Different Bio-based Polymers for Wiring Boards”, Periodica
Polytechnica Electrical Engineering and Computer Science, Vol. 63 No. 1, (2019) pp. 1-8.
[13] Carolin Henning, Anna Schmid, Sophia Hecht, Kathrin Harre, Reinhard Bauer, Comparison of Different Bio-based Polymers for Electronic Substrates, 2018 41st International Spring Seminar on Electronics Technology (ISSE), Zlatibor, Serbia.
2018, 10.1109/ISSE.2018.8443764
[14] Géczy, A., Kvanduk, B., Illes, B., Harsányi, G.
“Comparative study on proper thermocouple attachment for vapour phase soldering profiling”, Soldering & Surface Mount Technology, Vol. 28, No. 1, (2016),