Refined Approach on Controlling Heat Transfer in a Vapour Phase Soldering Oven
Attila Géczy, Balázs Péter Kiss, Amine Mohamed Alaya and Zsolt Illyefalvi-Vitéz
Budapest University of Technology and Economics, Department of Electronics Technology Budapest, Egry J. u. 18., Hungary, H-1111
gattila@ett.bme.hu
Abstract:The control of soldering temperature profiles is crucial in any reflow process of electronic assemblies. In our paper a novel approach is presented on the control of the temperature during vapour phase soldering process. In the given case the electronic surface mounted assembly to be soldered is immersed into the vapour with a special sample holder system and moved up and down by a flexible LabVIEW hardware and software configuration. It was found that with proper data acquisition and appropriate programming, the system is able to follow pre-programmed soldering profiles with small deviation. The paper presents the system, the experimental configuration and initial results obtained with the setup. The proposed setup can improve the current view on proper heat transfer handling in VPS ovens, and also enables precise control on investigations with different low-temperature solder alloys, and most importantly, thermally sensitive substrates, such as biodegradable epoxies, or moulded interconnect devices.
1.INTRODUCTION
Vapour Phase Soldering (VPS) is a reflow soldering method, which is more complex from the aspect of heat transfer than conventional convection- [1, 2, 3], or IR heating [4] based reflow processes.
In the case of VPS, the work space of an industrial oven is based on a closed tank, where a special heat- transfer fluid (called Galden) is heated up to its boiling point, therefore its vapour fills up the tank eventually.
The populated Printed Circuit Board (PCB) - e.g. an FR4 type PCB with deposited solder alloy and placed components - is immersed into the aforementioned work space, where film condensation occurs, eventually heating the board, the components and the alloy. Soldering in saturated vapour is the simplest way to achieve solder joints in vapour. The next step of VPS evolution is based on the Heat-Level method [5] - this is a very common approach. In a Heat-Level process, the vapour is generated onto the PCB by controlled heating and boiling of the liquid. The generated vapour blanket rise is practically blocked by the PCB itself, then, when the board heats up, it will enable the rise of the blanket further, and shortly the process can be completed. The Heat-Level method is usually combined with the so-called automatic solder break
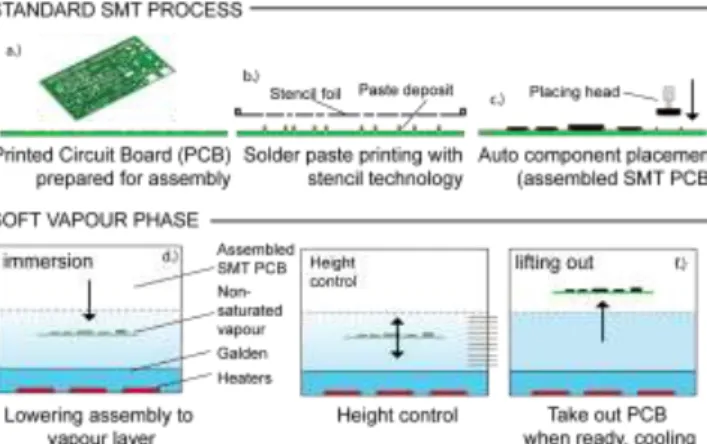
(recognition of a completed soldering process), and temperature gradient control (adjustable gradients during pre-heating) [6]. For the next step of the evolution, the Soft-Level method (Figure 1) was introduced [7,8], where the PCB is carefully positioned to discrete vertical levels (so called niveaus) inside a preconfigured vapour space to control the heating. In usual SVP ovens 20 niveaus are introduced. With the tuning of the process, creating more sophisticated soldering profiles [9] becomes easier, which will ultimately lead to better quality joints or less failure numbers.
Fig. 1. Standard SMT process with Soft Vapour Phase reflow soldering
Further alternative solutions for improving quality involve medium injection [10] and vacuum suction at the end of the process [11].
Over the last years few new approaches were introduced on the control and inspection of the oven.
Livovski and Pietrkova presented a new approach on the measurement and regulation [12,13] of the saturated vapour height level in a VPS oven, where a parallel plate capacitor was used for the regulation of the saturated vapour level height. Combine this with a PID controlled vertical lift setup and a thermocouple-ladder feedback, less than ±2 °C deviation can be achieved with continuous profile setting.
In this paper, similar approach is presented but with a completely different hardware solution based on LabVIEW hardware and software, and just one thermocouple feedback. With proper power settings, specific non-saturated vapour distribution can be achieved in the workspace, then the sample could be continuously moved vertically in the workspace with vapour concentration gradient, achieving proper, preprogrammed temperature profiles.
The proposed method and setup is especially useful for special applications, such as pin in paste technology [14], or soldering on special, heat sensitive materials, such as biodegradables [15,16], which is a special current and future application of the presented solution.
2.EXPERIMENTAL
2.1. Hardware Setup
Our setup is based on thermocouple feedback on the actual circuit board assembly temperature. The realization is based on LabVIEW hardware and software platform for more precise control configuration and real-time flexibility. Figure 2 shows the block diagram of the setup.
The motor driver interface was based on a L6208PD integrated circuit, the thermocouple interface is based on a ADX849 chip. The stepper motor is connected to an axis with a chain and a sample holder which can be moved vertically inside the VPS work zone.
The program is interfaced with a proprietary LabView VI (Virtual Instrument panel), where the temperature profile can be programmed according to the following parameters: Time Step [s], Preheat Ending Temperature [°C], Preheat Time [s], Dwell Temperature [°C], Dwell Time [s], Liquidus max
Temperature [°C], Rise to Liquidus Time [s], Liquidus Dwell Time [s].
A position error compensation multiplier is also embedded in the software and the time step can also be set according to the requirements (thermal mass, size) of the used sample.
Fig. 2. System setup for continuous solder profile tracking and control.
A snapshot of the VI is seen in Figure 3, which runs on the PC seen in Figure 2.
Fig. 3. VI of the system (PC view)
2.2. Settings for proper temperature control For setting a non-saturated vapour, the vertical temperature distribution needed evaluation along a vertical temperature sensor ladder in the middle of the workspace (as seen in our previous works). The first sensor (S1) was situated in the boiling Galden, the second sensor is just above the surface of the Galden (S2); from this position, all sensors up to the last (S10) were positioned 15 mm above the previous one. After experiments, it was found, that for the current system a faster (e.g. 550 W) heating is appropriate to set the saturated steady state of the system. Then by dropping
the power to 150 W, the system was able to relax to a position, where the height of the vapour blanket was
~120 mm. The concentration and temperature gradient of this blanket can be used for more precise profile control along a vertical line.
Galden HT170 type fluid was used, which is more convenient and faster from the aspect of experimenting, than more usual LS230 type. HT170 is commutable with LS230 from the aspect of application. The final recorded deviances are supposed to be similar with all type of Galden types. Also this Galden enables investigations and soldering of heat-sensitive biodegradable materials, which is also an ultimate goal of the experiments.
The measurement setup was tested with a 40x40 mm (1,55 mm thickness) bare laminate FR4 PCBs, which were monitored with K-type thermocouples (±1 °C) attached to their top surface - the board temperatures were recorded with the hardware and the PC.
The measurements were repeated eight times per profile setting with the exactly same hardware and software setup, with eight boards with same geometries. The heating factor of each profile is also used for validation, which is defined by:
𝑄𝑛 = ∫ 𝑇(𝑡) − 𝑇𝑡1𝑡2 𝑙 𝑑𝑡 , (1)
where Qη is the heating factor [s·°C], T(t) is the temperature of the board [°C], (t2–t1) is the length of time spent above liquidus [s], Tl is the liquidus of the solder [°C]. [9]
3.RESULTS
Figure 4 shows the result of the setup for the non- saturated vapour temperature distribution along the Z-axis of the workspace.
The temperature distribution enables ~120 mm vertical height for sample movement with non-linear temperature distribution, which is satisfactory for the sample moving. This means, it is not necessary to move the sample in and out at the top of the saturated vapour blanket, thus the profile following can be achieved in a much smoother way. The figure has an inverted temperature axis, representing the vapour space in the Z dimensions of the oven.
Fig. 4. Temperature along vertical line in the middle of the workzone at 150 W heating power.
Fig. 5. Theoretical programmed and actual measured solder profile temperature plots running alongside during different
soldering tasks on the same soldering sample boards.
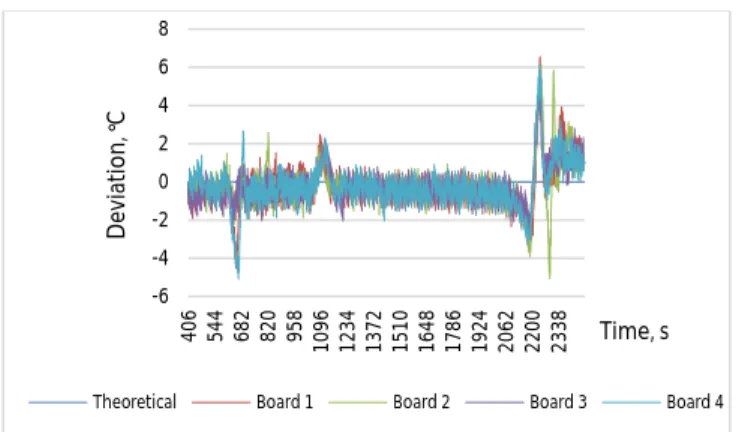
Fig. 6. Deviation of theoretical programmed and measured temperatures.
In Figure 5 a reflow profile of 42Sn58Bi (Indium), low melting temperature solder alloy is presented, where the “Theoretical” programmed plot (practically masked by the measured real profiles) refers to the recommendation of the solder paste profile (based on adjusted datasheet parameters [13]). With 40x40 mm
20 30 40 50 60 70 80 90 100 110 120 130 140 150 160 170
1 201 401 601 801 1001 1201 1401 1601 1801 2001 2201 2401 2601 2801 3001
Temperature, C
Time, 0,1 s
-6 -4 -2 0 2 4 6 8
406 544 682 820 958 1096 1234 1372 1510 1648 1786 1924 2062 2200 2338
Deviation, C
Time, s
Theoretical Board 1 Board 2 Board 3 Board 4
surface area, 1,55 mm thick FR4 test boards for soldering, the system can follow the profile with close relation to the theoretical plot. Four measurements are presented for better overview.
From Figure 6 (aligned with Figure 5 time points), it is seen, that the overall deviation is between -1 and +2 °C and the rough estimation of average deviation is
±1 °C, which is in accordance with the precision of the thermocouple. It is evident, that the different slopes of the heating up period do not affect the overall oscillating deviation. The maximum values of the deviation are observable, when the plot has breaking points. The largest deviation (between 4 and -7 °C) is observable when the system reaches its peak point above the liquidus point of the 42Sn58Bi solder alloy.
Note that the first ~40 seconds are omitted and the process is investigated from 40 °C. Temperatures below 40 °C are affected by a pre heating effect above the oven, thus they are omitted from the deviation analysis. This is represented by the aligned arrangements of plots in Figures 5 and 6.
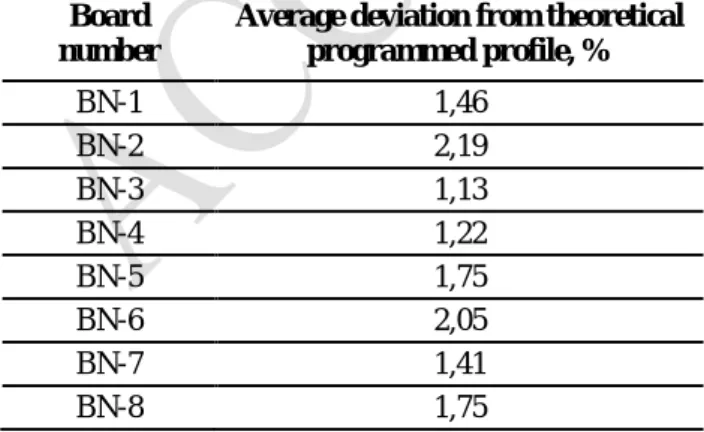
Table 1 shows the average deviation from original profile per measurement run. Then Figure 7 shows that for each board, the heating factor values (which greatly affects final soldering quality) is in good accordance with the theoretical profile.
Summing up, with the same board type, and a proper setting, the system is able to follow temperature profiles without any considerable deviation. The heating factor repeatability is also exceptional, the averaged deviation maximum is 2% during the different board measurements.
Tab. 1. Average deviation from theoretical programmed profile per measurement run (board).
Board number
Average deviation from theoretical programmed profile, %
BN-1 1,46
BN-2 2,19
BN-3 1,13
BN-4 1,22
BN-5 1,75
BN-6 2,05
BN-7 1,41
BN-8 1,75
Fig. 7. Recorded heating factor values for different board measurement runs.
4.CONCLUSION
In this paper a novel, continuous profile tracking solution is presented for VPS, where the system is based on a LabView HW-SW setup. The setup was tested with the requirements of a special BiSn type low temperature lead free solder alloy. The theoretical programmed profile (recommended by the paste manufacturer) was reproduced with small deviation, and the repeatability was excellent, considering average deviation from the theoretical programmed plot, and the heating factor values, obtained from theoretical programmed and recorded values across eight different PCBs.
For future works, the limits of our machine setup should be investigated, regarding the thermal mass, which can alter the transients of the programmed and obtained temperature plots. Also a complete system is in our view, where the method is extended with further sensors, in order to control heating power in function of the applied thermal capacity (SMT assembly) to the system.
ACKNOWLEDGEMENT
The experiment is partially supported by the Higher Education Excellence Program of the Ministry of Human Capacities in the frame of Nanotechnology and Materials Science (BME FIKP-NAT) and also Biotechnology (BME-FIKP-BIO) research areas of Budapest University of Technology and Economics.
The heat transfer studies are supported by the Bolyai János Scholarship and Bolyai+ (ÚNKP-18-4-BME- 321) programme.
Theoretical BN-1 BN-2 BN-3 BN-4 BN-5 BN-6 BN-7 BN-8
REFERENCES
[1] B. Illés, G. Harsányi, (2009) “Heating characteristics of convection reflow ovens”, Applied Thermal
Engineering, Vol. 29 (2009), pp. 2166–2171.
[2] Barbara Dziurdzia, Maciej Sobolewski, Janusz
Mikolajek, (2018) "Convection vs vapour phase reflow in LED and BGA assembly", Soldering & Surface Mount Technology, Vol. 30, Issue: 2, pp.87-99, https://doi.org/10.1108/SSMT-10-2017-0031.
[3] B Illés, I Bakó: Numerical study of the gas flow velocity space in convection reflow oven, International Journal of Heat and Mass Transfer 70: pp. 185-191.
[4] Olivér Krammer, (2014) "Comparing the reliability and intermetallic layer of solder joints prepared with infrared and vapour phase soldering", Soldering &
Surface Mount Technology, Vol. 26, Issue: 4, pp.214- 222, https://doi.org/10.1108/SSMT-09-2013-0023.
[5] Balázs Illés, Attila Géczy, Bálint Medgyes, Gábor Harsányi, (2018) "Vapour phase soldering (VPS) technology: a review", Soldering & Surface Mount Technology, https://doi.org/10.1108/SSMT-10-2018- 0042.
[6] Claus Zabel, (2006) “Condensation Reflow-Soldering - The Soldering Process with Solutions for future Technological Demands”, ASSCON Systemtechnik- Elektronik GmbH Germany, 2006.
[7] Alireza Esfandyari, Aarief Syed-Khaja, Mark Horvath, and Joerg Franke, (2015) “Energy Efficiency Analysis of Vapor Phase Soldering Technology through Exergy- based Metric”, Applied Mechanics and Materials Vol.
805(2015), 10.4028/www.scientific.net/AMM.805.196.
[8] Helmut Leicht, Andreas Thumm, (2014) “Today's Vapor Phase Soldering - An Optimized Reflow Technology for Lead Free Soldering”, SMTnet, Mar 20, 2014.
[9] Petr Veselý, Eva Horynová, Jiří Starý, David Bušek, Karel Dušek, Vít Zahradník, Martin Plaček, Pavel Mach, Martin Kučírek, Vladimír Ježek, Milan Dosedla, (2018) "Solder joint quality evaluation based on heating factor", Circuit World, Vol. 44. Issue: 1, pp.37-44, https://doi.org/10.1108/CW-10-2017-0059.
[10] John Bashe, (2006) “A New Approach to Vapor Phase Reflow Soldering”, SMT Magazine, 2006. november.
[11] Claus Zabel, JB Byers, (2013) “Void-free soldering with a new vapor-phase with vacuum technology”, SMTA Proceedings 2013.
[12] Lubomir Livovsky; Alena Pietrikova (2017):”Real-time profiling of reflow process in VPS chamber”, Soldering
& Surface Mount Technology, Vol. 29, Issue 1, DOI:
10.1108/SSMT-10-2016-0026.
[13] Lubomir Livovsky, Alena Pietrikova, (2019)
"Measurement and regulation of saturated vapour height level in VPS chamber", Soldering & Surface Mount Technology, https://doi.org/10.1108/SSMT-10- 2018-0040
[14] P, Martinek ; O, Krammer, Optimising pin-in-paste technology using gradient-boosted decision trees, Soldering and Surface Mounted Technology, 30/3 pp.164-170. 2018.
[15] Henning, C., Schmid, A., Hecht, S., Harre, K. and Bauer, R. (2019) “Applicability of Different Bio-based Polymers for Wiring Boards”, Periodica Polytechnica Electrical Engineering and Computer Science, 63(1), pp.1-8. doi: https://doi.org/10.3311/PPee.13431.
[16] Carolin Henning, Anna Schmid, Sophia Hecht, Kathrin Harre, Reinhard Bauer,(2018) “Comparison of
Different Bio-based Polymers for Electronic Substrates”, 41st International Spring Seminar on Electronics Technology (ISSE), 2018,
10.1109/ISSE.2018.8443764.