Effect of Different Thermocouple Constructions on Heat-Level Vapour Phase Soldering Profiles
Purpose:
To improve productivity and reach better quality in assembling, measurements and proper process controlling are necessary factors. This article focuses on the monitoring heat-level based Vapour Phase reflow Soldering (VPS), where - as it was found – different thermocouple constructions can affect the preset parameters of the oven and resulting soldering profiles significantly.Design/methodology/approach:
Our experiments showed significant alteration of the heating profiles during the process of the reflowing using different construction of k-type thermocouples. In a heat-level based VPS oven, PTFE, PFA Gas and Water Resistant, Fibreglasss, thin PFA and ultrathin PFA covered thermocouples were tested with ±1 °C precision. The oven parameters were changed according to the sweep of heating power. The length of the introduced thermocouple cables was also taken into account. An FR4 based sample PCB was used for monitoring the temperature.Findings:
According to the results, due to the mass and volume of the TCs wires, different changes were observed on the resulting soldering profiles on the same sample PCB. The thermocouples with lower thermal mass result in faster profiles and significantly different heating factor values, compared to the TCs that has larger thermal mass.Consequently, the length of the TC wires put in the oven has also considerable effect on the heat transfer of the PCB inside the oven.
Originality/value:
The paper shows that the thermocouple construction must be taken into account when setting up a required soldering profile, while the thermal mass of the wires might cause a significant difference in the prediction of the actual and expected soldering temperatures.Keywords: Vapour phase soldering, thermocouple, reflow, soldering profile
1. I
NTRODUCTIONVapour Phase Soldering (VPS) is used as an alternative of reflow soldering, and it is based on the principles of heat-transfer via the condensation of hot vapours (Dziurdzia et al. 2018). Like the other reflow methods in electronics manufacturing, temperature in VPS processes are usually measured with thermocouples (TCs). VPS functionality is based on Galden type heat transfer fluid, which is heated in the bottom of the VPS tank, until the point of boiling; the vapour will start to distribute into the oven up until the level of the cooling system, which controls the limit of the vapour height (Plotog et al 2010), (Branzei, M. 2012). The hot vapour will cover the surface of the immersed PCB during the reflow process. The process will be finished in a determined period, after that, the assembly will be ready to be taken out of the oven.
In heat-level based VPS processes, the board is positioned in a given height of the work-zone, then the vapour is generated onto the surfaces on the board from the bottom of the tank enabling gradient setting by heating power alignment (Asscon Datasheet, Zabel and Filor, 2007). Finally, the vapour exceeds the vertical level of the PCB, and the control system waits for a preset temperature information coming from a sensor positioned above the level of the soldering. When the vapour of a set temperature reaches the sensor height, the process stops, and the PCB is elevated into the loading level of the system. K-type thermocouple sensors are commonly applied in soldering temperature profiling (Livovsky, et al. 2017), where the precision and practicalities are both critical from production aspects. However, as an addition to the vapour space, thermocouples and their wiring may affect the processes considerably due to the perturbing nature of their thermal mass introduced to the vapour space. It is suggested, that in heat-level VPS, any significant addition to the workspace will affect the soldering profile unintentionally.
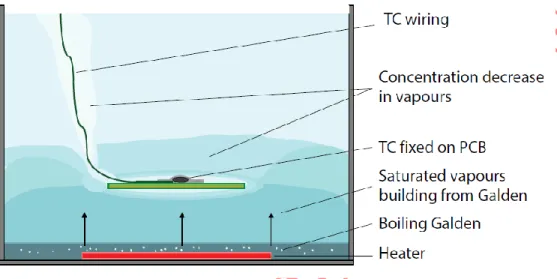
Figure 1 shows a representation of the Galden vapour distribution inside the VPS oven and the concentration of the vapour around the PCB. The vapour space is developed with boiling Galden fluid at the bottom of the tank.
The immersed, cold PCB assembly causes condensation. Any further thermal mass in the verticality of the system perturbs this configuration. Note that Figure 1 omits the sample holder system; on the other hand, this system is fixed in the oven, so practically all runs are performed with the same sample holder geometry configurations. The thermocouple wires, however, are usually lead into the vapour space with no specific rules on length and alignment, often resulting in an unorganized three dimensional positioning in the workzone.
Fig.1. Immersed PCB with the thermocouple, and perturbing wiring inside a heat level type vapour phase soldering oven
Summing up, the main goal for this research is to evaluate the temperature measurement of the heat-level VPS from the following aspects:
• Investigate the influence of different constructions of K-type thermocouples on heat transfer.
• To evaluate the resulting thermal profiles of each thermocouple and their differences in the most critical parts of heating process.
• Measure how the amount and positioning of the TC wire placed in the workplace affects heat transfer.
• To elaborate on the effect of the heating power changes on the impact of previously discussed effects.
With the assumed influence of the thermocouples, the results between an industrial test measurement and actual temperatures during production may differ significantly. Our presented results may help to avoid any distortion in the desired profile and point to better profile application during soldering; ultimately resulting in the desired or even improved soldering quality.
2.
MATERIALS AND METHODSFor the experimental, we used an Asscon Quicky 450-type heat-level VPS oven, the applied medium was Galden LS230 (boiling point: 230 °C) (Galden datasheet, 2019). The board dimension applied to the machine workzone can be up to 450*450 mm and with maximum assembly height of 60 mm (Asscon Quicky datasheet, 2009). The sample used for temperature profiling was a bare FR4 laminate in circular form with a diameter of
~200 mm and thickness equal to 2 mm (this results in a mass of ~115 g). The chosen common FR4 material is a widely used substrate in PCB manufacturing. The machine parameters were fixed in constant values: vapour temperature = 155 °C (used for sensing the readiness of the soldering) and heating delay = 15 s. Power was set to default 60% and was later varied according to the discussions below. K-type thermocouple sensors were used in the experiment and their setup is mentioned in the following subchapters.
2.1. Materials
The experiments in this article divided into three measurement runs. For the three measurements, we used a varied range of thermocouples.
Five types of welded tip K-type thermocouples, with an optimal operating range between -75°C and 250°C (±1 °C precision) was applied; The isolation material for the used thermocouples were PTFE (Polytetrafluoroethylene), PFA (Perfluoroalkoxy) and Fibreglass. The wires had different insulator and wire constructions, and they ranged with different wire flexibility, which can affect efficient positioning during their application.
For the measurements we used the following commercially available constructions (with abbreviations used later during results discussion):
a.) PTFE Teflon insulated TC (⌀0.376 mm conductor, ⌀2,3 mm overall); (PTFE) b.) PFA Gas and Water insulated TC (⌀0.5mm conductor, ⌀1 mm overall); (G&W) c.) Fibreglass insulated TC (⌀0.3 mm conductor, ⌀1.65 mm overall); (Fibre) d.) PFA insulated TC (⌀0.2 mm conductor, ⌀0.45 mm overall), (PFA) e.) Ultra Fine Wire PFA TC (⌀0.08 mm conductor, ⌀0.2 mm overall). (Ultra)
The thermocouple fixing was performed in the approximated centre of the round-shaped sample PCB in a 20x20 mm zone. Alu-tape adhesives were used for TC fixing, which is optimal from the aspect of repeatability (Géczy, 2015), and thermal coupling between the condensate and the PCB, due to its good thermal conductivity.
This construction is shown in Figure 2. The thermocouple data was logged with a V-MOLE multi-channel data acquisition system with a registration time step of 0.1 s. Three thermocouples were used to simulate the usual industrial scenario, where several points are monitored on the PCB. The actual board is just a bare laminate substrate, to avoid further effects of different thermal masses on a varied surface mounted assembly.
The thermocouple wires are fixed at one point to the grille of the sample holder with thin copper wire to avoid accidental pull of the wires from the fixture; the rest of the wire length is left non-aligned in the work zone (such ovens are usually not prepared for more precise and intentionally aligned thermocouple entry).
Fig. 2. Sample PCB, and the TCs fixed with the adhesive Alu-tape
2.2. Methods – Stages of experiments
The first stage of the experiment was focused on changing the thermocouple types with a fixed heating power and wire length, and measuring their effect on heat transfer. To ensure repeatability, each measurement run was repeated three times with the aforementioned three TCs during one measurement. The length of TC wire used for each type is 1200 mm (1.2 m) with heating power equal to 60%.
For a control measurement; the same oven profile was also measured with all TC types added to the oven in the same time on the same sample PCB.
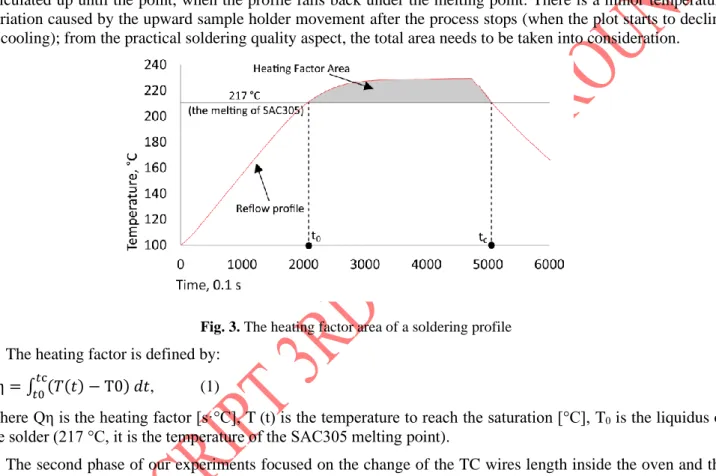
To investigate the nature of heating in focus of the solder alloy quality, the heating factor must be taken into consideration (Vesely et al., 2018), (Gao, et al. 2007), (Gang Gao, et all 2008). The heating factor in our case is calculated up until the point, when the profile falls back under the melting point. There is a minor temperature variation caused by the upward sample holder movement after the process stops (when the plot starts to decline at cooling); from the practical soldering quality aspect, the total area needs to be taken into consideration.
Fig. 3. The heating factor area of a soldering profile The heating factor is defined by:
𝑄η = ∫ (𝑇(𝑡) − T0) 𝑑𝑡𝑡0𝑡c , (1)
Where Qη is the heating factor [s·°C], T (t) is the temperature to reach the saturation [°C], T0 is the liquidus of the solder (217 °C, it is the temperature of the SAC305 melting point).
The second phase of our experiments focused on the change of the TC wires length inside the oven and the investigation of the resulting effect during the soldering process. The length of the TC wires placed in the work zone of the oven varied between 900, 1200 and 1500 mm. Smaller and longer lengths are non-practical, considering the required reasonable distance and flexibility needed to cover the depth of the workspace in the oven.
The third part of our experiments focused on the heating power, to investigate its impact on the thermal profile for each thermocouple type. The heating power was varied between 60%, 80% and 100%. According to the initial findings, 1500 mm of wire length wire was applied in the oven for each TC type, to emphasize the differences with a larger deviation.
It is essential to mention that the PCB sample temperature was around 25 °C at every start of the measurement.
However, the oven’s initial state and any pre-heating effect can vary the initial parts of the profiles significantly.
For the analysis, we start from 100 °C temperature, in order to eliminate minor differences originated from initial temperature variation and pre-heating effects of the system.
To sum up our methods, the three experiment phases are summarized below:
• E1: effect of different TC types with fixed wire length and oven parameters,
• E2: effect of different TC wire length with fixed oven parameters,
• E3: effect of heating power with fixed TC wire types.
It must be noted, that E1-E3 the experiments involved the recommendation from operation manuals, where the TC profililng is suggested to be performed with wires led from the fixing point on the PCB assembly to the top of the oven. This usually results in unorganized TC wires in the work zone. The next chapter discusses the experiments and results in details.
3. R
ESULTS3.1 E1: effect of different TC types with fixed wire length and oven parameters
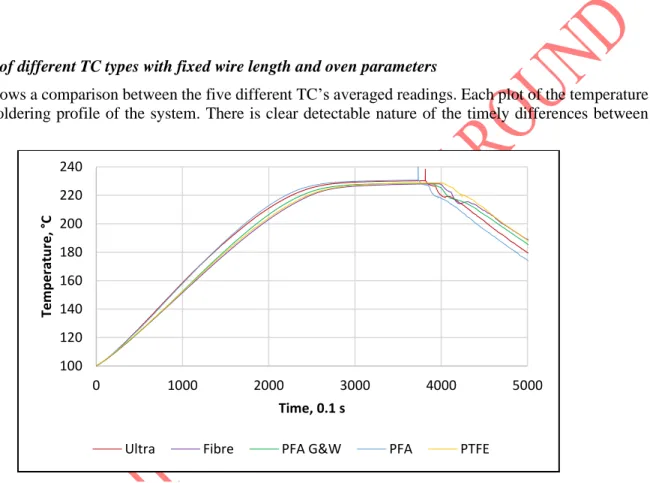
Figure 4 shows a comparison between the five different TC’s averaged readings. Each plot of the temperature represents a soldering profile of the system. There is clear detectable nature of the timely differences between curves.
Fig. 4. The result of different thermocouple readings with the same heating power (60 %)
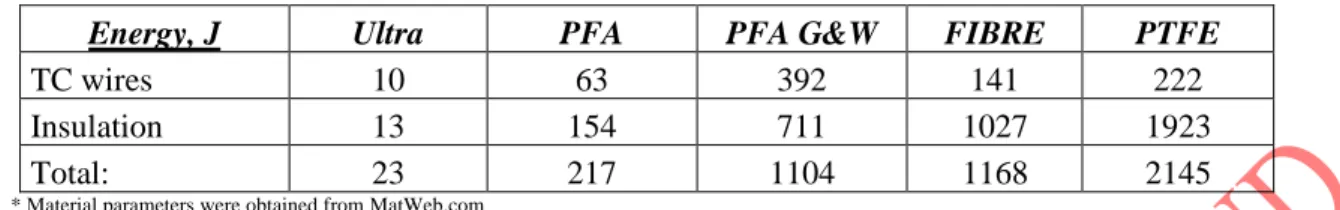
According to the results, it can be seen that the thermocouples with the larger thermal mass, give slower overall system response than in the case of measurements with TCs with the smaller thermal mass. The observation of Figure 4 shows that the Ultra and thin PFA has an almost similar result, and their profiles are considerably faster than the others. With the help of energy calculation for 1200 mm wire length (Table 1) to be heated from 30 °C to 230 °C, we can confirm that the introduced thermal mass of the wires is considerably affecting the results.
The heat energy is under the form:
E = m · c · ΔT; (2)
Where (E) is the heat energy, (m) is the mass of a substance [kg], (c) is the specific heat [J/kg∙°C] and (ΔT) is the change in temperature [°C].
Practically the Ultra and PFA insulated wires are in similar range of required energy (the Ultra TCs practically have negligible thermal mass); thus, the measurement plots are in practically very close vicinity. The rest of the wires has a considerable step in the overall energy requirements, and their results can be interpreted as a separate group. The exact order between the thermocouples may not be concluded in such precision, due to the precision of the thermocouples themselves, and the unaligned nature of thermocouple wires in the work zone.
100 120 140 160 180 200 220 240
0 1000 2000 3000 4000 5000
Temperature, °C
Time, 0.1 s
Ultra Fibre PFA G&W PFA PTFE
Tab.1. Energy requirements to heat up thermocouples
Energy, J Ultra PFA PFA G&W FIBRE PTFE
TC wires 10 63 392 141 222
Insulation 13 154 711 1027 1923
Total: 23 217 1104 1168 2145
* Material parameters were obtained from MatWeb.com
Figure 5 extends the findings of the first experiments according to the time required to reach given temperatures. It was found, that with the same boundary conditions, the thermocouples introduced to the workspace caused significant perturbation in the reflow profiles, where the differences between the results are in the 20-25 second range around the reflow melting point temperature.
Fig.5. Timely differences according to selected temperatures
It can also be concluded that the thermal-mass of the TCs have a significant impact on the maximum temperature reached because the system breaks the soldering process at different times. Again, there are two groups; the thinner thermocouples enable higher overall temperature. The results can be seen in Fig 6. Deeper discussion in this aspect is omitted now, while the process break depends on the machine programming properties
“heating delay” and the “vapour temperature” used to register the end of the process (and where the exact working mechanism is hidden from the operator) – further discussion of this seemingly minor effect shown in Fig. 6 can lead to a new research path in the future.
0 50 100 150 200 250
100 120 140 160 180 200 220
Time, s
Tempirature, °C
Ultra Fibre PFA G&W PFA PTFE
Fig.6. The maximum temperature reached by each thermocouple
As it mentioned previously, three thermocouples have been used for each measurement, the min-max deviation of the result is under 0.5%, which is expected from the evenly heating of VPS and the deviation of the TCs. The observation of Figure 6 can confirm that whenever the thermal-mass increases, there will be a direct effect on the maximum temperature reached by the thermal profile. Comparing with the Table 1, there is a small difference in the step-by-step order of TCs, but the temperature maximums and the deviations are almost in the error range of the TCs, so further conclusions cannot be drawn from the resulting order.
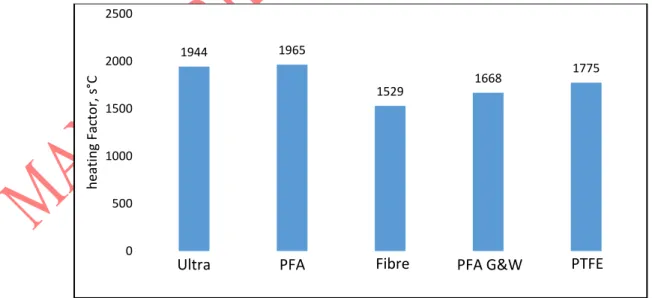
Figure 7 shows a calculation of the heating factor. The results show the averages of two measurements, to make the conclusion more general and precise. We can observe the same group alignment with the range change of the thermal masses. The min-max deviation is omitted from Figure 7, while the range of the min-max values resulted under ±1%, proving the excellent repeatability of the process. In previous studies (Géczy, 2015) the deviation of heating factor measurements with K-type TCs fixed with alu-tape on a square-shaped PCB was (±
100 s°C), pointing to approximately ±5% in the given range. The current improvements also come from the fact, that in the current studies, the deviation caused by corners of a square-shaped PCB can be neglected due to TC positioning and round shaped PCB design.
Fig. 7. The heating factor between the five thermocouples responding in 120 cm and 60% of heating power 230,3
230,7
228
228,6 228,8
226,5 227 227,5 228 228,5 229 229,5 230 230,5 231
Temperature, °C
Ultra PFA Fibre PFA G&W PTFE
1944 1965
1529 1668 1775
0 500 1000 1500 2000 2500
heating Factor, s°C
Ultra PFA Fibre PFA G&W PTFE
According to the results shown in Figure 7, the thermocouples placed in the VPS oven affect the soldering process as well, with significant differences in the heating factor, where the relative differences can be in the ~10- 22% range. Overall, the results presented above might be even more significant if the number of thermocouples and their length inside the workspace is increased due to practical reasons.
To evaluate the first approach (E1), in Figure 8 we show the reading of the five different TCs used in one measurement run simultaneously in the oven in the same length; the five different TC types are fixed in the centre of the PCB during the measurement.
Fig.8. The reading of the Thermocouples with the same time in the workspace
There was total similarity in the aspect of the output signal when the five thermocouples were merged in one measurement. There are minor differences in time and maximum reached temperature, but the transients are clearly similar without significant changes. This shows and consequently strengthens our previous findings: when different thermocouples are used in the same time in the same work zone, the additional thermal mass will be the same, and the differences originated from any variation between the thermocouple constructions will be insignificant.
3.2 E2: Result of changing the TCs length wire and its effect on the heating factor
According to the previous result, the thermal-mass of the wire inside the oven has a significant impact on heat transfer. E2 experiment focused on change the length of the TCs placed in the oven and observing the difference that can happen on the thermal profile because of the variation. Figure 9 shows an example of a run with 900 mm, showing reduced timely differences compared to Figure 4.
100 120 140 160 180 200 220
0 100 200 300 400 500 600
Temperature, °C
Time, 1s
Ultra Fibre PFA G&W PFA PTFE
Fig. 9. The result of the temperature with 90 cm of the Thermocouples length wire Tab. 2. The result of the temperature with a variation of the thermocouples length wire
With keeping the same parameters of the VPS oven, Table 2 shows the overall result which calculated from average values of the thermal profile timely differences when the length of the TCs are changing at the practical temperature point of solder melting.
The first observation is the decrease of the previously investigated deviation effect whenever the length of the TC wire is shorter - at 90 cm, the TCs impact is considerably smaller. From 120 cm, the differences are much more emphasized, which is further increased with longer wires. It is apparent that the changes are non-linear, which can also be due to the fact that the organization of the wires can also have a random three dimensional positioning effect inside the workzone. (This aspect will be discussed later in Chapter 3.4.)
3.3 E3: The effect of the thermocouples in different heating power and the way of TC placed into the oven In the last experiment, the impact of heating power is investigated. Table 3 presents Δt in the temperature of the solder melting (217°C), when heating power is varied, with fixed 150 cm wires. Table 3 shows that whenever heating power is increasing, the difference between the readings are minimized.
Tab. 3. Timely differences at solder melting point with varied heating power
ΔT in 217 °C
100% 80% 60%
15.4 s 21.3 s 22.4 s
3.4 Possible solutions for the future
According to the findings above, we propose the following for future work and industrial application. While the usual ovens usually do not have well-defined lead-in channels for thermocouple monitoring, the operators are
100 120 140 160 180 200 220 240
0 500 1000 1500 2000 2500 3000 3500 4000
Temperature, °C
Time, 0.1 s
Ultra Fibre PFA G&W PFA PTFE
ΔT in 217 °C 1500
mm
1200 mm
900 mm 22.4 s 21.2 s 10.6 s
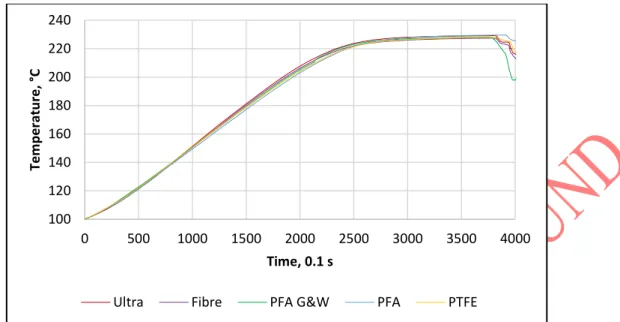
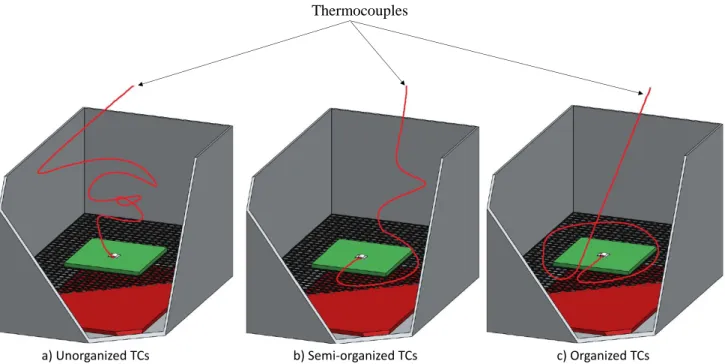
usually working with manual organization of thermocouple wire leading to the work zone (see Figure 10 - left) without any fixture or leading into the workzone. Even a semi-organization (Figure 10 – centre) with fixing of the wire in two-three points at the sample holder level can help to reduce the found differences discussed above. The best solution is a maximized organization of leftover wire length in the sample holder level of the oven, where only the minimal amount of wire is left hanging in the work zone volume above the PCB in the oven. While the additional thermal mass of the thermocouples blends in the sample holder system below the level of the PCB and the components to be soldered, the actual condensation on the surface is not perturbed significantly by the wires hanging above the assembly – this is also shown in Figure 10 (right), and Figure 11 (right). With the organization of the thermocouples, the timely differences can be reduced from the range of 20-25 s to below 10 s in the presented situation (120 cm wires, 60% power).
Fig. 10. Methods of the thermocouples organisation in the oven; a.) Unorganized (left); b.) Semi-organized (centre); c.) Organized (right)
Fig. 11. The different heat transfer between the organized (left) and unorganized (right) TCs inside the oven with 60%/120cm setup.
Thermocouples
a) Unorganized TCs b) Semi-organized TCs c) Organized TCs
120 140 160 180 200 220 240
0 1000 2000 3000
Temperature, °C
Time, 0.1 s
Ultra Fibre PFA G&W PFA PTFE
Unorganized
120 140 160 180 200 220 240
0 1000 2000 3000
Temperature, °C
Time, 0.1s
Ultra Fibre PFA G&W PFA PTFE
Organized
To sum up our findings, during industrial and experimental solder profiling in heat-level based VPS ovens, it is suggested to organize the wires, so that minimized wire length is left in the volume of work zone above the PCBs (just to enable vertical sample holder movement), and if required, leftover wire length must be organized at the level of the PCB.
4. C
ONCLUSIONIn this paper, the investigation of the temperature inside heat-level VPS oven is presented, where the influence of wires, wire length and heating power is discussed in regard of the heat-transfer on the PCB positioned in the work zone of the oven.
In the first experiments, five types of thermocouples were investigated, where it was found that the thermocouple constructions has significant transient effect on the heat-transfer (20-25 s differences at reflow temperatures), minor, but apparent effect on the maximum temperatures (up to ~3° C), and significant effect on the heating factor values (10-22% relative differences). The results are more emphasized, if more TCs are used for the measurement in the same time. It was found that the effect is based on the thermal mass. Exact order of different TC constructions could not be precisely drawn from the results due to random nature of TC wire alignment in the workzone, but it was apparent, that the two wire types with the smallest thermal mass could be consequently differentiated from the rest, in regard of the order of thermal mass and resulting timely, temperature and heating factor differences.
It was found, that the length of the thermocouples also significantly affect the process – the more wires are lead into the work zone, the larger the transient differences will be. Also, we have shown that with the increase of the heating power, we can reduce, but not diminish the influence of the TCs on the heat-transfer.
Finally, it was found that the manner of thermocouple placement in the VPS oven also has a significant influence on the heat transfer. In a recommendation to the industry and the experimental work, any excess wire should be fixed in the vertical level of the sample-PCB holder, in order to minimize differences.
The future research can focus on investigating the effect of the vapour pressure with different thermocouples.
Also, simulation of vapour concentration and further industrial thermocouple types can be investigated to increase the general understanding and practical industrial applicability
A
CKNOWLEDGEMENTThe research of vapour phase soldering was supported by the National Research, Development and Innovation Office – NKFIH, FK 132186; the applied intelligent sensor research reported in this paper has been supported by the National Research, Development and Innovation Fund (TUDFO/51757/2019-ITM) Thematic Excellence Program.
R
EFERENCES“Asscon Quicky® 450-type heat-level VPS oven, Technical Data Sheet” available at:
https://www.pmtech.co.uk/pdfs/TDS/Equipment/asscon/q450.pdf, (accessed 16 October 2019).
Alaya, M. A., Geczy, A., Illes, B., Harsányi, G., & Bušek, D. (2019). “Advances in pressure sensing for vapour phase soldering process monitoring”. Soldering & Surface Mount Technology, Vol. 31, No. 9, doi:10.1108/ssmt-10-2018-0038
Branzei, M. (2012), “Solder joints properties as function of multiple reflow Vapor Phase Soldering process”, 35th International Spring Seminar on Electronics Technology, Bad Aussee, Austria, pp 155-160.
Claus Z, Uwe F, (2007) "Secure Lead-Free Processes", Elektronik Produktion & Prüftechnik, ASSCON GmbH, 11/2007 Dziurdzia B, Sobolewski M, Mikolajek J, (2018) "Convection vs vapour phase reflow in LED and BGA assembly", Soldering & Surface Mount Technology, Vol. 30 Issue: 2, pp.87-99.
“Galden® LS & HS Vapor Phase Soldering Fluids, Technical Data Sheet”, available at:
https://www.solvay.jp/ja/binaries/Galden-LS-HS-Vapor-Phase-Soldering-Fluids_EN-220537.pdf, (accessed 16 October 2019).
Gang Gao, J., Ping Wu, Y., Ding, H. and Hong Wan, N. (2008), “Thermal profiling: a reflow process based on the heating factor”, Soldering & Surface Mount Technology, Vol. 20 No. 4, pp. 20-27.
Gao, J., Wu, Y. and Ding, H. (2007), “Optimization of a reflow soldering process based on the heating factor”, Soldering
& Surface Mount Technology, Vol. 19 No. 1, pp. 28-33.
Livovsky, L., & Pietrikova, A. (2017). “Real-time profiling of reflow process in VPS chamber. Soldering & Surface Mount Technology”, Vol29, No. 1, pp. 42–48.
Plotog, I. Varzaru, G. and Svasta, P. (2010), “VPS technology and applications”, IEEE 3rd International Symposium on Electrical and Electronics Engineering, Galati, Romania, pp. 351-354.
Veselý P, Horynová E, Starý J, Bušek D, Dušek K, Zahradník V, Plaček M, Mach P, Kučírek M, Ježek V, Dosedla M (2017) "Solder joint quality evaluation based on heating factor", Circuit World, Vol. 44 Issue: 1, pp. 37-44.