Alternative Inspection Methods of Vapour Phase Soldering Work Zone
Attila Geczy1), Mohamed Amine Alaya1), Gusztav Hantos2), and Balazs Illes1)
1) Department of Electronics Technology,
2) Department of Electron Devices,
Budapest University of Technology and Economics, Budapest, Hungary
Abstract: Vapour Phase Soldering (VPS) is a reflow soldering method used for special assemblies, where even heat distribution, uniform and high soldering quality is critical. To aim for the best joint quality, it is important to investigate the process and the state of the work zone. While VPS is a much more complex process than regular reflow methods, our paper aims to approach the monitoring of the work zone by novel and alternative paths, which can ultimately lead to a better control on the ovens, aiming for compliance with the zero defect manufacturing, and Industry 4.0 directives. For our work, two paths were defined. With the use of an infracamera, the possibility of quantitative optical observation was investigated, also the equalized temperatures of the measured board can be verified.
With pressure sensing, the state of the vapour blanket can be investigated, which can lead ultimately to more reliable working cycles. The latter method shows promising results pointing to more refined process control; the former method shows limitations in the application within the field of VPS.
1.INTRODUCTION
Vapour Phase Soldering (VPS) is an alternative method for reflow soldering; the process is based on condensation heating of the Galden type heat transfer fluid [1] rather than on IR or convection type heat transfer.
The condensation needs a saturated (or given the process control, non-saturated) vapour blanket, which requires careful work zone setup and alternative approaches on the usual reflow work zone monitoring. The VPS work zone (as shown on Fig 1.) usually consists of a tank, where the vapour is developed – a moving lift immerses the assembly (PCB, printed solder [2], and components). Then the condensation gives off the latent heat onto the assembly, which is heated up to the boiling point of the Galden fluid.
The usual approach of VPS work zone monitoring uses thermocouples to monitor the temperature of the vapour space, however our previous work showed [4] that pressure sensing can be used to find the saturation point of the work zone more precisely than thermal measurements. IR inspection (with thermal cam, e.g. like on Fig. 2) was mentioned previously for electronic assembly processes [5,6], however direct use in VPS investigations was never discussed in deep details, so our aim was to find the further possibilities in these two directions.
Fig. 1. Scheme diagram of VPS Oven
Taking a look on recent research papers, it can be stated that the special applications of VPS are mostly investigated. VPS with vacuum suction was investigated by different researchers, where the quality of the joints were in the focus [7-9]. Others showed that the microstructure of the joints formed in VPS ovens are dependent of the given setting of the soldering profile in vapours. [10-11]. Setting of this profile [12] or optimizations with statistical methods [13] were also investigated. Power electronics manufacturers utilize VPS due to the efficient soldering of large components [14-17]. Research of the energy efficiency is also under active investigations [18].
Pin-in-Paste technology fits also in the heat transfer methodology of VPS [19].
The fundamentals of the VPS process however are still not widely studied in the literature, most of the work focuses on applications and special aspects.
Our latest work will point the focus on two novel or underrepresented approaches.
First infrared cameras are used to reveal possible information about heat transfer during the process.
Second, the information about the application of pressure sensors [4] are extended for better process control.
2.EXPERIMENTAL
The measurements were performed at Budapest University of Economics and Technology, Department of Electronics Technology, using a Vapour Phase Soldering model equipment (presented in [4]). The reservoir tank was filled with HT170 Galden (170 °C theoretical boiling point, but this temperature can present a drift, or an offset in its final value). Heating was set to 850 W.
2.1. FLIR Camera measurements
The objective of the experiment is to monitor the gradual development of the heat transfer medium (e.g. the vapour blanket) in the vapour phase soldering device, and measuring the thermal levels inside and outside the VPS oven. Also to investigate the possibility of obtaining a clear thermal image of the board especially at the maximum temperature, with an attempt to highlight the effect of vapour on the sensitive components and impact on the heat distribution on the board.
From the range of cameras available, we chose ThermaCAM™ P65 (as seen in Fig 2). The camera can record up to 35 seconds of video in an AVI-file, which is then analyzed on a PC.
The measurement temperature range can be set for -40°C to +500°C, with the accuracy ±2% of reading.
Because of practical aspects we have made a few adjustments, for example, the Emissivity used for vapour fixed on e=0.45, and for the FR4 e=0.95. The lens setup was FOV 24°; filter: NOF with Ref. Temp = 25.0 °C. The camera was fixed manually above the VPS system.
Fig. 2. Flir ThermaCAM for IR investigations (Source: FLIR)
2.2. Pressure measurements
In our recent work, we tried to focus on extending the application of pressure sensing in the vapour zone, to reveal the state of the vapour blanket. Our previous work [4] founded the basics of the pressure measurement in a VPS oven. It was found, that a flow meter module may be able to predict the saturation much more precisely than thermocouples alone (which are practically the standard today for monitoring).
In recent years, the availability of cheap and accessible pressure sensors increased, giving possibility for improving hydrostatic and dynamic relation mapping inside the vapour zone.
For our investigations, four different pressure sensors were considered for experimenting.
From [4], SDP1108 type flow meter was used to connect our previous results with newly gathered data. For gage-type pressure measurements, three different types were used:
unamplified TBPDANS001PGUCV,
amplified HSCDLNN060MGAA5, and
amplified ABPLANN001PG2A5 with Arduino based SEK002 sensor evaluation kit.
The first three sensor outputs were recorded with a 14 bit DAQ, the last sensor was measured with the aforementioned evaluation kit. Then the data was summarized and analyzed in a common table. The sensors were chosen according to the following aspects:
price;
form factor;
lowest absolute gage pressure range;
commercial availability;
Figure 3 shows the different sensors in their packages.
Fig. 3. Sensor types used in our experiments
While there is a huge range of sensors even in these product families listed at the manufacturers, commercial availability (international stock availability) limits actual possibilities. Therefore, to have common ranges and
actual availability of the sensor elements, 0-1 PSI (or closely ranged) sensors were chosen, which translates to 0- 6895 Pa range. With a 14 bit Analogue to Digital Conversion (ADC) setting on the used Data Acquisition Tool (DAQ), it is possible to gather data well below the Pa resolution. The output of HSC series sensor was converted also to Pa range (0-6000 Pa). For further information it is recommended to see their respective datasheets available at [20] and [21-23].
Gage type sensors may also be able to show the hydrostatic pressure relations inside the vapour space; this is also an aim, to improve upon previous hydrostatic measurements with a possible integrated sensor solution.
Heat resistant silicon hoses (1mmØ) were attached to the sensors. The sensors and DAQ kits were left in ambient laboratory environment, the hoses were applied approximately 1-1,5 cm above the boiling Galden. The hoses were batched and extended with K-type thermocouples to measure the temperature at the end of the hose.
For deeper details on the setup see [4].
3.RESULTS
The results are presented according to the infra camera measurements (3.1) and the pressure relation investigations (3.2) in the current chapter.
3.1. Results of FLIR measurements
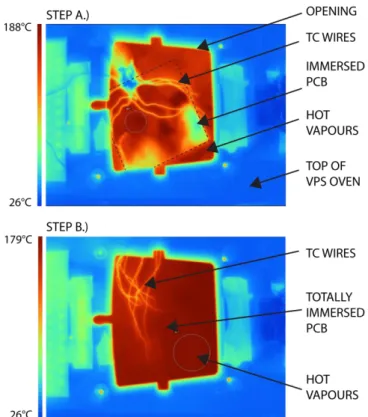
Figure 4. shows two steps of immersion which was recorded with the FLIR camera. Step A was the initial immersion of the PCB into the vapour. It can be seen, that the saturated vapour starts to surround the board at the top level of the vapour blanket. It is also shown, that the saturation temperature of the Galden has an offset, according to some drift in the boiling point. This value of temperature at the top of the blanket drops down however, after the board is immersed (in time, it took ~1-2 s between Steps A and B), revealing that the saturated vapour blanket is perturbed with the insertion of the PCB. The lower maximum temperature value at Step B.) suggests that the top layer of vapour is mixed with air, and the saturation is not completely achieved. The insulated thermocouple (TC) wires (which were used for monitoring the heating of the PCB-s), are visible in both steps.
Note that the transient heating of the PCB is not investigated in this paper via the TC recordings.
Fig. 4. Steps of PCB immersion via the eye of the FLIR camera.
The following Figure 5 shows the step, when the PCB was taken out of the vapour blanket (the TC monitoring gave a feedback on temperature saturation of the board). The picture of the PCB becomes clear, when it is taken out of the vapours; as a result it can be said, that the camera image reflects well the evenly heating of the board during the VPS process. For exact temperature verification on the board, however, the method is not precise enough. The difference of the investigated medium (vapours vs. solid materials) shows, that calibrated IR camera on the vapours, would overshoot the absolute temperature maximum value on the solid material, after retrieval from the vapour. Further calibration may reveal more precise results, however it is clear that the method is not enough for clear information about the key process parameters.
Fig. 5. Board taken out of the vapours.
3.2. Results of Pressure Measurements
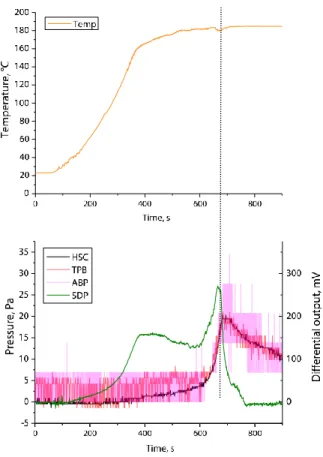
Figure 6 shows a heating up time window of the vapour zone from ambient relations to steady state. Upper plot of Figure 6. presents the heating of the vapour with the thermocouple signal, to correlate temperature relations to the measured vapour state. The values are presented in Pa, for better understanding. For the SDP type sensor, output is presented in mV range, while the differential dynamic output is not directly correlated to gage type outputs. The resulting plots reveal different aspects of the heating up. It is clear that, HSC, TBP and ABP sensors give mostly similar results, however the output signal is depending greatly on the default, out-of- the-box ability of the sensor. It is clear, that ABP is sampled with too low ADC bit count, resulting in a choppy signal. The use of this configuration (with Arduino and Sensor Evaluation card) was chosen for its “ready” and modular application, however inner ADC limits its practical use. TPB and HSC works in the same manner as ABP, where the TPB unamplified sensor (even with the amplification and filters in the data acquisition card) is more susceptible to noise. The best choice for receiving a clear signal with the same DAQ system is HSC, where the integrated amplification and filtering gives a ready output for analyzing.
As for the nature of the signals, it has to be stated, that both HSC, TPB and ABP show clearly the initial buildup of the vapour space, practically revealing the hydrostatic pressure of the vapour column above the opening of the sensor probe. The values show ~20 Pa at maximum, which is in correlation with data found in [4]. The direct correlation between SDP and the others show, that the absolute hydrostatic maximum isachieved, when the dynamic buildup (SDP output) of the vapor relaxes. Temperature also closes on the maximum value (full saturation), when the peak is reached with the pressure sensors. It is important to note, that temperature reaches above 90% of its maximum, at around the 2/3rd of the saturation signaled by pressure sensing. This makes very difficult to control the system solely based on results from thermocouples, if the steady state is defined by TC measurements.
Fig. 6. Time saturation (up) and vapour blanket development via the signals of the pressure sensors (bottom) recorded in the same initial heating of the system
4.CONCLUSION
The paper presents alternative inspection methods on the vapour phase soldering process, with infrared camera imaging, and pressure measurements inside the vapour chamber. The conclusions are presented according to the aforementioned methods.
4.1. Conclusions of IR Imaging
According to the results of Chapter 3.1, the following can be stated about IR camera measurements for investigating the vapour.
The method can verify the saturation temperature state of the top level of the vapour blanket.
The camera can not see trough the vapours, so it is not possible to process the actual heating of the board during the process with this methodology.
The camera may help to reveal thermal leaking points on the VPS construction (weak points of thermal insulation).
The camera can show the top layer of the vapour, highlighting the collapse of the saturated vapour, and showing that the top side of the blanket is probably mixed with colder air.
When the PCB is removed from the vapour, the camera is able to reveal the thermal equalization on the board surface. The current investigations revealed, that the board heated up evenly along the top surface.
This can be important for evaluating different component temperatures on soldered assemblies.
4.2. Conclusions of Pressure Sensing
According to the results of Chapter 3.1, the following can be concluded about measurements with pressure sensors.
Time saturation with an error window of 5-10% is not in time with saturation according to pressure sensors.
Saturation (the height of the vapour blanket) reaches maximum, when the dynamic sensor output shows relaxation.
According to the chosen sensors, with a given DAQ system it is still better to use the amplified/filtered output, despite the sensors higher price and larger form factor.
Future work will point to investigations of vapour blanket development with pressure sensors, and exact hydrostatic pressure changes during heating up, and during soldering, where any immersed thermal mass (e.g. an assembled printed circuit board) may affect the state of the vapour blanket.
ACKNOWLEDGEMENT
The research was supported by Bolyai János Kutatási Ösztöndíj (Bolyai János Research Scholarship), and Stipendium Hungaricum Scholarship Programme.
REFERENCES
[1] Claus Zabel: Condensation Reflow Soldering - The Soldering Process with Solutions for future Technological Demands, ASSCON Systemtechnik-Elektronik GmbH, Germany;
[2] Oliver Krammer, László Jakab, Balazs Illes, David Bušek, Ivana Beshajová Pelikánová, (2018) "Investigating the attack angle of squeegees with
different geometries", Soldering & Surface Mount Technology, Vol. 30 Issue: 2, pp.112-117.
[3] VAPSY++ Project, Hackaday.io, https://hackaday.io/project/28449/ (Accessed at 23.01.2018.)
[4] Geczy A, Illes B, Peter Zs, Illyefalvi-Vitéz Zs, Characterization of Vapour Phase Soldering Process Zone with Pressure Measurements. Soldering & Surface Mount Technology, 25 (2). 2013. pp. 99-106. ISSN 0954-0911
[5] Delecroix Stéphane, Skifatil Mahmoud, Les Caméras Infrarouges - Projet Bibliographique, 2009. (Accessed at 23.01.2018.)
[6] Plotog I., Branzei M., Svasta P., Thumm A., PCBs thermophysical properties in lead-free assembling process
assessment, 2010 IEEE 16th International Symposium for Design and Technology in Electronic Packaging (SIITME), pp. 29-32.
[7] Synkiewicz B K, Skwarek A and Witek K Voids investigation in solder joints performed with vapour phase soldering (VPS), Solder. Surf. Mt. Tech., (2014.) Vol. 26 No. 1 pp. 8–11.
[8] Lungen S, Klemm A, Wohlrabe H, Evaluation of the quality of SMDs according to vacuum vapour phase soldering, 38th IEEE ISSE, (2015.) pp. 218 – 222.
[9] Barbara Dziurdzia, Maciej Sobolewski, Janusz Mikolajek, "Convection vs vapour phase reflow in LED and BGA assembly", Soldering & Surface Mount Technology, Vol. 30 Issue: 2, (2018) pp.87-99, https://doi.org/10.1108/SSMT- 10-2017-0031
[10] Pietrikova A, Mach P, Durisin J and Livovsky E Microstructure analysis and measurement of nonlinearity of vapour phase reflowed solder joints, 31th IEEE-ISSE (2008.) pp. 363–366
[11] Wei Liu, Rong An, Ying Ding, Chun-Qing Wang, Yan-Hong Tian, Kun Shen, Microstructure and properties of AgCu/2 wt% Ag-added Sn–Pb solder/CuBe joints fabricated by vapor phase soldering, Rare Metals, Springer, 2015. pp 1-6 [12] Lubomir Livovsky Alena Pietrikova, Real-time profiling of reflow process in VPS chamber, Solder. Surf. Mt. Tech,
Vol. 29 Iss 1. (2017.) pp. 42-48.
[13] Tsung-Nan Tsai, Optimizing Reflow Thermal Profiling Using a Grey-Taguchi Method, Journal of Quality Vol. 22, No.
5 (2015.) 365.
[14] Chou P-C, Cheng S, Performance characterization of gallium nitride HEMT cascode switch for power conditioning applications, Mater. Sci. Eng. B Vol. 198 (2015.) pp. 43–50.
[15] Hromadka K., Reboun J, Rendl K, Wirth V, Hamacek A, Comparison of the surface properties of power electronic substrates, 38th IEEE-ISSE (2015.) pp. 146 - 150
[16] Synkiewicz B, Skwarek A, Witek K, Vapour phase soldering used for quality improvement of semiconductor thermogenerators (TEGs) assembly, (2015.) Mat Sci Semicon Proc Vol. 38 pp. 346–351.
[17] Syed Khaja A, Kaestle C, Reinhardt A, Franke J Optimized Thin-Film Diffusion Soldering for Power-Electronics Production, 36th IEEE-ISSE,(2013.) pp. 11 – 16.
[18] Esfandyari A, Syed-Khaja A, Horvath M, Franke J, Energy Efficiency Analysis of Vapor Phase Soldering Technology through Exergy-Based Metric Appl Mech Mat Vol. 805 (2016.) pp. 196-204.
[19] Oliver Krammer, Bertalan Varga, Karel Dušek, (2017) "New method for determining correction factors for pin-in- paste solder volumes", Soldering & Surface Mount Technology, Vol. 29 Issue: 1, pp.2-9.
[20] Sensirion SDP 1108 website; https://www.sensirion.com/en/flow-sensors/differential-pressure-sensors/differential- pressure-sensor-for-medical-applications/; (Accessed at: 21. 04. 2018.)
[21] TBPDANS001PGUCV datasheet; https://sensing.honeywell.com/honeywell-sensing-basic-board-mount-pressure- sensors-tbp-datasheet-50092900-b-en3.pdf; (Accessed at: 21. 04. 2018.)
[22] HSCDLNN060MGAA5 datasheet; https://sensing.honeywell.com/honeywell-sensing-trustability-hsc-series-high- accuracy-board-mount-pressure-sensors-50099148-a-en.pdf; (Accessed at: 21. 04. 2018.)
[23] ABPLANN001PG2A5 datasheet; https://sensing.honeywell.com/honeywell-sensing-basic-board-mount-pressure-abp- series-datasheet-2305128-e-en.pdf; (Accessed at: 21. 04. 2018.)