stress in multi-pass pipe welds
Mahmood Hasan Al-Hafadhi
pand Gyorgy Krallics
Institute of Physical Metallurgy, Metal Forming, and Nanotechnology, University of Miskolc, Egyetemvaros, H-3515 Miskolc, Hungary
Received: December 20, 2019 • Revised manuscript received: June 4, 2020 • Accepted: December 21, 2020 Published online: March 24, 2021
ABSTRACT
A numerical simulation procedure is presented to predict residual stress states in multi-pass welds in oil transportation pipes. In this paper, a two-dimensional thermo-mechanical finite element model is used to calculate the temperature distribution, hardness, and the distribution of residual stresses during multi-pass welding of pipes of dissimilar metals and varying thicknesses. In this model, the temperature dependence of the thermal and mechanical properties of the material was considered. The present model was validated using the hardness measurement. Good agreement was found between the mea- surement and the numerical simulation results. The simulated result shows that the two-dimensional model can be effectively used to simulate the hardness test and predict the residual stress in the pipe weld. The simulation results and measurements suggest that the model with moving heat source can obtain a good prediction of residual welding stress. Both the two-dimensional and the three-dimen- sional modeling can be used to estimate the residual stresses in different weld regions and help saving time.
KEYWORDS
numerical simulation, welding pipe, residual stresses, hardness test
1. INTRODUCTION
Welding is a reliable and efficient metal joining process used in almost all industries. Welded joints are extensively used in oil and natural gas pipeline, power plant and pressure vessels.
Dissimilar pipe welds are commonly found in various industrial applications due to both technical and economic reasons [1]. One of the significant problems in pipe welded struc- tures is residual stresses caused by shrinkage of the material after the welding process. This is due to the large temperature gradients generated in the weld Fusion Zone (FZ), Heat- Affected Zone (HAZ), and Base Metal (BM). The regions near the weld zone undergo transient heating and cooling cycles during the welding, thus generating plastic deformation and residual stresses in the weld zone. Furthermore, the resulting residual stresses may be responsible for increasing cracking and fatigue in the weld. The measurement of residual stresses developed during welding of the pipe helps in lowering the risk to failure by pre- dicting the effect of residual stresses. The most way to control and analyze residual stresses is to measure them. There are many methods to measure residual stresses are known as non- destructive, semi-destructive and destructive or diffraction asX-ray diffraction, hole drilling and block removal layering [2]. To reduce the residual stresses effect of welding process quality, research on residual stresses has been a continuous interest among researchers [3–10]. The experimental measurement techniques of residual stresses that involve the complex weld shape or structure, which is very time-consuming and costly. Numerical simulations help to understand and predict residual stresses behaviors of complex welding phenomena in extreme conditions. The prediction of residual stress is essential to optimize the welding process for reducing the stresses effects. Recently, numerical simulation can be used to predict residual analysis stresses and reduce the time and economic costs associated
Pollack Periodica • An International Journal for Engineering and Information Sciences
16 (2021) 2, 7–12
DOI:
10.1556/606.2020.00127
© 2020 The Author(s)
ORIGINAL RESEARCH PAPER
pCorresponding author.
E-mail:mahmoodhs199@gmail.com
with experiments. Finite Element (FE) analysis (numerical simulation) is critical way to help quantify welding mecha- nism. Welding residual stresses in simulation research, which is based on the finite element analysis has achieved rapid development, and used in weld simulation has been widely used [10–18]. In this study, the prediction of residual stresses in a dissimilar pipe weld joint made of E355K2 and P460NH_1 is studied by using 2-D finite element method.
The simulation hardness of the weld joint is used to validate the model and compare the simulation result with experi- mental hardness results.
2. MATERIALS AND METHOD
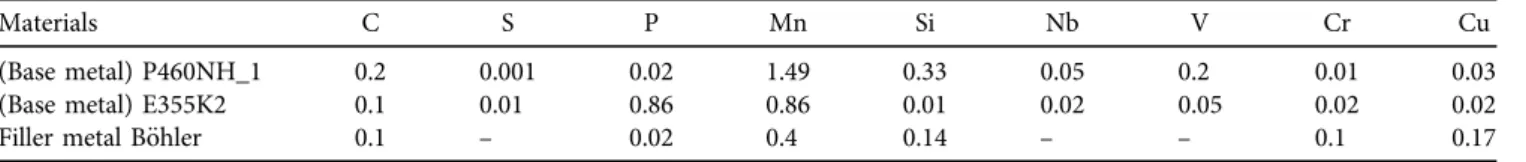
Dissimilar material pipe welds were used in this work because they are commonly found in various industrial ap- plications for both technical and economic reasons. The materials and chemical composition of the pipe used in this study are given below inTable 1, and the welding parame- ters for weld joints and welding pool shape or Goldak model are given in Table 2 [19]. The filler wire was 3.2 mm in diameter. Multi-pass welding with an inter-pass with maximum temperature value 2008C is used.Figure 1shows the pipe after welding and the 2-D model withfillers was built with (birth and death) element using 8,466 elements.
By using appropriate mesh optimization technique, a rela- tivelyfine mesh is generated in and around the weld lines and a comparatively coarse mesh is used for areas away from weld line. In numerical simulation analysis, the accuracy of the results and required computing time are determined by the finite element size (mesh density). According to nu- merical analysis theory, the models with afine mesh highly accurate results but required longer computing time. On the other hand, the model with coarse mesh (large element size) may lead to less accurate results but not much computing time.
3. VALIDATION OF THE 2-D MODEL
In order to set up the accuracy of the numerical model, validation of model is necessary to predict the residual stress.
The cross-section welding part was polished after cutting, and the surface of the specimen was etched with HNO3 (nitric acid) 2% solution (nitrate etching agent) to show the passes and FZ and HAZ.
The hardness measurement was carried out from top to bottom with 12 lines, as it shown inFig. 2. The validation of the welding simulation procedure is carried out on a multi- pass butt weld with eight tracks. The left pipe is P460NH_1 Table 1.Chemical composition (wt%)
Materials C S P Mn Si Nb V Cr Cu
(Base metal) P460NH_1 0.2 0.001 0.02 1.49 0.33 0.05 0.2 0.01 0.03
(Base metal) E355K2 0.1 0.01 0.86 0.86 0.01 0.02 0.05 0.02 0.02
Filler metal B€ohler 0.1 – 0.02 0.4 0.14 – – 0.1 0.17
Table 2.Welding parameters
Pass No.
Current (A)
Voltage (V)
Speed
mm/s Efficiency
Welding pool parameters
(mm) a b cf cr
1 80 23.2 2 0.8 4 3 5 8
2 90 23.6 2 0.8 4 3 5 8
3 100 24 2 0.8 4 3 5 8 Fig. 1.Pipe after welding and 2-Dfinite element model with
dimension in (mm)
steel (BM1), the right pipe material is E355K2 (BM2) steel andfiller metal B€ohler is validated. The validation of welding simulation procedure is carried out on a multi-pass butt weld. The results are compared with experimental hardness test. Figure 2 shows measurements with a microscope- mounted camera showing an average of the measurement distance from the surface at a given point. The distances are in millimeter, and the hardness values are in HV10. The hardness distribution from the simulation at the weld of the investigated dissimilar material with welding was calculated by using the rule of mixtures. Maynier et al. [20] have developed a useful method to predict hardness. The total hardness of steel is calculated dependent on the volume fractions of the constituents of the microstructure:
HV¼
FP%$HVF−PþB%$HVBþ þM%$HVM
100: (1) The hardness of the microstructures produced is given by:
HVM ¼127þ949C%þ27Si%þ11Mn%þ þ16Cr%Ni%þ21logvR; (2) HVB¼−323þ185C%þ330Si%þ153Mn%þ
þ144Cr%þ191Mo%þ65Ni%þ þðlogvRÞ 89þ53C%55Si%2Mn%
−20Cr%33Mo%10Ni%
; (3)
HVF−P¼42þ223C%þ53S%iþ30Mn%þ þ7Cr% þ9Mo%þ12:6N%iþ þðlogvRÞ 1019Si%þ8Cr%þ
þ4Ni%þ130V%
; (4)
where: vR is the cooling rate in K/h; HV is the hardness (Vickers); XM, XB, XF and XP are the volume fractions of martensite, bainite, ferrite and pearlite, respectively; HVM, HVB, andHVFþPare the hardness of martensite, bainite and the mixture of ferrite and pearlite, respectively. For the calculating ofHVM,HvB, andHVFþPthe formulas developed by Maynier et al. [17] was used.
Figure 3 showed the temperature profile in dissimilar welds joints was validated. The gray region of modeled cross-section denotes fusion zone where the temperature exceeds the melting point (1,700 8C), and the color lines indicate the fusion line, HAZ1 and HAZ2 of the weld.
Figure 4 gives information about the comparison be- tween the predicted hardness simulation and the actual hardness measurement across weld joints at different regions from the weld centerline near the outer surface.
The hardness test in base metal 1 (BM1) showed a steady but significant rise, which leveled out in HAZ1 and remained steady until the border of HAZ2, where a sharp peak occurs. It then falls rapidly to a level that is higher than that in HAZ2. During the distance of welding 3038 points, as it can be seen, there is good consistency Fig. 2.Pipe after cutting and specimen after hardness
measurement
Fig. 3.Temperature profile in dissimilar welds joints
Fig. 4.Comparison of the hardness measurement with simulation
and acceptable agreement between the simulation and the experimental results.
4. RESULT AND DISCUSSION
4.1. Residual stress results from the 2-D model
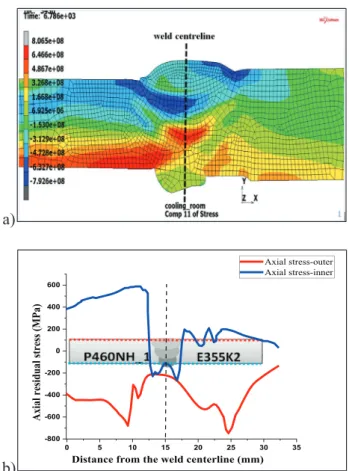
4.1.1. Axial residual stress distribution on the outer and outer surface.After ensuring the validity and reliability of the numerical model,Fig. 5a and bshow the axial residual stress distribution of the dissimilar weld joint. It can be seen that the residual stress distribution in the weld joint is different due to the presence of two different materials. The maximum axial residual stress under tension is located at the interface of the two metals (weld metal and base metal E355K2) and has a magnitude of789 MPa, whereas on the weld metal and base metal P460NH_1 side the maximum is around653 MPa.
4.1.2. Hoop residual stress distribution on the outer and inner surface.Figure 6a and bshows the residual stress dis- tributions along the outer and inner surface. It can be seen that tensile residual stresses are generated on the weld in HAZ1 on the P460NH_1 side in the region between the metal and weld.
The tensile stress for E355K2 increases sharply and reaches maximum stress 557 MPa, which is seen along the HAZ and FZ.
4.1.3. Axial and hoop stress distribution through the thick- ness of welding. Figure 7shows the distribution of axial and hoop residual stresses as a function of the thickness of the weld joint. Axial stress remains consistent through the P460NH reducing through the thickness of the weld joint.
There is an observed increase in the same through the region of E355K2 metal. However, the increase is not sharp but gradual and is around 50 MPa±50 MPa. The residual hoop stress shows a dramatic increase in the magnitude from the P40NH to E355K2 metal going through the weld thickness.
It has a maximum of around 300 MPa±100 MPa.
a)
b)
0 5 10 15 20 25 30 35
-800 -600 -400 -200 0 200 400 600
Distance from the weld centerline (mm)
Axialresidualstress(MPa)
Axial stress-outer Axial stress-inner
Fig. 5.a) Axial residual stress distribution in the weld zone; b) axial stress on the outer and the inner surface
a)
b)
0 5 10 15 20 25 30 35
-800 -600 -400 -200 0 200 400 600
Distance from the weld centerline (mm)
hoopresidualstress(MPa)
hoop stress-outer hoop stress-inner
Fig. 6.a) Hoop residual stress distribution on the outer and inner surface from weld centerline; b) Hoop residual stress distribution
on the outer and inner surface
0 5 10 15 20 25 30 35
-800 -600 -400 -200 0 200 400 600
Residualstress(MPa)
axial stress-middle hoop stress-middle
Distance form the weld centerline (mm)
Fig. 7.Axial and hoop residual stress distribution in the middle
4.2. Residual stress results from the 3-D model
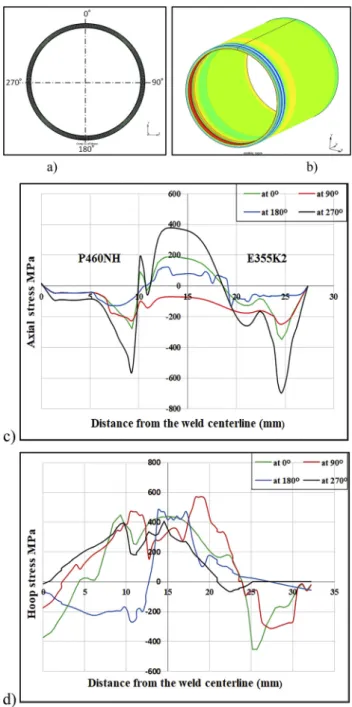
Figure 8a presented the cross section of 3-D model to investigate the residual stress distribution in different loca- tions. To clarify the feature of residual stress distribution, the middle section of pipe weld shown inFig. 8b.Thefinal hoop and axial stress distributions of the middle section are shown in Fig. 8c and d, respectively. It is very clear that both the hoop and axial stresses are much different from each loca- tion. It shows the axial and hoop residual stresses on the outer surface in the angles of 0, 90, 180, and 2708, respec- tively. The maximum compressive axial residual stress pre- dicted by numerical simulation is in the angle of 2708, and
the maximum tensile axial stress is in the angle of 908. The maximum compressive axial stresses in some cases exceeded minimum values of the base metal.
5. CONCLUSION
Numerical simulation of dissimilar P460NH and E355K2 steel weld pipe joint is an effective way to predict the residual stress and hardness test using 2-D and 3-D model. The conclusions drawn from the P460NH and E355K2 weld simulation results are as following:
Both the 3-D FE model and the 2-D FE model predicted very satisfactory temperature cycles and welding residual stress fields. Using the 3-D model, the detailed informa- tion on welding residual stressfields can be captured. The 2-D model cannot provide a minute temperature and residual stresses distributions, but a large amount of computational time can be saved;
Three-dimensional FE analysis is essential to accurately predict the axial and hoop residual stresses in girth welds of steel pipes which change spatially due to the travelling arc and welding start/stop effects;
The distribution characteristics of residual stress distri- bution in the welded pipe can be described as follows. In 2-D modeling, the axial residual stresses on the inside surface and the outside surface have a contrary distribu- tion. In 3-D modeling weld zone and its vicinity in different angles, a tensile axial residual stress is produced on the outside surface, and away from the weld centerline, compressive axial stress is formed. On the outside surface, the shape of hoop stress distribution is very similar to the axial stress. The shape of the hoop stress distribution on the outside surface is very sensitive to the distance from the weld centerline;
Residual stress has a maximum value at a circumfer- ential angle of 2708 in both axial and hoop direction because of changing the weld pool trajectory. On the other hand, the residual stress under tension has a maximum at 908circumferential angle in both axial and hoop directions.
REFERENCES
[1] Z. Virag, “Determination of optimum diameter of a welded stiffened cylindrical shell”,Pollack Periodica, vol. 4, no. 1, pp. 41– 52, 2009.
[2] K. Jarmai and R. Szucs,} “Investigation of welded protective covers for heat treatment”,Pollack Periodica, vol. 15, no. 1, pp. 15–26, 2020.
[3] H. Jaber and T. Kovacs, “Dissimilar resistance spot welding of ferrite-martensite dual phase steel/low carbon steel: Phase trans- formations and mechanical properties”, inVehicle and Automotive Engineering. vol. 2, K. Jarmai and B. Bollo, eds, Springer, pp. 709– 718, 2018.
Fig. 8.a) Definition of the middle section with different angles; b) 3D FEM model; c) Axial residual stress in different angle; d) Hoop
residual stress in different angle
[4] R. Gou, Y. Zhang, X. Xu, L. Sun, and Y. Yang,“Residual stress measurement of new and in-service X70 pipelines by X-ray diffrac- tion method”,NDT&E Int., vol. 44, no. 5, pp. 387–393, 2011.
[5] X. Luo, M. Zhao, J. Li, and C. Duan,“Numerical study on ther- modynamic behavior during selective laser melting of 24CrNiMo alloy steel”,Materials, vol. 13, no. 1, pp. 1–17, 2020.
[6] M. H. Alhafadhi and G. Krallics,“Numerical simulation predic- tion and validation two dimensional model weld pipe”, Mach.
Technol. Mater., vol. 13, no. 10, pp. 447–450, 2019.
[7] M. H. Alhafadhi and G. Krallics,“The effect of heat input pa- rameters on residual stress distribution by numerical simulation”, inIOP Conference Series: Materials Science and Engineering, vol.
613,5th International Conference on Competitive Materials and Technology Processes, Miskolc-Lillafured, Hungary, Oct. 8€ –12, 2018, 2019, pp. 1–6, Paper no. 012035.
[8] M. H. Alhafadhi, M. Sz}ucs, and G. Krallics, “Finite element analysis on the formation of residual stresses during welding of oil and gas pipe”,Int. J. Metall. Mater. Sci. Eng., vol. 8, no. 3, pp. 1– 10, 2018.
[9] A. N. Jameel, N. K. A. Al-Shamib, and O. F. A. Al Latteef,“Re- sidual stress distribution for a single pass weld in pipe”,J. Eng., vol. 16, no. 1, pp. 1–13, 2010.
[10] M. H. Alhafadhi and G. Krallics,“Simulation of the residual stress in a multi-pass oil and gas pipe weld joint”, inJ. Phys. Conf. Ser., vol. 15272020, 4th International Conference on Rheology and Modeling of Materials, 4th International Conference on Rheology and Modeling of Materials, Miskolc-Lillafured, Hungary, Oct. 7– 11, 2019, 2020, pages 1–8, Paper no. 012005.
[11] M. H. Alhafadhi and G. Krallics,“Numerically simulated prediction of residual stresses in welding considering phase transformation effects”, inJ. Phys. Conf. Ser., vol. 1527,4th International Conference on Rheology and Modeling of Materials, Miskolc-Lillafured, Hungary, Oct. 7–11, 2019, 2020, pages 1–8, Paper no. 012017.
[12] H. Vemanaboina, G. Edison, and S. Akella,“Validation of residual stress distributions in multipass dissimilar joints for gtaw process”, J. Eng. Sci. Technol., vol. 14, no. 5, pp. 2964–2978, 2019.
[13] Sz. Szavai, Z. Bezi, and P. Rozsahegyi,“Material characterization and numerical simulation of a dissimilar metal weld”, Proced.
Struct. Integrity, vol. 2, pp. 1023–1030, 2016.
[14] Sz. Szavai, Z. Bezi, and C. Ohms,“Numerical simulation of dis- similar metal welding and its verification for determination of residual stresses”,Frattura Ed. Integrita Strutturale, vol. 36, no. 4, pp. 36–45, 2016.
[15] J. Xu, X. Jia, Y. Fan, A. Liu, and C. Zhang,“Residual stress analyses in a pipe welding simulation: 3D pipe versus axi-symmetric models”,Proced. Mater. Sci., vol. 3, pp. 511–516, 2014.
[16] D. Deng and H. Murakawa,“Numerical simulation of temperature field and residual stress in multi-pass welds in stainless steel pipe and comparison with experimental measurements”, Comput.
Mater. Sci., vol. 37, pp. 269–277, 2006.
[17] L. Zhao, J. Liang, Q. Zhong, C. Yang, B. Sun, and J. Du,“Nu- merical simulation on the effect of welding parameters on welding residual stresses in T92/S30432 dissimilar welded pipe”,Adv. Eng.
Softw., vol. 68, pp. 70–79, 2014.
[18] A. H. Yaghi, T. H. Hyde, A. A. Becker, and W. Sun, “Finite element simulation of residual stresses induced by the dissimilar welding of a P92 steel pipe with weld metal IN625”,Int. J. Press.
Vessels Piping, vol. 111, pp. 173–186, 2013.
[19] J. Goldak, A. Chakravarti, and M. Bibby,“A new finite element model for welding heat sources”, Metall. Trans. B, vol. 15, pp.
299–305, 1984.
[20] P. Maynier, B. Jungmann, and J. Dollet,“Creusot-Loire system for the prediction of the mechanical properties of low alloy steel products”, inSymposium on Hardenability Concepts with Ap- plications to Steel, The Metallurgical Society of AIME, Warren- dale, Pennsylvania, USA, Oct. 24, 1977, 1978, pp. 518–545.
Open Access. This is an open-access article distributed under the terms of the Creative Commons Attribution 4.0 International License (https://creativecommons.org/
licenses/by/4.0/), which permits unrestricted use, distribution, and reproduction in any medium, provided the original author and source are credited, a link to the CC License is provided, and changes–if any–are indicated. (SID_1)