dOi: 10.1556/168.2019.20.2.4
Introduction
Seagrass beds are among the most productive ecosys- tems in coastal areas. Altogether they form one of the larg- est shallow marine ecosystems in the world (approximately 177,000 km2, Green and Short 2003). They occur at the coast of all continents except Antarctica, typically showing higher species richness in tropical compared to temperate regions (Laffoley and Grimsditch 2009). Together with mangroves and coral reefs, seagrasses are among the most important foundation species in coastal tropical areas, with key roles in community structure and ecosystem functioning (Duarte et al.
2008, Unsworth et al. 2015). Seagrasses form natural barriers against land erosion (Ondiviela et al. 2014), promote carbon capture and storage (Warwick 1984, Nagelkerken et al. 2004, Dorenbosch et al. 2005, Duarte et al. 2013), provide nursery grounds for economically important fish species (Unsworth et al. 2014) and supply habitat, shelter and food for a diversity of organisms, varying from invertebrates to marine mammals (Verweij et al. 2006, Valentine and Duffy 2006). Especially in tropical regions, local communities strongly rely on sea- grass meadows as fishing grounds. This dependence might strengthen in the future, as the health of coral reefs is predict- ed to decline (Unsworth et al. 2014, Nordlund et al. 2017).
The ecosystem services provided by seagrass meadows are crucial for the well-being of coastal communities, therefore being viewed as coupled socio-ecological systems (Unsworth et al. 2014).
Seagrass meadows are among the most threatened eco- systems on earth, with global losses estimated up to 7% of areal distribution per year (Waycott et al. 2009). On a global scale, threats are represented by land erosion, eutrophication and mechanical damage due to dredging and anchoring (Orth et al. 2006). Within the Indo-Pacific region, physical dis- turbance of seagrass, eutrophication, pollution, disease and the impacts of river runoff have been identified as the most common threats (Coles et al. 2011). Perturbation of seagrass habitats can lead to considerable changes in the structure of associated communities (Herkül and Kotta 2009, Gartner et al. 2010, Do et al. 2013). However, responses can vary based on local ecosystem conditions and the type, severity and du- ration of perturbations (Coles et al. 2011). These perturba- tions might be reinforced by faunal species benefitting from seagrass declines, especially if these species are also able to act as ecosystem engineers. The resulting regime shift in sea- grass meadows and related communities, can finally lead to profound changes in primary production, carbon sequestra- tion and habitat formation (Kneer et al. 2013, Maxwell et al.
2017).
In this article we present the effects of long-term removal of seagrass canopy on the associated macrofaunal communi- ties in Gazi Bay, Kenya. This study was done in parallel to the work described in Githaiga et al. (2019). The intertidal seagrass meadows in Gazi Bay are intensively used for ar- tisanal fishing activities (Harcourt et al. 2018) and the Bay is home to one of the major fish landing sites in South East
Experimental harvest in a tropical seagrass meadow leads to shift in associated benthic communities
C. Cadier
1,3and A. Frouws
1,21School of Life Sciences, Edinburgh Napier University, 9 Sighthill Court, EH11 4BN Edinburgh, United Kingdom
2Centre for Marine Ecosystem Research, School of Natural Sciences, Edith Cowan University, 100 Joondalup Drive, Joondalup, WA 6027, Australia
3Corresponding author. Email: charlescadier@hotmail.fr
Keywords: Benthic community; Disturbance; Ecosystem functions; Seagrass; Western Indian Ocean.
Abstract: Seagrass meadows represent key ecosystems in coastal areas worldwide, hosting a great biodiversity of associated communities and thereby providing a large range of ecosystem services. In this study we present an experimental approach to investigate the effects of seagrass losses on related macrofauna assemblages. Over a three year period, seagrass canopies were removed in experimental plots and changes in epifauna, infauna and respective functional groups were recorded. The experi- mental removal of seagrass leaves resulted in a decline of 74% of overall macrofaunal abundance and the loss of several taxa.
The immediate response of associated communities was followed by the establishment of an alternative assemblage, character- ized by an increased number of bioturbators and deposit feeders. The colonization of disturbed seagrass plots by burrowing shrimps (Callianassidae) might have hindered the reestablishment of seagrass after the removal. Our findings highlight the important role of seagrasses as habitat forming species that provide relevant functioning and services in coastal ecosystems.
Nomenclature for plants: Green and Short (2003) and Richmond (2011).
Kenya (FAO 2015). These activities resulted in visible scars within the seagrass meadows and are thought to have contrib- uted to the decline of ~2% yr-1 in seagrass coverage between 2000 and 2016 (Harcourt et al. 2018). The overall aim of this study was to identify impact pathways of seagrass perturba- tion by investigating changes in infauna and epifauna abun- dance as well as overall fauna community structure, resulting from seagrass removal.
Material and methods Study site
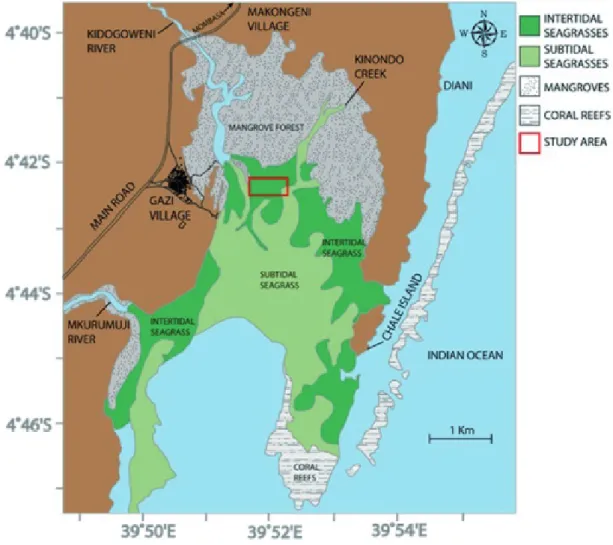
Seagrass meadows located in the intertidal zone of Gazi Bay (S04°25’33”; E39°31’7”), Kwale County, Kenya were selected for this study (Fig. 1). The surface area of Gazi Bay is approximately 13.5 km2 of which 70% is covered by sea- grass (Coppejans et al. 1992). The bay is sheltered by a fring- ing coral reef in the South East and by an extensive mangrove forest in the North East. The tidal range within the bay can be as much as 3.2 m (Kitheka 1997) and the bay receives freshwater input from the seasonal rivers Kidogoweni and
Mkurumuji (Bouillon et al. 2004). Twelve seagrass species are found in Gazi Bay, of which the following four species are most dominant: Enhalus acoroides, Syringodium isoeti- folium, Thalassia hemprichii and Thalassodendron ciliatum (Githaiga et al. 2019). Regular mounts (10-20 cm in height) produced by burrowing shrimps further characterize the inter- tidal and shallow subtidal seagrass meadows within the bay.
This study focused on monospecific meadows of T. hem- prichii and E. acoroides. These seagrass species are both classified as persistent: relatively slow growing, exhibiting a long life-span and resistance to disturbance, thereby fulfill- ing the role of a stable and long-lasting foundation species (Kilminster et al. 2015).
Study design and sampling
In February 2015, eight experimental plots of 3 m × 2 m were randomly selected in the intertidal seagrass meadows of Gazi Bay. In half of the selected plots, aboveground biomass of seagrass was removed on a monthly basis for the entire du- ration of the experiment (harvested plots). The remaining half was left undisturbed and considered as a control. Sampling
13
Table 7. Mean abundance and contribution to dissimilarity (SIMPER analysis) of fourth root transformed macrofaunal taxa averaged between control and harvested plots. Taxa are ranked in order of their contribution (%) to the average Bray-Curtis dissimilarity between both treatments. A cut-off at 45.5% of dissimilarity was applied to the list of taxa.
Figure 1. Map of the sampling area, sampling sites are located in the intertidal seagrass meadows between Kinondo creek and Kidogoweni River (map from Githaiga et al. 2019).
Figure 1. Map of the sampling area, sampling sites are located in the intertidal seagrass meadows between Kinondo creek and Kidogoweni River (map from Githaiga et al. 2019).
started one month after the first removal of seagrass canopy and took place annually in 2015, 2016 and 2017. In order to avoid a seasonal bias in macrofaunal composition, sampling was always performed between February and April.
Infauna samples were taken using cores, while epifauna was collected employing drop samples, randomly placed within the surveyed plots. Cores were taken in accordance with established sampling strategies (e.g., Bowden et al.
2001), extending the core with a diameter of 10.5 cm to a depth of 15 cm. Core samples were placed in freezer bags, transported to the lab and sieved through 500 µm mesh sieves. Seagrass biomass was removed, separated in aboveg- round and belowground biomass, dried at 60°C for 48 h and weighed. All fauna was manually removed from the remain-All fauna was manually removed from the remain- ing sample. For drop samples a metal frame (50 cm × 50 cm) with a height of 40 cm was placed on the sediment at low tide (< 30 cm) and pushed down to seal the sample. Fauna was carefully removed from the water retained in the frame using a 500 μm sieve, keeping sediment resuspension at a minimum in order to avoid sampling of infauna. This process was re- peated until two consecutive sieves did not contain any fauna and the frame could be considered empty. Fauna was stored in a 120 ml sampling jar with seawater and transported to the lab. The sampling followed a nested design with subsam-The sampling followed a nested design with subsam- ples (cores and drop samples) being nested within plots. The sampling effort varied with time, as drop samples were intro- duced in the second year of the study to improve the sampling of epifauna. In addition, differences in resource availability for field work resulted in changes in the number of obtained replicates (Table 1).
All samples were stored in a solution of 10% formalin for a minimum of 48 h, washed and preserved in a solution of 70% ethanol (Eleftheriou and McIntyre 2005). Fauna was identified to the lowest taxonomic level possible (family lev- el) using taxonomic literature specific for the Western Indian Ocean (Day 1967, Smith and Heemstra 1999, Richmond 2011, Wambiji et al. 2015) and descriptions of marine fauna from other regions when necessary (Hayward and Ryland 2000, Alonso 2003, Ngoc-Ho 2003, Haye et al. 2004, Pagliosa 2005, Campbell 2007, Poore and Bruce 2012, Conway 2015, Jumars et al. 2015).
Data analysis
To identify the impact of seagrass canopy removal on fauna, results from cores and drop samples were averaged per plot. Due to the variability in sampling effort (Table 1), a separate one-way ANOVA was performed in R (R Core Team 2012) for each of the three sampling events, testing for differences in faunal abundance and seagrass belowground
Table 1. Variability in sampling effort for epifauna and infauna over the duration of the study.
Sample type Fauna sampled # samples 2015 # samples 2016 # samples 2017
core infauna 2 plot-1 3 plot-1 3 plot-1
dropsample epifauna - 2 plot-1 1 plot-1
Table 2. Biological characteristics used to categorize taxa into functional groups. Functional groups were constructed by a four letter combination of traits presented.
Biological
traits Type modalities Legend
Body type
Soft S
Rigid (exoskeleton) R
Vertebrate V
Calcified (molluscs) C
Adult body size
< 1 mm S
1-5 mm M
> 5 mm L
Feeding behaviour
Predator P
Deposit feeders/grazers D
Suspension feeding S
Omnivorous M
Sediment interaction
Mobile or burrowing B
Tube building T
Pelagic P
Sessile A
Commensal C
Other (interface between
sediment and water) S
Table 3. List of functional groups used in the analysis of com- munity composition. Summarized functional attributes refer to functional groupings from Table 2.
Functional
group number Summarized functional attributes 1 Large burrowing crustaceans and at sediment
surface, mixed feeding and predators 2 Large burrowing and tube-building worms,
omnivorous and predators 3 Deposit feeders and grazers
4 Suspension feeders
5 Large predatory, pelagic fish
6 Predators and omnivores, commensal or water column
7 Small predators and omnivores, sessile or tube- building, commensal or burrowing organisms
biomass between disturbed and control plots. Normality of the data was tested using a Shapiro-Wilk test and the data were transformed when assumptions were not met. The rela- tionship between seagrass belowground biomass and infauna abundance was investigated using linear model (LM) and a linear regression (LR) using Pearson and Spearman correla- tions.
To identify the changes in abundance of specific fauna taxa, an analysis of functional groups was performed. This analysis is similar to Biological Trait Analysis (BTA), using a series of morphological and behavioural characteristics of species to indicate aspects of their ecological functioning (Tilman et al. 1997, Paganelli et al. 2012, Peng et al. 2013, Greenfield et al. 2016). Diet, interaction with sediment, body type and body size were defined for each taxon, based on prior studies of functional groups in macrofauna (Borja et al. 2009, Lavesque et al. 2009, Valença et al. 2012, Gamito et al. 2012, Peng et al. 2013, Rodil et al. 2013, Barnes and Hendy 2015) (Table 2). Macrofauna taxa were summarized in functional groups (Table 3), according to similarities in the aforementioned categories (e.g., grazers were included within the deposit feeders as these two feeding behaviours are often combined in small invertebrates). The groups that showed low abundances in the samples were deliberately included in the analysis, due to their disproportionate importance and ex- pected impact on the system, e.g., large predatory fish.
Community analysis was performed using PRIMER 7 for both taxonomic and functional data (Clarke and Warwick 2001). To reduce the influence of the most dominant taxa, fourth root transformation was applied to abundance data and square root transformation to functional group data (Clarke and Warwick 2001). In order to assess the impact of treat- ment and time on the community, Bray-Curtis similarities were calculated and used for cluster analysis. The results were plotted using non-metric multidimensional scaling (nMDS). Permutational analysis of variance (PERMANOVA, Anderson et al. 2008) was applied for both taxonomic and functional data, to test for differences in community com-
position between treatments and years. To distinguish taxa responsible for community differences between treatments, the SIMPER routine was performed on combined abundance data for epifauna and infauna for the years 2016 and 2017, using Bray-Curtis similarities with treatment and year as fac- tors.
Results
Community structure
Within the fauna samples a total of 71 taxa were iden- tified, with 52 taxa occurring in both epifauna and infauna samples. 33 taxa were found exclusively within control plots, while only 5 taxa (Poecilochaetidae, Trichobranchidae, Sphaerodoridae, Dendrobranchiata and Stomatopoda) were exclusively found in harvested plots. Thirteen taxa were ex- clusively found in infauna samples, of which the majority consisted of polychaete families. Six taxa were exclusively found in epifauna samples, e.g., Chaetognaths and Thaliacea.
Experimental treatment
Average faunal abundance was significantly higher in control plots (14395 ± 4999) compared to harvested plots (3929 ± 1173) for each sampling event and no effect of time was detected (Fig. 2). The removal of seagrass leaves resulted in an average loss of 72% of infauna and 89% of epifauna abundance. In total, the abundance declined by 74% over the study period. Noticeably, within one month after removal of the seagrass canopy, the abundance of infauna had already declined by 76%, but without significant difference between treatments (p = 0.0697); fauna abundance was significantly higher in control plots in 2016 and 2017, compared with har- vested plots (p < 0.01) (Table 4.a). On average, 11 (10) taxa were lost in 2016 (2017), respectively, as a result of seagrass removal. There is no significant difference in seagrass below- ground biomass between treatments in 2015 (p = 0.602) and
Figure 2. Temporal changes in fauna abundance and seagrass biomass sampled above and belowground for control and harvested plots.
Abundance of epifauna sampled by drop sampling (light above baseline) and infauna sampled by cores (dark below baseline) as well as biomass of seagrass leaves (dark above baseline) and seagrass roots and rhizomes (light below baseline) are depicted. Error bars indicate standard error for control (solid) and harvested (striped) treatments. Note that no data on epifauna abundance are available for 2015.
13
Table 7. Mean abundance and contribution to dissimilarity (SIMPER analysis) of fourth root transformed macrofaunal taxa averaged between control and harvested plots. Taxa are ranked in order of their contribution (%) to the average Bray-Curtis dissimilarity between both treatments. A cut-off at 45.5% of dissimilarity was applied to the list of taxa.
Figure 1. Map of the sampling area, sampling sites are located in the intertidal seagrass meadows between Kinondo creek and Kidogoweni River (map from Githaiga et al. 2019).
Figure 2. Temporal changes in fauna abundance and seagrass biomass sampled above and belowground for control and harvested plots. Abundance of epifauna sampled by drop sampling (light blue) and infauna sampled by cores (dark blue) as well as biomass of seagrass leaves (dark green) and seagrass roots and rhizomes (light brown) are depicted. Error bars indicate standard error for control (solid) and harvested (striped) treatments. Note that no data on epifauna abundance is available for 2015.
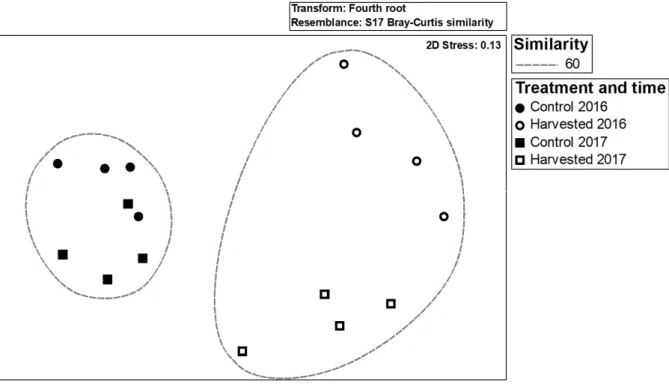
2017 (p = 0.0599), however a significant decline was detected (p = 0.0223) in 2016 (Table 4.b). The LM showed a significant relationship between loss of seagrass belowground biomass and infauna abundance in harvested plots (p < 0.01). The LR showed no significant relationship between infauna abun- dance and seagrass belowground biomass in harvested plots (p =0.15). The macrofauna community analysis resulted in a clear separation of control and harvested treatments, showing a similarity of 60% within the separate clusters, highlighted in the nMDS plot (Fig. 3). Within the group of harvested plots, a temporal separation for sampling events in 2016 and 2017
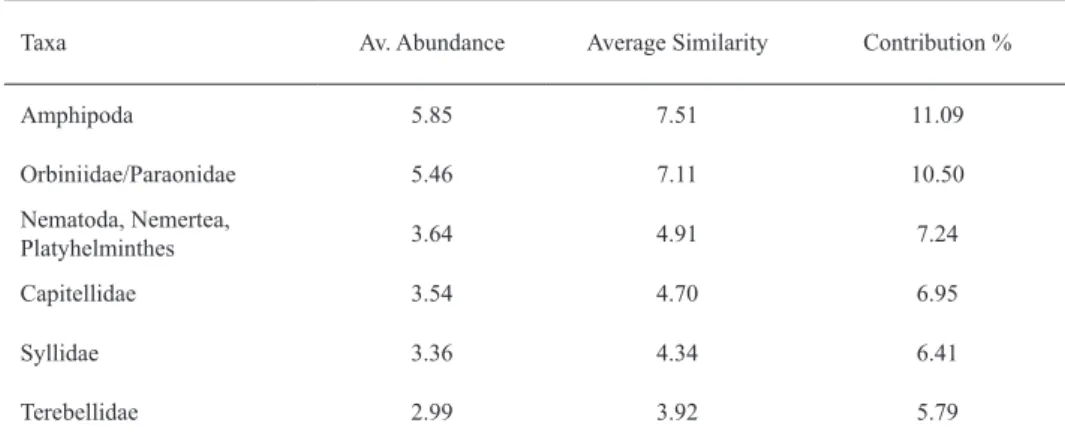
is visible. The control plots show an overall higher similarity than harvested plots. The PERMANOVA confirmed a signifi- cant (p < 0.01) effect of treatment on the community structure, but no effect of time (p = 0.643) (Table 5). The SIMPER anal- ysis revealed that within harvested plots, the taxa Amphipoda, Orbiniidae/Paraonidae, Nematoda/Nemertea/Plathelminthes, Capitellidae and Syllidae are the main contributors to within group similarity (Table 6). Comparing treatments, the taxa Ostracoda, Amphipoda and Asellota as main contributors to community dissimilarity (Table 7).
Table 4. a: ANOVA table for the effect of treatments (Control and Harvested) on infauna abundance in 2015 and on macrofauna abun- dance in 2016 and 2017. b: ANOVA table for the effect of treatments (Control and Harvested) on seagrass belowground biomass in 2015, 2016 and 2017.
a
df 2015 2016 2017
SS F P SS F P SS F P
Treatment 1 178268443 4.859 0.0697 344939491 21.69 0.00348 121156543 16.86 0.00632
Residuals 6 95427647 95427647 43119459
b
df 2015 2016 2017
SS F P SS F P SS F P
Treatment 1 34765 0.302 0.602 314434 9.348 0.0223 412368 5.357 0.0599
Residuals 6 689986 201813 461857
14
Figure 3. nMDS plots of total fauna abundance (treatment and time as fixed factors) for the different experimental plots.
Outcomes of the cluster analysis are superimposed at 60% similarity.
Figure 3. nMDS plots of total fauna abundance (treatment and time as fixed factors) for the different experimental plots. Outcomes of the cluster analysis are superimposed at 60% similarity.
Table 5. PERMANOVA results for effects of the factors treatment and time (both fixed factors) on macrofauna abundance and func- tional group structure. P-values in bold indicate statistical significance at α = 0.05.
Table 6. Mean abundance and Bray-Curtis similarity (SIMPER analysis) of macrofaunal species, averaged for harvested plots. Species are ranked in order of their overall contribution to similarity (%). A cut-off at 50% of overall contribution was applied to the list of taxa.
Macrofauna abundance
Source of variation df SS Pseudo-F P (perm)
Time 1 1141.6 0.47506 0.643
Treatment 2 4806.3 6.5633 0.001
Residuals 12 4393.8
Functional group abundance
Source of variation df SS Pseudo-F P (perm)
Time 1 149.54 0.063456 1
Treatment 2 4713.3 23.142 0.001
Residuals 12 1222
Taxa Av. Abundance Average Similarity Contribution %
Amphipoda 5.85 7.51 11.09
Orbiniidae/Paraonidae 5.46 7.11 10.50
Nematoda, Nemertea,
Platyhelminthes 3.64 4.91 7.24
Capitellidae 3.54 4.70 6.95
Syllidae 3.36 4.34 6.41
Terebellidae 2.99 3.92 5.79
15
Figure 4. Proportion of infauna and epifauna attributed to each of the seven functional groups based on mean abundance values, separated per treatment and year. Functional group numbers are in accordance with Table 3.
2015 2016 2017 2016 2017
Control Harvested Control Harvested
0%
10%
20%
30%
40%
50%
60%
70%
80%
90%
100%
FG 7 FG 6 FG 5 FG 4 FG 3 FG 2 FG 1
Control Harvested Control Harvested Control Harvested 0%
10%
20%
30%
40%
50%
60%
70%
80%
90%
100%
Contribution to faunal community (%)
Infauna Epifauna
Figure 4. Proportion of infauna and epifauna attributed to each of the seven functional groups based on mean abundance values, sepa- rated per treatment and year. Functional group numbers are in accordance with Table 3.
The removal of aboveground seagrass biomass led to al- terations in relative abundance of functional groups (Fig. 4).
The observed pattern of change differs between epifauna and infauna groups. Within infauna, lower abundance of function- al group 7 was recorded for harvested plots (45%) compared to control plots (70%). In contrast, functional groups 2 and 3 showed higher abundances in harvested (50%) than in con- trol (25%) plots. Functional groups 1, 4, 5 and 6 exhibited similar relative abundances for both treatments. For epifauna, functional groups 1 and 5 increased in relative abundance in harvested plots by 10% and 4%, respectively. Functional group 7 declined in relative abundance as a result of the treat- ment, while functional groups 2, 3 and 4 stayed unaffected.
Treatment had a significant effect (p = 0.001) on the relative abundance of functional groups, while time had no effect (p
= 1) (Table 5).
Discussion
The present study on the experimental removal of sea- grass canopy in Gazi Bay revealed major changes in the structure and functional identity of seagrass associated mac- rofauna communities.
The results of this study showed that seagrass canopy facilitates a high fauna density and diversity. Their loss sub- sequent to the first harvest led to a severe disturbance of ben- thic communities. After three years of seagrass removal, the decline in the abundance of epifauna taxa was the most evi- dent, followed by the slightly less affected infauna commu- nity. This decline is in line with results from previous studies obtained under laboratory conditions (Reed and Hovel 2006, Herkül and Kotta 2009, Gartner et al. 2010). This change in abundance and taxon richness could be related to the strong dependence of infauna on seagrass as habitat, food and pro- tection from predation (Orth et al. 1984, Bologna and Heck 1999, Sirota and Hovel 2006). However, it is not known which of those factors acted as main driver of infauna loss after a relatively short time of disturbance. The impact of the loss of seagrass aboveground biomass on infauna was imme- diate and its abundance, community structure and functional group composition did not significantly differ in time. After the first harvest, infauna abundance stabilised in disturbed plots within only one month. The same process was observed for epifauna abundance between 2016 and 2017. This stabili- sation could be the result of a quick recolonization of the bar- ren area by new macrofauna communities, highlighted by the nMDS and PERMANOVA. The reduction of habitat quality, Table 7. Mean abundance and contribution to dissimilarity (SIMPER analysis) of fourth root transformed macrofaunal taxa averaged between control and harvested plots. Taxa are ranked in order of their contribution (%) to the average Bray-Curtis dissimilarity between both treatments. A cut-off at 45.5% of dissimilarity was applied to the list of taxa.
Taxa Group Control
Av. Abundance Group Harvested
Av. Abundance Contribution %
Apseudomorpha 5.36 0.99 4.92
Ostracoda 5.11 0.76 4.90
Amphipoda 9.35 5.85 3.93
Asellota 3.04 0.00 3.40
Buccinoidea 3.01 0.18 3.19
Echinodermata 3.00 0.18 3.18
Apseudomorpha (hermit) 3.33 0.77 3.05
Isopoda (other) 3.16 0.62 2.88
Leptostraca 2.93 0.62 2.88
Anthuroidea 2.69 0.31 2.64
Nereididae 2.83 0.62 2.46
Diogenidae 2.46 0.57 2.15
Ampharetidae 2.12 1.12 2.15
Tanaidomorpha 4.22 2.42 2.13
Sabellidae 1.87 0.3 2.00
Cirratulidae 2.01 1 1.95
Hesionidae 2.53 0.46 1.92
due to seagrass leaf removal, is described in the literature as the main driver of this macrofauna community shift (Bourque et al. 2015). All taxa contributing up to 50% of dissimilar- ity between treatment groups were more abundant in control than harvested groups. These taxa exhibit a variety of feed- ing modes and behaviours, e.g., the predatory snails from the family Buccinoidea and the deposit feeding polychaetes from the family Cirratulidae. The importance of seagrass as feeding ground is assumed to be directly linked to this high diversity in associated fauna feeding strategies (Orth et al.
1984, Lee et al. 2001, Paula et al. 2001).
The change in the structure of associated macrofauna communities in harvested plots was mainly characterized by the significant decline of a few taxa parallel to the increase of several taxonomic groups. In particular, a decrease in small crustaceans was observed, in combination with increases in opportunistic (e.g., Nematoda, Nemertea, Platyhelminthes, Capitellidae and Syllidae) and tube dwelling or burrow- ing taxa (e.g., Capitellidae, Terebellidae and Orbiniidae/
Paraonidae) (Kalejta and Hockey 1991, Rosenberg et al.
2001, Campos and Burgos 2015). The removal of seagrass leaves dramatically lowered the habitat complexity, there- fore facilitating the occurrence of opportunistic species with broader habitat requirements (Airoldi et al. 2008). The ob- served increase in burrowing activity, presumably related to Caliannassid shrimp (Githaiga et al. 2019), could have prevented an effective recolonization of the barren areas by seagrass. Burrowing shrimp are considered ecosystem engi- neers and can rework impressive amounts of sediment in the intertidal and subtidal regions (Kneer et al. 2013). In general, seagrasses are assumed to be dominant ecosystem engineers, but disturbances as applied in this experiment, could have favoured the colonization by burrowing shrimp, initiating the competitive exclusion of seagrasses (Castorani, 2014).
However, the relationship between seagrass and burrowing shrimp varies depending on the considered zone within the intertidal. At the upper tidal level, seagrasses benefit from tid- al pools created by burrowing shrimp, since they retain water during low tide (Kneer et al. 2013). In the present study, the harvest of seagrass (in the mid intertidal) led to potentially less productive and less resilient macrofaunal communities, as the overall taxon richness declined and variability in- creased (Edgar 1990, Hemminga and Duarte 2000).
Seagrass leaf removal also had effects on the functional composition of the related communities. As seagrass mead- ows provide shelter for associated fauna, their loss most likely increased the predation pressure in the harvested plots (Orth et al. 1984). As a matter of fact, small organisms were the most affected, and showed a severe decline in both in- fauna and epifauna communities (functional group 7, Fig.
4). In general, the changes in functional groups were more pronounced within the infauna, potentially linked to the presence of Caliannassid shrimps, which are able to modify the sediment characteristics by their burrowing activity and therefore modulate the overall habitat (Berkenbusch et al.
2007). Large tube dwelling and burrowing polychaetes and crustaceans, deposit feeders and grazers (functional groups 1, 2 and 3, Fig. 4), representing the 5 taxa exclusively found in
harvested plots, seemed to benefit from seagrass harvest. This might be related to the loss of seagrass rhizomes; a sharp de- cline in belowground seagrass biomass (roots and rhizomes) was recorded one year after removing the leaves, in 2016, but belowground biomass declined further in 2017 (Fig. 3). The loss of belowground seagrass biomass would have allowed large burrowing and tube-building organisms to move more efficiently in the sediment and thereby lowering the likeli- hood of encountering predators (Skilleter 1994, Leopardas et al. 2014). The increased abundance of deposit feeders and grazers when seagrass canopy is removed, is likely the result of increased bioturbation. Since the availability of organic material fragments in less stable sediment can provide an im- portant food source for deposit feeders and grazers (Stoner et al. 1980).
The observed changes in functional composition can re- sult in alterations in ecosystem functioning. The increased proportion of burrowing macrofauna might be directly linked to the magnitude of bioturbation in the ecosystem, particu- larly associated to the Caliannassid shrimp (Suchanek and Colin 1986, Thomson et al. 2018). Simultaneously, sediment transport away from the meadow is promoted by the loss of structuring roots and rhizomes, which is expected to result in lower carbon storage in the sediment (Berkenbusch et al.
2007, Airoldi et al. 2008, Blackburn and Orth 2013). This has been confirmed by the results described in Githaiga et al (2019), with a mean carbon loss of 2.21 Mg C ha-1 in the top 5 cm of the sediment, as a result of seagrass canopy re- moval, and a potential additional loss of 2.54 Mg C ha-1 due to erosion of the sediment over an 18 months period. In addi- tion, increased sediment loads in the water column can also hamper recovery of seagrass meadows from a disturbance through, among others, light limitation and the lack of sta- ble sediment for seagrass ramets and/or seed settlement (Orth et al. 2006, Maxwell et al. 2017). Hence, within our study, the loss of seagrass canopy initiated a transition towards less diverse communities dominated by bioturbating fauna, with important consequences on the sediment stability and associ- ated carbon storage.
Conclusion
In a long-term approach we demonstrated the effects of losses in seagrass cover on biotic and abiotic habitat charac- teristics. The structure and functional identity of associated macrofauna communities changed immediately after the dis- turbance and showed no recover until the end of the study. We suggest that changes in functional groups and the alteration of associated bioturbation processes prevented the effective re- colonization by seagrasses. The establishment of bioturbators has the potential to lower the resilience and productivity of the ecosystem, enhancing the release of organic carbon from the sediment.
Authors’ contributions: C.C. and A.F. contributed equally to this article.
Acknowledgments. The authors acknowledge the Kenya Marine and Fisheries Research Institute (KMFRI) for accom- modating this research at the Gazi Bay substation. Especially, we would like to thank the substation director Dr. J. G. Kairo, Dr. M. N. Githaiga, the field assistants Laitani Suleiman and Tom Peter Kisiengo, alongside all members of this substa- tion for their help during these experiments. We are indebt- ed to Donna Ridland for assistance with taxonomy and to Paula Sánchez Zulueta for sample processing. We also thank Edinburgh Napier University for funding our stay in Gazi Bay and are specifically grateful to Pr. M. Huxham for his support and advice all along this study.
References
Airoldi, L., Balata, D. and Beck, M.W. 2008. The Gray Zone:
Relationships between habitat loss and marine diversity and their applications in conservation. J. Exp. Mar. Biol. Ecol. 366:8–15.
Alfaro, A.C. 2006. Benthic macro-invertebrate community com- position within a mangrove/seagrass estuary in northern New Zealand. Estuar. Coast. Shelf. Sci. 66:97–110.
Alonso De Pina, G.M. 2003. A new species of Phoxocephalidae and some other records of sand-burrowing Amphipoda (Crustacea) from Argentina. J. Nat. Hist. 37:1029–1057.
Anderson, M., Gorley, R.N. and Clarke, R.K. 2008. Permanova+
for primer: Guide to software and statistical methods. Primer-E Limited, Plymouth, UK.
Barnes, R.S.K. and Hendy, I.W. 2015. Functional uniformity under- lies the common spatial structure of macrofaunal assemblages in intertidal seagrass beds. Biol. J. Linn. Soc. 115:114–126.
Berkenbusch, K., Rowden, A.A. and Myers, T.E. 2007. Interactions between seagrasses and burrowing ghost shrimps and their influ- ence on infaunal assemblages. J. Exp. Mar. Biol. Ecol. 341:70–
84.
Blackburn, N.J. and Orth, R.J. 2013. Seed burial in eelgrass Zostera marina: the role of infauna. Mar. Ecol. Prog. Ser. 474:135–145.
Bologna, P.A. and Heck Jr, K.L. 1999. Macrofaunal associations with seagrass epiphytes: relative importance of trophic and structural characteristics. J. Exp. Mar. Bio. Ecol. 242:21-39.
Borja, A., Muxika, I. and Rodríguez, J.G. 2009. Paradigmatic re- sponses of marine benthic communities to different anthropo- genic pressures, using M-AMBI, within the European Water Framework Directive. Mar. Ecol. 30:214–227.
Bouillon, S., Moens, T. and Dehairs, F. 2004. Carbon sources sup-Carbon sources sup- porting benthic mineralization in mangrove and adjacent sea- grass sediments (Gazi Bay, Kenya). Biogeosciences Discuss.
1:311-333.
Bourque, A.S., Kenworthy, W.J. and Fourqurean, J.W. 2015. Impacts of physical disturbance on ecosystem structure in subtropical seagrass meadows. Mar. Ecol. Prog. Ser. 540:27-41.
Bowden, D A., Rowden, A. and Attrill, M.J. 2001. Effect of patch size and in-patch location on the infaunal macroinvertebrate as- semblages of Zostera marina seagrass beds. J. Exp. Mar. Biol.
Ecol. 259:133–154.
Campbell, A. 2007. Seashores and Shallow Seas of Britain and Europe. Bounty Books, London, UK.
del Norte-Campos, A.G. and Burgos, L.A. 2015. Interannual Variability of Macrofaunal Assemblages in a NaGISA Sea- grass Site in Southern Guimaras, Philippines Subjected to Anthropogenic and Natural Disturbances. Philipp. Agric. Sci. 98.
Castorani, M.C., Hovel, K.A., Williams, S.L. and Baskett, M.L.
2014. Disturbance facilitates the coexistence of antagonistic eco- system engineers in California estuaries. Ecology 95:2277-2288.
Clarke, K.R. and Warwick, R.M. 2001. Changes in Marine Communities: an Approach to Statistical Analysis and Interpretation. 2nd Edition. PRIMER-E Ltd, Plymouth, UK.
Coles, R. et al. 2011. Seagrass ecology and threats in the tropical Indo-Pacific bioregion. In: R.S. Pirog (ed.), Seagrass: Ecology, Uses and Threats. Nova Science Publishers, New York. pp. 225- 240.
Conway, D.V.P. 2015. Marine Zooplankton of southern, Part 3:
Ostracoda, Stomatopoda, Nebaliacea, Mysida, Amphipoda, Isopoda, Cumacea, Euphausiacea, Decapoda, Annelida, Tardigrada, Nematoda, Phoronida, Bryozoa, Entoprocta, Brachiopoda, Echinodermata, Chaetognatha, Hemichordata.
Mar. Biol. Assoc. Occas. Pub. l:1–271.
Coppejans, E., Beeckman, H. and Wit, M. De. 1992. The seagrass and associated macroalgal vegetation of Gazi Bay (Kenya).
Hydrobiologia 247:59–75.
Day, J.H. 1967. A Monograph of the Polychaeta of Southern Africa.
British Museum of Natural History, Publication 656:1–878.
Do, V.T., Blanchet, H., Montaudouin, X. de and Lavesque, N. 2013.
Limited Consequences of seagrass decline on benthic macrofau- na and associated biotic indicators. Estuar. Coast. 36:795–807.
Dorenbosch, M., Grol, M.G.G., Christianen, M.J., Nagelkerken, I.
and van der Velde, G. 2005. Indo-Pacific seagrass beds and man- groves contribute to fish density and diversity on adjacent coral reefs. Mar. Ecol. Prog. Ser. 302:63–76.
Duarte, C.M., Dennison, W.C., Orth, R.J.W. and Carruthers, T.J.B.
2008. The charisma of coastal ecosystems: Addressing the im- balance. Estuar. Coast. 31:233–238.
Duarte, C.M., Kennedy, H., Marbà, N. and Hendriks, I. 2013.
Assessing the capacity of seagrass meadows for carbon burial:
Current limitations and future strategies. Ocean Coast. Manag.
83:32–38.
Edgar, G.J. 1990. The influence of plant structure on the species rich- ness, biomass and secondary production of macrofaunal assem- blages associated with Western Australian seagrass beds. J. Exp.
Mar. Bio. Ecol. 137:215–240.
Eleftheriou, A. and McIntyre, A. (eds). 2005. Methods for the Study of Marine Benthos. Blackwell, Oxford.
Gamito, S., Patrício, J., Neto, J.M., Teixeira, H. and Marques, J.C.
2012. Feeding diversity index as complementary information in the assessment of ecological quality status. Ecol. Indic. 19:73–
78.
Gartner, A., Lavery, P.S., McMahon, K., Brearley, A. and Barwick, H. 2010. Light reductions drive macroinvertebrate changes in Amphibolis griffithii seagrass habitat. Mar. Ecol. Prog. Ser.
401:87–100.
Gray, J.S. and Michael, E. 2009. Ecology of Marine Sediments. From Science to Management. Oxford University Press, Oxford.
Githaiga, M.N., Frouws, A.M., Kairo, J.G. and Huxham, M. 2019.
Seagrass removal leads to rapid changes in fauna and loss of carbon. Front. Ecol. Evol. 7:1–12.
Green, E.P. and Short, F.T. 2003. World Atlas of Seagrasses.
University of California Press, Berkeley, USA.
Greenfield, B.L., Kraan, C., Pilditch, C.A. and Thrush, S.F. 2016.
Mapping functional groups can provide insight into ecosystem functioning and potential resilience of intertidal sandflats. Mar.
Ecol. Prog. Ser. 548:1–10.
Harcourt, W.D., Briers, R.A. and Huxham, M. 2018. The thin(ning) green line? Investigating changes in Kenya’s seagrass coverage.
Biol. Letters 14:20180227.
Haye, P.A., Kornfield, I. and Watling, L. 2004. Molecular insights into Cumacean family relationships (Crustacea, Cumacea). Mol.
Phylogenet. Evol. 30:798–809.
Hayward, P.J. and Ryland, J.S. (Eds). 2000. Handbook of the Marine Fauna of North-West Europe. Oxford University Press, New York, USA.
Hemminga, M.A. and Duarte, C.M. 2000. Seagrass Ecology.
Cambridge University Press, Cambridge, UK.
Hendriks, I.E., Sintes, T., Bouma, T.J. and Duarte, C.M. 2008.
Experimental assessment and modeling evaluation of the effects of the seagrass Posidonia oceanica on flow and particle trapping.
Mar. Ecol. Prog. Ser. 356:163–73
Herkül, K. and Kotta, J. 2009. Effects of eelgrass (Zostera marina) canopy removal and sediment addition on sediment characteris- tics and benthic communities in the Northern Baltic Sea. Mar.
Ecol. 30:74–82.
Jumars, P. A., Dorgan, K.M. and Lindsay, S.M. 2015. Diet of worms emended: an update of polychaete feeding guilds. Appendix A.
Annu. Rev. Mar. Sci. 7:497–520.
Kalejta, B. and Hockey, P.A.R. 1991. Distribution, abundance and productivity of benthic invertebrates at the Berg River estuary, South Africa. Estuar. Coast. Shelf Sci. 33:175-191.
Kilminster, K., McMahon, K., Waycott, M., Kendrick, G.A., Scanes, P., McKenzie, L., ... and Glasby, T. 2015. Unravelling complex- ity in seagrass systems for management: Australia as a micro- cosm. Sci. Total Environ. 534:97-109.
Kitheka, J.U. 1997. Coastal tidally-driven circulation and the role of water exchange in the linkage between tropical coastal ecosys- tems. Estuar. Coast. Shelf Sci. 45:177–187.
Kneer, D., Asmus, H. and Jompa, J. 2013. Do burrowing callianassid shrimp control the lower boundary of tropical seagrass beds? J.
Exp. Mar. Biol. Ecol. 446:262-272.
Laffoley, D. and Grimsditch, G. 2009. The Management of Natural Coastal Carbon Sinks. Gland, Switzerland.
Lavesque, N., Blanchet, H. and Montaudouin, X. de. 2009.
Development of a multimetric approach to assess perturbation of benthic macrofauna in Zostera noltii beds. J. Exp. Mar. Biol.
Ecol. 368:101–112.
Lee, S.Y., Fong, C.W. and Wu, R.S.S. 2001. The effects of seagrass (Zostera japonica) canopy structure on associated fauna: A study using artificial seagrass units and sampling of natural beds. J.
Exp. Mar. Biol. Ecol. 259:23–50.
Leopardas, V., Uy, W. and Nakaoka, M. 2014. Benthic macrofaunal assemblages in multispecific seagrass meadows of the southern Philippines: Variation among vegetation dominated by different seagrass species. J. Exp. Mar. Biol. Ecol. 457:71–80.
Maxwell, P.S., Eklöf, J.S., van Katwijk, M.M., O‘brien K,R,, de la Torre-Castro, M., Boström, C., ... and van der Heide, T. 2017.
The fundamental role of ecological feedback mechanisms for the adaptive management of seagrass ecosystems–a review. Biol.
Rev. 92:1521–1538.
Nagelkerken. I., Velde, G. Van Der, Dorenbosch, M., Van Riel, M.C., De La Moriniere, E.C. and Nienhuis, P.H. 2004. How important are mangroves and seagrass beds for coral-reef fish? The nurs- ery hypothesis tested on an island scale. Mar. Ecol. Prog. Ser.
244:299–305.
Ngoc-Ho, N. 2003. European and Mediterranean thalassinidea (Crustacea, Decapoda). Zoosystema 25:439–555.
Nordlund, L.M., Unsworth, R.K.F., Gullström, M. and Cullen- Unsworth, L.C. 2017. Global significance of seagrass fishery activity. Fish and Fisheries 19:1–14.
Ondiviela, B., Losada, I.J., Lara, J.L., Maza, M., Galván, C., Bouma, T.J. and van Belzen, J. 2014. The role of seagrasses in coastal protection in a changing climate. Coast. Eng. 87:158–168.
Orth, R.J., Carruthers, T.J.B., Dennison, W.C., Duarte, C.M., Fourqurean, J.W., Heck, K.L., ... and Short, F.T.2006. A global crisis for seagrass ecosystems. Bioscience 56:987–997.
Orth, R.J., Heck, K.L. and Monfrans, J. van. 1984. Faunal communi- ties in seagrass beds: a review of the influence of plant struc- ture and prey characteristics on predator-prey relationships.
Estuaries 7:339–350.
Paganelli, D., Marchini, A. and Occhipinti-Ambrogi, A. 2012.
Functional structure of marine benthic assemblages using Biological Traits Analysis (BTA): A study along the Emilia- Romagna coastline (Italy, North-West Adriatic Sea). Estuar.
Coast. Shelf. Sci. 96:245–256.
Pagliosa, P.R. 2005. Another diet of worms: The applicability of polychaete feeding guilds as a useful conceptual framework and biological variable. Mar. Ecol. 26:246–254.
Paula, J., Fidalgo Ecosta, P., Martins, A. and Gove, D. 2001. Patterns of abundance of seagrasses and associated infaunal communi- ties at Inhaca Island, Mozambique. Estuar. Coast. Shelf Sci.
53:307–318.
Peng, S., Zhou, R., Qin, X., Shi, H. and Ding, D. 2013. Application of macrobenthos functional groups to estimate the ecosystem health in a semi-enclosed bay. Mar. Pollut. Bull. 74:302–310.
Poore, G.C.B. and Bruce, N.L. 2012. Global diversity of marine isopods (except Asselota and crustacean symbionts). PLoS One 7:e43529.
Reed, B.J. and Hovel, K.A. 2006. Seagrass habitat disturbance:
how loss and fragmentation of eelgrass Zostera marina influ- ences epifaunal abundance and diversity. Mar. Ecol. Prog. Ser.
326:133-143.
Richmond M.D. (ed.). 2011. A Field Guide to the Seashores of Eastern Africa and the Western Indian Ocean Islands. Sida, Norwich, UK.
Rodil, I.F., Lohrer, A.M., Hewitt, J.E., Townsend, M., Thrush, S.F.
and Carbines, M. 2013. Tracking environmental stress gradients using three biotic integrity indices: Advantages of a locally-de- veloped traits-based approach. Ecol. Indic. 34:560–570.
Rosenberg, R., Nilsson, H.C. and Diaz, R.J 2001. Response of ben- thic fauna and changing sediment redox profiles over a hypoxic gradient. Estuar. Coast. Shelf. Sci. 53:343-350.
Sirota, L. and Hovel, K.A. 2006. Simulated eelgrass Zostera marina structural complexity: effects of shoot length, shoot density, and surface area on the epifaunal community of San Diego Bay, California, USA. Mar. Ecol. Prog. Ser. 326:115-131.
Skilleter, G.A. 1994. Refuges from predation and the persistence of estuarine clam populations. Mar. Ecol. Prog. Ser. 109:29–42.
Smith, M.M. and Heemstra, P.C. 1999. Smith’s Sea Fishes. Southern Book Publishers, Southern Africa.
Stoner, A.W. 1980. The role of seagrass biomass in the organization of benthic macrofaunal assemblages. B. Mar. Sci. 30:537–557.
Suchanek, T.H. and Colin, P.L. 1986. Rates and effects of bioturba- tion by invertebrates and fishes at Enewetak and Bikini Atolls. B.
Mar. Sci. 38:25–34.
Thomson, A.C., Trevathan-Tackett, S.M., Maher, D.T., Ralph, P.J.
and Macreadie, P.I. 2018. Bioturbator-stimulated loss of seagrass sediment carbon stocks. Limnol. Oceanogr. 64:342–356.
Tilman, D., Knops, J., Wedin, D. and Reich, P.B. 1997. The influence of functional diversity and composition on ecosystem processes.
Science 277:1300–1302.
Unsworth, R.K.F., Collier, C.J., Waycott, M., Mckenzie, L.J. and Cullen-Unsworth, L.C. 2015. A framework for the resilience of seagrass ecosystems. Mar. Pollut. Bull. 100:34–46.
Unsworth, R.K.F., Hinder, S.L., Bodger, O.G and Cullen-Unsworth, L.C. 2014. Food supply depends on seagrass meadows in the coral triangle. Environ. Res. Lett. 9:094005.
Valença, A.P.M.C. and Santos, P.J.P. 2012. Macrobenthic community for assessment of estuarine health in tropical areas (Northeast, Brazil): review of macrofauna classification in ecological groups and application of AZTI Marine Biotic Index. Mar. Pollut. Bull.
64:1809–1820.
Valentine, J.F. and Duffy, J.E. 2006. The central role of grazing in seagrass ecology. In: A.W.D. Larkum et al. (eds.), Seagrasses:
Biology, Ecology, and Conservation. Springer, Dordrecht. pp.
463-501.
Verweij, M.C., Nagelkerken, I., Graaff, D. De, Peeters, M., Bakker, E.J. and Van der Velde, G. 2006. Structure, food and shade attract juvenile coral reef fish to mangrove and seagrass habitats: A field experiment. Mar Ecol Prog Ser 306:257–268.
Wambiji, N., Odido, M., Appeltans, W., Bel Hassen, M., Mussai, P., Nsiangango, S.E., ... and Jiddou, A.M.2015. African Register of Marine Species http://www.marinespecies.org/afremas/. Viewed 1 Aug 2015.
Warwick, R.M. 1984. Species size distributions in marine benthic communities. Oecologia 61:32–41.
Waycott, M., Duarte, C.M., Carruthers, T.J.B, Orth, R.J., Dennison, W.C., Olyarnik, S., ... and Kendrick, G.A. 2009. Accelerating loss of seagrasses across the globe threatens coastal ecosystems.
P. Natl. Acad. Sci. USA 106:12377-12381.
Received May 11, 2018 Revised June 12, 2018, March 11, 2019 Accepted June 24, 2019