DOCTORAL (Ph.D.) DISSERTATION
HUU ANH DANG
UNIVERSITY OF KAPOSVÁR
FACULTY OF AGRICULTURAL AND ENVIRONMENTAL SCIENCES
2019
KAPOSVÁR UNIVERSITY
FACULTY OF AGRICULTURAL AND ENVIRONMENTAL SCIENCES Department of Physiology and Animal Hygiene
The head of the Doctoral School Prof. Dr.KOVÁCS MELINDA
Corresponding member of the Hungarian Academy of Sciences
Supervisor
Dr.ZSOLNAI ATTILA Scientific advisor
INTERACTION OF FUMONISIN MYCOTOXINS AND GASTROINTESTINAL MICROBIOTA IN
SHEEP AND SWINE
Created by
HUU ANH DANG
KAPOSVÁR 2019
DOI: 10.17166/KE2019.003
1 1. Contents
1. Contents ... 1
2. Research background and objectives ... 2
2.1. Research background
... 2
2.2. Objectives
... 4
3. Materials and methods ... 5
3.1. In vitro interaction between fumonisin B1 and the intestinal microflora of pigs
... 5
3.2. In vitro effect of fumonisin B1 on the ruminal microflora of sheep
... 6
3.3. In vivo experiment: Effect of Fumonisins producing Fusarium verticillioides to the microbiota of pigs
... 6
3.4. Methods of quantitative measurement of bacteria
... 6
3.4.1. Media and plate count agar technique applying to measure living bacteria in the in vitro and in vivo experiments in pigs
... 6
3.4.2. Quantitative polymerase chain reaction applying to measure the DNA copy numbers of bacteria
... 8
3.5. Mycotoxin extraction and analysis
... 9
3.6. Statistical analysis
... 10
4. Results ... 11
4.1. In vitro interaction between fumonisin B1 and the intestinal microflora of pigs
... 11
4.2. In vitro effect of fumonisin B1 on the ruminal microflora of sheep
... 12
4.3. In vivo experiment: Effect of Fumonisins producing Fusarium verticillioides to the microbiota of pigs
... 13
5. Conclusions ... 15
5.1. In vitro interaction between fumonisin B1 and the intestinal microflora of pigs
... 15
5.2. In vitro effect of Fumonisin B1on the ruminal microflora of sheep
... 15
5.3. In vivo experiment: Effect of Fumonisins producing Fusarium verticillioides to the microbiota of pigs
... 15
6. New scientific results... 16
Publications related to the topic of dissertation ... 17
Publications not related to the topic of dissertation ... 18
2
2. Research background and objectives
2.1. Research background
The fumonisins, first isolated by Gelderblom et al. (1988) are a group of mycotoxins produced by many Fusarium species mostly by Fusarium proliferate and Fusarium verticillioides (former name is Fusarium moniliforme). Fumonisins are found mainly in maize, all over the world. The presence of fumonisin B1 (FB1) is the most frequent among fumonisins in maize, representing about 60% of total fumonisins (Voss et al., 2011).
The chemical structure of fumonisins consists of a stable carbon chain which is similar to Sphinganine (Sa) and Sphingosine (So). Therefore, fumonisins can interrupt the process of sphingolipid synthesis playing a crucial role to build lipoprotein, cell wall and regulation of metabolism. Then fumonisins, in relatively high doses and after a prolonged feeding, have led to harmful effects of human and animal health (Quinn et al., 2011) such as cause esophageal cancer in human (IARC, 1993), porcine pulmonary edema (PPE), equine leukoencephalomalacia (ELEM) and liver damage in multiple species including pigs, horses, cattle, rabbits, and primates; kidney damage in rats, rabbits, and sheep (Smith, 2007). It is very important to know the effects of fumonisin on the digestion and/or to the cell systems. However, a few studies have been conducted to determine the interaction between fumonisin and gut microbiota.
The scientific information about the impact of fumonisins on bacterial activities is very sparse. To the best of our knowledge, there was only one report from Becker (1997) about the direct effect of fumonisins on some certain bacteria strains in an in vitro experiment. As the results, a large amount of bacteria did not differ significantly between control and treated groups after incubation. However, fumonisins can impact the immune systems of the host by leading the change of the amount of intestinal bacteria,
3
especially pathogenic bacteria. Fumonisins have been caused immunotoxicity in mice (Abbès et al., 2015) and reduce the phagocytic activity of chicken macrophages (Chatterjee and Mukherjee, 1994). When Japanese quails were infected with Salmonella gallinarum, increased mortality and decreased lymphocyte number was observed in FB1 treated group at 150 mg/kg feed for 6 weeks (Deshmukh et al., 2005). Colonization of the small and large intestines by an extra intestinal pathogenic E.coli strain was significantly proliferated when pigs were treated with 0.5 mg of FB1/kg of body weight for 7 days (Oswald et al., 2003). In case of co-occurrence of fumonisins and other mycotoxins, especially aflatoxin, fumonisins also intensified the calf susceptibility to Shigatoxin or verotoxin producing E. coli (STEC) associated with hemorrhagic enteritis (Baines et al., 2013). Burel (2013) reported that chronic exposure to a medium concentration of fumonisins in the naturally contaminated feed (11.8 mg/kg for 63 days) had no effect on the pigs’ health but induced the proliferation of Salmonella.
There are results indicating that certain microbes can change structure or toxicity of a given mycotoxin, or they can protect the organism from the deteriorating effect of the toxin. Bacteria can metabolize or bind fumonisins directly or inhibit fumonisin production of moulds. As for inhibition of fumonisins, Lactobacillus rhamnosus can effectively inhibit FB1 production in a range from 78.64% to 92.88% efficiency and significantly reduces adverse effects of FB1 to liver and kidney of the rat. (Al-Masri et al., 2011).
This bacterial strain can diminish FB2 production up to 43.4% in experimental groups (Stiles and Bullerman, 2002). Pseudomonas solanacearum and Bacillus subtilis strongly inhibited FB1 production in the range from 70% to 100% (Cavaglieri et al., 2005; Formenti et al., 2012). The concentration of FB1 was reduced by Lactobacillus subsp. paracasie after 20-day incubation (70.5 µl/ml compared with 300 µl/ml FB1 in control group) and Lactobacillus paracasie subsp. Paracasie can inhibit FB1 production in 10-day incubation (Gomah and Zohri, 2014). In an other report, FB1 level in maize was
4
decreased by Lactobacillus sp. activity after 3-day fermentation (Mokoena et al., 2005). A significant reduction of FB1 production and growth of Fusarium verticillioides was reported when cultured with Propionibacterium freudenreichii subsp. shermanii and ssp. Freudenreichii (Gwiazdowska et al., 2008). The concentration of FB1 and FB2 were also reduced significantly by Bacillus amyloliquefaciens, Microbacterium oleovorans and Enterobacter hormaechei (Pereira et al., 2007; Pereira et al., 2010; Sartori et al., 2013).
FB1 was hydrolyzed and deaminated by a bacterial strain isolated from soil after 3 hour period of incubation (Benedetti et al., 2006). FB1 was also degraded by Bacillus sp. isolated from corn and silage in the range from 43%
to 83% after 6-day incubation. Two bacterial enzymes from Sphingpyxis sp.
MTA144 were demonstrated that they can degrade FB1 (Heinl et al., 2010).
Some bacteria can bind fumonisins, Niderkorn (2006) reported that 82% FB1 can be removed by Leuconostoc mesenteroides and 100% FB2 can be eliminated by Lactococcus latis. Streptococcus and Enterococcus also have a significant effect on FB1 and FB2 level, these bacteria bind FB1 and FB2 up to 24 and 62%, respectively (Niderkorn et al., 2007).
This research was carried out to estimate the interaction of fumonisin mycotoxins and the gastrointestinal microbiota in sheep and swine using ex vitro and in vivo experiments.
2.2. Objectives
The aim of the research was to determine the interaction between fumonisins and the gastrointestinal microbiota from the following aspects:
1 - The effect of fumonisin mycotoxin on the bacterial communities of the gastrointestinal tract in sheep and swine.
2 - The effect of the microorganisms of the gastrointestinal tract of swine on the metabolism of fumonisin.
5
3. Materials and methods
Three experiments were performed in this research:
Experiment 1: In vitro interaction between fumonisin B1 and the intestinal microflora of pigs
Experiment 2: In vitro effect of fumonisin B1 on the ruminal microflora of sheep
Experiment 3: In vivo experiment: Effect of Fumonisins producing Fusarium verticillioides on the microbiota of pigs
3.1. In vitro interaction between fumonisin B1 and the intestinal microflora of pigs
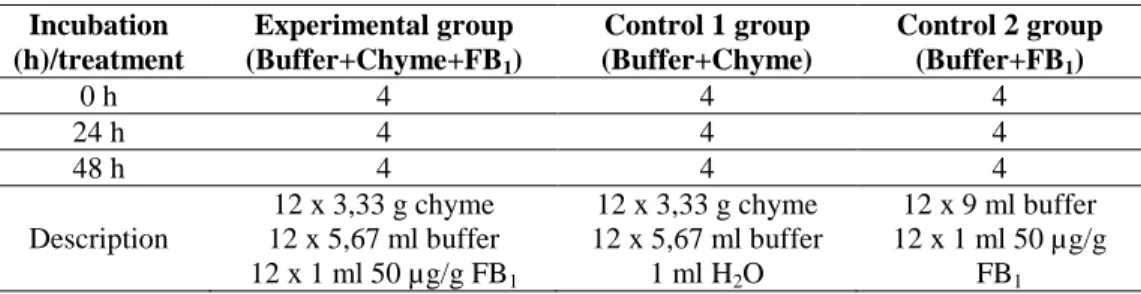
Samples of caecal content were collected from adult pigs right after slaughtering in a slaughter house and transferred into sterile bottles in anaerobic condition. The pre-incubated (24h/37oC/anaerobic) McDougall buffer solution (9.8 g NaHCO3, 3.7 g anhydrous Na2HPO4, 0.57 g KCl, 0.47 g NaCl, 0.12 g MgSO4.7H2O, 0.04 g CaCl2 and 1000 ml aquadest; pH 8.3) was prepared to homogenise samples and make the solution for control groups. The experiment was designed with 3 groups as shown in Table1. To determine the effect of FB1 on the caecal bacteria, the culturing method and quantitative PCR (qPCR)were applied for measuring the amount of bacteria in the experimental group and control 1 group. To estimate the metabolism of FB1 by caecal bacteria, FB1 and HFB1 concentration from experimental group and control 2 group were measured by Liquid Chromatography and Mass Spectrometry (LC-MS).
Table 1: Experimental design to determine In vitro interaction between fumonisin B1 and the intestinal microflora of pigs
Incubation (h)/treatment
Experimental group (Buffer+Chyme+FB1)
Control 1 group (Buffer+Chyme)
Control 2 group (Buffer+FB1)
0 h 4 4 4
24 h 4 4 4
48 h 4 4 4
Description
12 x 3,33 g chyme 12 x 5,67 ml buffer 12 x 1 ml 50 µg/g FB1
12 x 3,33 g chyme 12 x 5,67 ml buffer
1 ml H2O
12 x 9 ml buffer 12 x 1 ml 50 µg/g
FB1
6
3.2. In vitro effect of fumonisin B1 on the ruminal microflora of sheep The experiment was designed similarly 3.1 with the replacement of the caecal content by the ruminal content. Two groups were set up including the experimental group (buffer, ruminal content, FB1) and control group (buffer, ruminal content). The effect of FB1 on the ruminal bacteria was determined by qPCR.
3.3. In vivo experiment: Effect of Fumonisins producing Fusarium verticillioides to the microbiota of pigs
The piglets were weighed and then divided into two groups: an experimental group (n = 6) and a control group (n = 6). After a 7-day adaptation period, according to the method of Tossenberger et al. (2000), a T-cannula was implanted into the caecum, in order to determine the effect of FB1 on the microbiota of the caecum. After the regeneration period, a Fusarium verticillioides fungal culture was mixed into the ration of the experimental animals, so as to provide a daily FB1 intake of 10 mg/animal.
In the period of Fusarium verticillioides feeding (9 days) samples of caecal content were taken on days 0, 2, 4, 6 and 8 through the T-cannula and transferred into sterile tubes. The tubes of samples on days 0., 4. and 8 were prepared for microbial culturing. Approximately 1 g of post- incubated sample was collected and subsequently homogenised with 9 ml of peptone salt solution. Then the 10-folds series dilution was conducted from 10-1 to 10-8. Samples from all tubes in the collecting points of time were stored in the deep freezer (-86 oC) until qPCR analysis.
3.4. Methods of quantitative measurement of bacteria
3.4.1. Media and plate count agar technique applying to measure living bacteria in the in vitro and in vivo experiments in pigs
The plate count technique on selected media was applied for determining the amount of bacteria. Approximately 1 g of post-incubated sample was
7
collected and subsequently homogenised with 9 ml of peptone salt solution.
The 10-folds series dilution was conducted from 10-1 to 10-8. An aliquot (100 µl) was pipetted and added to the surface of each respectively selected agar to culture bacteria. Five groups of bacteria were enumerated, in the in vitro experiments in pigs, including aerobic bacteria, anaerobic bacteria, coliform, Escherichia coli (E. coli) and Lactobacillus sp. while in the in vivo experiment, one bacterial strain was counted besides those ones, Clostridium perfringens (C. perfringens). The aerobic and anaerobic bacteria were cultured in commercial blood agar (BA; Bak-Teszt Ltd., Budapest, Hungary).
Coliform and Escherichia coli population were estimated on ChromoBio Coliform Agar (BioLab). The amount of Lactobacillus sp.was determined by using MRS agar (BioLab). For enumeration of C. perfringens, the pour plating technique with Tryptose sulphite cycloserine (TSC) agar (ISO7937 – VWR Chemical) was applied. The same amount of diluted sample (100 µl) was pipetted and mixed with TSC agar (10 ml) in the petri dish. Then the other 10 ml TSC agar was utilised to cover with a thick layer after complete solidification of the previous medium.
The colony forming units/g (CFU/ g) were calculated using the following formula:
N=ΣC/Vx1,1xd
ΣC is the sum of the colonies counted on the two dishes retained from two successive dilutions, at least one of which contains a minimum of 10 colonies
V is the volume of inoculums placed in each dish, in millilitres d is the dilution corresponding to the first dilution retained
8
3.4.2. Quantitative polymerase chain reaction applying to measure the DNA copy numbers of bacteria
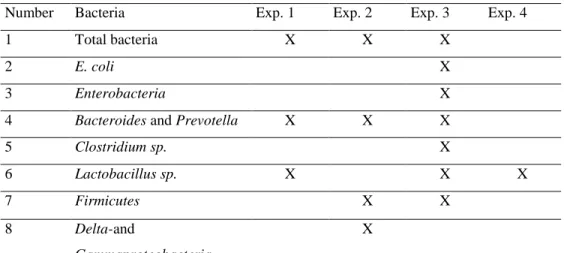
The qPCR was performed to investigate DNA copy numbers of bacteria in all experiments in this research (Table 2)
Table 2. Bacterial groups investigated in the research
Number Bacteria Exp. 1 Exp. 2 Exp. 3 Exp. 4
1 Total bacteria X X X
2 E. coli X
3 Enterobacteria X
4 Bacteroides and Prevotella X X X
5 Clostridium sp. X
6 Lactobacillus sp. X X X
7 Firmicutes X X
8 Delta-and
Gammaproteobacteria
X
Exp. : Experiment
DNA extraction and qPCR
The DNA extraction was carried out with approximately 200 mg of the frozen samples using the QIAamp®DNA Stool Mini Kit according to the manufacturer’s instructions.
The standard curve was created by series of dilution of purified PCR products for Lactobacillus sp., Firmicutes, Delta- and Gammaproteobacteria whereas the series of dilution of plasmid concentration was used to prepare the standard curve for total bacteria, E.coli, Enterobacteria, C. perfringens, Bacteroides and Prevotella.
The quantity of bacterial groups was determined by quantitative PCR using SYBR Green. The primers for the investigated bacterial groups were selected based on scientific literature. QPCR was conducted in a 25 µl/tube reaction mixture containing 12.5 µl Brillant II SYBR QPCR Low Rox Master Mix
9
(Agilent Technologies, CA, USA), 0.2 µM of each primer, 10.5 µl sterile DEPC treated distilled water and 1 µl of DNA extract. The PCR program for total bacteria, Enterobacteria, E.coli, Bacteroides and Prevotella consisted of 10 min at 95 °C, 40 cycles of 30 sec at 95 °C, 1 min at 60 °C. The PCR program for Firmicutes, Delta- and Gammaproteobacteria were: 10 min at 95 °C, 40 cycles of 15 sec at 95 °C, 1 min at 60 °C. To investigate the amount of Clostridium sp., the PCR program was 3 min at 95 °C, 40 cycles of 40 sec at 95 °C, 40 sec at 54 °C, 80 sec at 72 °C and the end cycle was 3 min at 72 °C. All samples were measured in triplicates. The bacterial content of the samples was calculated by comparison with the standard curve derived from series of dilution. The obtained copy numbers of the samples were adjusted to one gram of sample contents.
3.5. Mycotoxin extraction and analysis
For FB1 extraction, the post-incubated samples from the experimental group and the control-2 group were diluted 2-fold (7 ml sample and 7 ml distilled water) and centrifuged for 5 minutes (3000 rpm). The supernatant was used for FB1 extraction followed by the modified protocol of Sep-Pak C18 cartridges (Waters Co., Milford, MA, USA) (Fodor et al., 2014). The column preconditioning was conducted with 2 ml of methanol then 2 ml of distilled water. The diluted sample (2 ml) was subsequently loaded onto the columns then washed again with 2 ml of distilled water. The elution of FB1 was completed by 2 ml of water/acetonitrile mixture, 1:1 v/v.
Liquid chromatography and mass spectrometry (LC-MS) analysis were performed by a Shimadzu Prominence UFLC separation system equipped with an LC-MS-2020 single quadrupole (ultra-fast) liquid chromatograph mass spectrometer (Shimadzu, Kyoto, Japan) with the electrospray source.
Optimised mass spectra were obtained with an interface voltage of 4.5 kV, a detector voltage of 1.05 kV in negative mode, 1.25 kV in positive mode.
10
Samples were analysed on a Phenomenex Kinetex 2.5μ C18(2)-HST column (100 mm × 2.00 mm). The column temperature was set to 40 °C;
the flow rate was 0.3 ml/minute. The gradient elution was performed using LC-MS grade water (VWR Hungary, Debrecen) (eluent A) and acetonitrile (eluent B), both acidified with 0.1% acetic acid. 10 µL of each sample were analysed with a gradient: (0 min) 5% B, (3 min) 60% B, (8 min) 100% B, followed by a holding time of 3 min at 100% eluent B and 2.5 minicolumn re-equilibration at eluent 5% B. FB1 (diluted from 1000 mg/L) and HFB1
(diluted from 25 mg/L) standard solutions were used as references. MS parameters: source block temperature 90 °C; desolvation temperature 250
oC; heat block temperature 200 oC; drying gas flow 15.0 l/minute.
Detection was performed using selected ion monitoring (SIM) mode.
The efficiency of FB1 conversion to fully hydrolysed FB1or aminopentol (HFB1) was calculated on the basis of the molecular weight of the compounds (FB1: 721 g/mol; HFB1: 405 g/mol) and described as below:
hydrolysed fumonisin B1 (mol/g) x 721 g/mol 405 g/mol x Fumonisin B1 (mol/g) 3.6. Statistical analysis
The R i386 3.1.2 program and the IBM SPSS 22 program were applied for statistical analyses. The comparison means were performed by Independent Samples t-Test, oneway ANOVA with Tukey post-hoc test and non- parametric Kruskal-Wallis test if the normal distribution was not presented.
The Repeated measures ANOVA was used to analyse the colony forming units (CFUs) as well as the amount of bacterial DNA copy number during the incubation time.
11 4. Results
4.1. In vitro interaction between fumonisin B1 and the intestinal microflora of pigs
The reduction of FB1 concentration was observed after 24 h and 48 h of the incubation time compared with the ones in control 2 groups while the HFB1 (metabolized products of FB1) concentration grew up from 0.33% to 0.66%
during the period of incubation time (24 h to 48 h) (Table 3).
Table 3: Fumonisin B1 and Hydrolysed Fumonisin B1 concentration (µg/ml) in control and experimental groups during the incubation time.
Incubation time Compound
0 hour 24 hour 48 hour
Control
2 Experiment Control
2 Experiment Control
2 Experiment
FB1 6.433 ±
0.076
5.185 ± 0.175
6.338b ± 0.108
4.080a ± 0.065
4.587b ± 0.085
2.747a ± 0.548
HFB1 0 0 0 0.012
(0.33%) 0 0.024 ± 0.004 (0.66%)
a, b significant (P < 0.05) difference between the control and experimental groups
%: The conversion of FB1 to HFB1
Table 4: Number of bacteria in the pigs’ caecal chyme incubated with (experimental group) and without (control 1 group) fumonisin B1 measured by culturing
(log10 CFU1/g, means ± SD) Bacteria
Incubation time
0 hour 24 hour 48 hour
Control 1 Exp. Group Control 1 Exp. group Control 1 Exp. group Aerob 7.58 ± 0.07 7.49 ± 0.09 7.49 ± 0.258 7.55 ± 0.15 7.31 ± 0.19 7.26 ± 0.22 Anaerob 9.05c ± 0.04 9.02c ± 0.05 8.76b ± 0.05 8.74b ± 0.19 8.39a ± 0.148.34a ± 0.08 E. coli 5.87 ± 0.07 5.89 ± 0.07 5.99 ± 0.33 5.58 ± 0.11 5.87 ± 0.66 6.16 ± 0.83 Coliforms 5.39 ± 0.12 5.33 ± 0.06 5.69 ± 0.29 5.44 ± 0.11 5.84 ± 0.55 5.99 ± 0.86 Lactobacillus 7.87 ± 0.09 7.76 ± 0.04a 8.04 ± 0.09 7.99 ± 0.06b 7.93 ± 0.12 8.01 ± 0.11b
1CFU: colony forming unit
a, b, c significant (P < 0.01) difference between incubation times within groups.
Exp. group: Experimental group
12
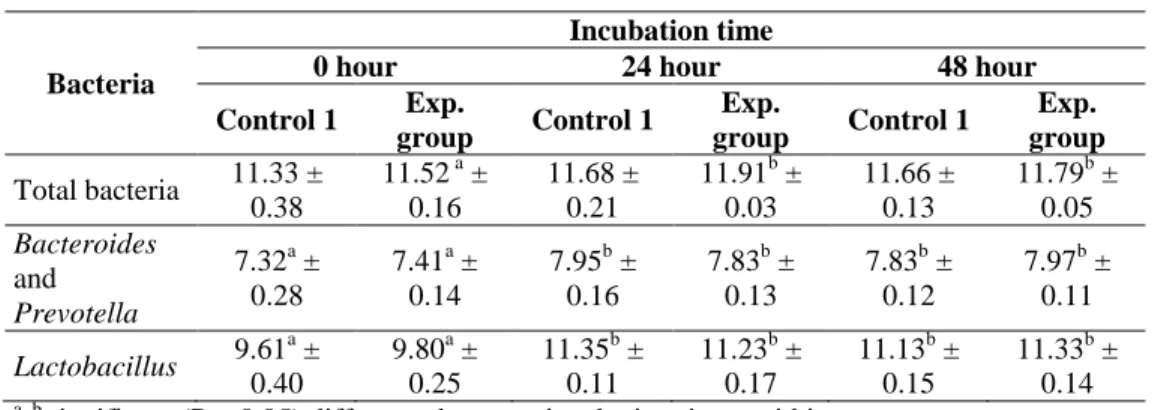
Table 5: Number of bacteria in the pigs’ caecal chyme incubated with (experimental group) and without (control 1 group) fumonisin B1 measured by qPCR
(log10 copy number/g, means ± SD)
Bacteria
Incubation time
0 hour 24 hour 48 hour
Control 1 Exp.
group Control 1 Exp.
group Control 1 Exp.
group Total bacteria 11.33 ±
0.38
11.52 a ± 0.16
11.68 ± 0.21
11.91b ± 0.03
11.66 ± 0.13
11.79b ± 0.05 Bacteroides
and Prevotella
7.32a ± 0.28
7.41a ± 0.14
7.95b ± 0.16
7.83b ± 0.13
7.83b ± 0.12
7.97b ± 0.11 Lactobacillus 9.61a ±
0.40
9.80a ± 0.25
11.35b ± 0.11
11.23b ± 0.17
11.13b ± 0.15
11.33b ± 0.14
a, b significant (P < 0.05) difference between incubation times within groups.
Exp. group: Experimental group
No significant difference of the amount of caecal bacteria was presented between control 2 and experimental group by classical culturing and qPCR technique (Table 4 and 5) though there have been some changes of the number of bacteria within each group. After 48 hour incubation, by culturing the number of aerobic bacteria, anaerobic bacteria, E. coli, Coliforms and Lactobacillus in the experimental groups were 7.26 ± 0.22, 8.34 ± 0.08, 6.16
± 0.83, 5.99 ± 0.86 and 8.01 ± 0.11 compared with 7.31 ± 0.19, 8.39 ± 0.14, 5.87 ± 0.66, 5.84 ± 0.55 and 7.93 ± 0.12 (log10CFU/g) in the control 1 group, respectively. By qPCR, the number of total bacteria, Lactobacillus, Bacteroides-Prevotella were 11.79 ± 0.05, 7.97 ± 0.11 and 11.33 ± 0.14 compared with 11.66 ± 0.13, 7.83 ± 0.12 and 11.13 ± 0.15 (log10 copies number/g), respectively.
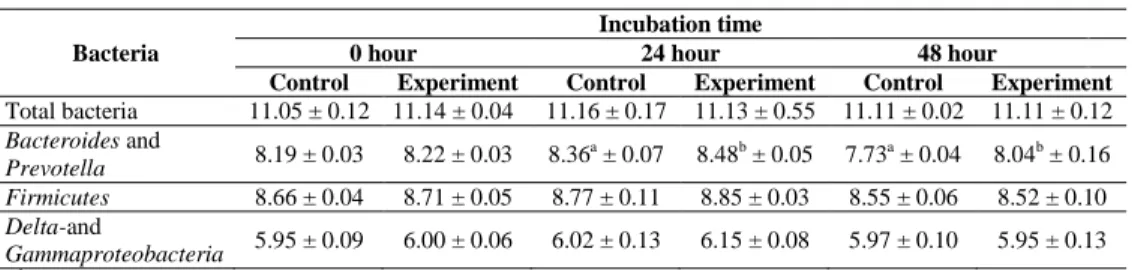
4.2. In vitro effect of fumonisin B1 on the ruminal microflora of sheep The significant differences between control and experimental groups were observed only in the Bacteroides and Prevotella group (Table 6) 8.36 ± 0.07 and 7.73 ± 0.04 compared with 8.48 ± 0.05 and 8.04 ± 0.16 (log10 copy number/g), respectively.
13
Table 6: Number of bacteria in the sheep’s ruminal content incubated with (experimental group) and without (control-1 group) fumonisin B1 measured by QPCR
(log10 copy number/g, means ± SD) Bacteria
Incubation time
0 hour 24 hour 48 hour
Control Experiment Control Experiment Control Experiment Total bacteria 11.05 ± 0.12 11.14 ± 0.04 11.16 ± 0.17 11.13 ± 0.55 11.11 ± 0.02 11.11 ± 0.12 Bacteroides and
Prevotella 8.19 ± 0.03 8.22 ± 0.03 8.36a ± 0.07 8.48b ± 0.05 7.73a ± 0.04 8.04b ± 0.16 Firmicutes 8.66 ± 0.04 8.71 ± 0.05 8.77 ± 0.11 8.85 ± 0.03 8.55 ± 0.06 8.52 ± 0.10 Delta-and
Gammaproteobacteria 5.95 ± 0.09 6.00 ± 0.06 6.02 ± 0.13 6.15 ± 0.08 5.97 ± 0.10 5.95 ± 0.13
a, b
significant (P < 0.05) difference between both groups
4.3. In vivo experiment: Effect of Fumonisins producing Fusarium verticillioides to the microbiota of pigs
There were some differences between control and experimental groups in the amount of aerobic bacteria at Day_4 (Table 7) 8.60 ± 0.22 compared with 8.06 ± 0.20 (log10 CFU1/g), respectively.
Table 7: Number of bacteria in the pigs’ caecal chyme with (experimental group) and without (control group) fumonisin B1 measured by culturing (log10 CFU1/g, means ± SD)
Period of the feeding time
Groups
Day0 Day4 Day8
C E C E C E
Aerobe 8.44 ± 0.10 8.06 ± 0.41 8.60b ± 0.22 8.06a ± 0.20 8.56 ± 0.48 8.13 ± 0.62 Anaerobe 8.65 ± 0.07 8.68 ± 0.35 9.36 ± 0.33 9.26 ± 0.17 9.42 ± 0.22 9.35 ± 0.05 E. coli 7.68 ± 1.12 7.27 ± 0.21 7.70 ± 0.29 7.23 ± 1.08 7.32 ± 0.47 7.41 ± 0.95
Coliforms 6.72 ± 0.96 6.48 ± 0.64 6.98 ± 0.44 6.33 ± 0.09 6.07 ± 0.56 6.37 ± 0.55 Lactobacillus
sp. 7.86 ± 0.14 8.16 ± 0.56 8.44 ± 0.34 8.17 ± 0.38 8.35 ± 0.55 8.16 ± 0.67 Clostridium
perfringens 4.63 ± 0.06 4.21 ± 0.62 3.55 ± 0.68 3.42 ± 0.91 3.15 ± 0.61 3.38 ± 0.89 Exp. group: Experimental group
1CFU: colony forming unit
a, b: significant (P < 0.05) difference between the control and experimental groups.
By qPCR (Table 8) total bacteria at Day_2 and Day_6 (12.48 ± 0.22 and 12.12 ± 0.28 compared to 12.11 ± 0.27 and 12.43 ± 0.21, respectively), Firmicutes at Day_2 (10.52 ± 0.14 compared with 10.36 ± 0.10), E.coli and
14
Enterobacteria at Day_4 (9.65 ±0.35 and 10.60 ± 0.39 compared with 8.97
±0.50 and 9.88 ± 0.38, respectively) exhibited significant differences between control and experimental group. However, no significant difference between the two groups was observed in the entire period of feeding time.
Table 8: Number of bacteria in the pigs’ caecal content with (experimental group) and without (control group) Fusarium measured by QPCR (log10 copy number/g, means ± SD)
Period of the feeding time
Bacteria Day0 Day2 Day4 Day6 Day8
C E C E C E C E C E
Total bacteria 12.37
± 0.18 12.46
± 0.09 12.48b
± 0.22 12.11a
± 0.27 11.99
± 0.28 11.95
± 0.13 12.12a
± 0.28 12.43b
± 0.21 12.48
± 0.14 12.48
± 0.08
Bacteroides and Prevotella
9.20 ± 0.32
9.18 ± 0.37
9.28 ± 0.43
8.79 ± 0.49
8.79 ± 0.60
8.62 ± 0.67
8.86 ± 0.67
8.88 ± 0.46
8.79 ± 0.58
8.81 ± 0.71
Clostridium sp.
8.34 ± 0.58
8.26 ± 0.41
8.31 ± 0.39
8.74 ± 0.50
9.35 ± 0.47
8.98 ± 0.49
9.28 ± 0.32
8.93 ± 0.31
9.19 ± 0.42
9.08 ± 0.31
Escherichia coli
9.49 ± 0.84
9.64 ± 0.46
9.38 ± 0.51
8.87 ± 0.83
9.65b
± 0.35
8.79a ± 0.50
9.68 ± 0.58
9.14 ± 1.14
9.51 ± 0.59
9.34 ± 0.84
Enterobacteria 10.11
± 0.86 10.24
± 0.43 9.98 ±
0.56
9.78 ± 0.74
10.60b
± 0.39
9.88a ± 0.38
10.52
± 0.55 9.82 ±
1.05
9.71 ± 0.52
9.61 ± 0.84
Firmicutes 10.55
± 0.14 10.52
± 0.07 10.52b
± 0.14 10.36a
± 0.10 10.36
± 0.11 10.30
± 0.08 10.26
± 0.17 10.27
± 0.15 10.24
± 0.09 10.26
± 0.05
Lactobacillus sp.
10.34
± 1.07 10.06
± 0.91 10.12
± 0.87 10.39
± 0.47 9.88 ±
0.87
10.19
± 0.57
9.98 ± 0.75
10.16
± 0.50 10.07
± 0.98 9.91 ±
0.79 C - Control group; E - Experimental group
a, b significant (P < 0.05) difference between control and experimental groups
15
5. Conclusions
5.1. In vitro interaction between fumonisin B1 and the intestinal microflora of pigs
Fumonisin B1 was metabolised by pig caecal microorganisms but the amount of investigated bacterial species has not changed between the groups with and without FB1. Other kinds of microorganisms should be concerned in the upcoming experiments and the interaction between fumonisins and gut microbiota in the in vivo experiments is to be conducted.
5.2. In vitro effect of Fumonisin B1on the ruminal microflora of sheep The amount of Bacteroides and Prevotella in the experimental group was higher than in the control group while no difference was observed in total bacteria. Other experiments should be carried out to clarify the relationship between FB1 and Bacteroides and Prevotella according to the result of this study.
5.3. In vivo experiment: Effect of Fumonisins producing Fusarium verticillioides to the microbiota of pigs
Fusarium verticillioides can change the bacterial growth but only in some short feeding points of time. The longer time of experiment should be performed to achieve more information about the influence of Fusarium verticillioides synthesized mycotoxin on the intestinal microorganisms.
16
6. New scientific results
1. For the first time, several types of pigs’ caecal bacteria were investigated by dependent and independent culturing techniques in the in vitro interaction with FB1, including total bacteria, aerobic, anaerobic bacteria and several specific intestinal bacteria such as Coliform, E. coli, Enterobacteria, Lactobacillus, Bacteroides and Prevotella. However, no significant differences were observed between control 1 group (caecal content without FB1) and experimental group (caecal content with FB1).
2. The result of this research highlighted that FB1 induces the increase of Bacteroides and Prevotella group, 8.04 ± 0.16 compared with 7.73 ± 0.04 (log10 copy number/g), after 48-hour incubation.
3. The in vivo study screened the change of several types of the pigs’ caecal bacteria during Fusarium verticillioides feeding treatment (FB1 intake of 10 mg/animal/day equally). Changes of some bacteria in some points of feeding times have been detected. By plate count agar technique, the difference between control groups and experimental group was only presented in aerobic bacteria at Day_4. By qPCR significantly different log10 copy number/g were observed between the control and experimental groups in total bacteria at Day_2 and Day_6; in Firmicutes at Day_2; in E.coli and Enterobacteria at Day_4. For details, see Section 4.3.
17
Publications related to the topic of dissertation
Articles:
1. Dang Huu Anh, Attila Zsolnai, Melinda Kovács, Nguyen Bá Hien (2016). Doc to nam moc fumonisin (2016). Khoa hoc ky thuat thu y / Veterinary sciences and techniques. Vol.
23, No. 7, 85-88.
2. Huu Anh Dang, Éva Varga-Visi, Attila Zsolnai (2016). Analysis of fumonisins: A review.
Tap chi khoa hoc Nong nghiep Viet Nam / Vietnam Journal of Agricultural Sciences. Vol.14, No. 10, 1639-1649.
3. Huu Anh Dang, Attila Zsolnai, Melinda Kovács, István Bors, András Bónai, Bóta Brigitta, Judit Szabó-Fodor (2017). In vitro interaction between fumonisin B1 and the intestinal microflora of pigs. Polish Journal of Microbiology, Vol. 66, No. 2, 245-250. IF 0.746, Q3.
4. Huu Anh Dang, Attila Zsolnai, Melinda Kovács, Brigitta Bóta, Gábor Mihucz, Roland Pósa, Kinga Marosi, Mariam Kachlek, Judit Szabó-Fodor (2019). Effect of fumonisins producing Fusarium verticillioides on the microbiota in pig caecum. Acta Veterinaria Brno.
In press: (2019) IF 0.422, Q3.
Conferences:
5. Huu Anh Dang (2015). Microbiological Methods in Control of Fumonisin Mycotoxins. In:
Dávid Ágota, Dávid Ádám, Kardon Béla (szerk.). Excellent Science in ASEAN: Best Selected Papers and Posters from Young ASEAN Scientists on Water, Food and Health. 126 p. Konferencia helye, ideje: Budapest, Magyarország, 2015.03.17 -2015.03.19.
Budapest: Regional Centre for Information and Scientific Development (RCISD), 2015. p.
124. (ISBN:978-963-12-1839-8).
6. Huu Anh Dang, Attila Zsolnai, Melinda Kovács, István Bors, András Bónai, Bóta Brigitta, Judit Szabó-Fodor (2016). In vitro interaction between fumonisin B1 and the caecal microbiota of pigs. In: Dušan Kovačević (szerk.). VII International Scientific Agriculture Symposium "Agrosym 2016": Book of abstracts. 1226 p. Konferencia helye, ideje: Jahorina, Bosznia-Hercegovina, 2016.10.06-2016.10.09. Sarajevo: University of East Sarajevo, Faculty of Agriculture, 2016. p. 516. (ISBN:978-99976-632-6-9).
18
Publications not related to the topic of dissertation
1. Attila Zsolnai, Réka Szántó-Egész, Edit Ferencz-Elblinger, Anh Dang Huu, Anna Jánosi, Erika Koppányné Szabó, István Anton (2017). Loop-Mediated Isothermal Amplification based approach as an alternative to Recombinase Polymerase Amplification based detection of Mangalitza component in food products. Acta Alimentaria, An International Journal of Food Science. Vol. 46, No. 3, 383-388. IF 0.357