DOCTORAL (Ph.D.) DISSERTATION
HUU ANH DANG
UNIVERSITY OF KAPOSVÁR
FACULTY OF AGRICULTURAL AND ENVIRONMENTAL SCIENCES
2019
KAPOSVÁR UNIVERSITY
FACULTY OF AGRICULTURAL AND ENVIRONMENTAL SCIENCES Department of Physiology and Animal Hygiene
The head of the Doctoral School Prof. Dr.KOVÁCS MELINDA
Corresponding member of the Hungarian Academy of Sciences
Supervisor
Dr.ZSOLNAI ATTILA
INTERACTION OF FUMONISIN MYCOTOXINS AND GASTROINTESTINAL MICROBIOTA IN
SHEEP AND SWINE
Created by
HUU ANH DANG
KAPOSVÁR 2019
DOI: 10.17166/KE2019.003
3
ABBREVIATION
BA: Blood agar
bw: body weight
CFU: Colony forming unit
CPC: Centrifugal partition chromatography
DON: Deoxynivalenol
DNA: Deoxyribonucleic acid
ELEM: Equine leukoencephalomalacia ELISA: Enzyme-linked immunosorbent assay FA, FB, FC, FP: Fumonisin A, B, C, P
GC-MS: Gas chromatography-mass spectrometry GIT: Gastrointestinal tract
HPLC: High performance liquid chromatography
IAC: Immunoaffinity columns
LC-MS: Liquid chromatography-mass spectrometry
Mab: Monoclonal antibodies
MRS: de Man, Rogosa, Sharpe
NGS: Next generation sequencing PCR: Polymerase chain reaction
PPE: Porcine pulmonary edema
4
qPCR: Quantitative polymerase chain reaction
RNA: Ribonucleic acid
SPE: Solid phase extraction
SAX: Strong anion-exchange
TLC: Thin layer chromatography
TSC: Tryptose sulfite cycloserine
ZEA: Zearalenone
5 1. Contents
1. Contents ... 5
List of the tables ... 7
List of the figures ... 8
2. Introduction ... 9
3. Literature review... 12
3.1. Fumonisin mycotoxins and the analytic methods ... 12
3.1.1. Chemical structure of fumonisins ... 12
3.1.2. The metabolized fumonisin products and their toxicity ... 14
3.1.3. Analysis of fumonisin mycotoxins by liquid chromatography – mass spectrometry method ... 16
3.2. Gastrointestinal microflora in pigs, sheep and the quantitative methods 18 3.3. Interactions between fumonisins and bacteria ... 24
3.3.1. Effect of fumonisins on bacteria ... 24
3.3.2. Effect of bacteria on fumonisins ... 25
4. Objectives of the dissertation………...………..27
5. Materials and methods ... 28
5.1. Experimental designs ... 28
5.1.1. In vitro interaction between fumonisin B1 and the intestinal microflora of pigs ... 28
5.1.2. In vitro effect of fumonisin B1 on the ruminal microflora of sheep .... 29
5.1.3. In vivo experiment: Effect of Fumonisins producing Fusarium sp. on the microbiota in pigs ... 30
5.2. Measurement of the amount of bacteria ... 31
5.2.1. Media and plate count agar technique applying to measure living bacteria in the in vitro and in vivo experiment in pigs ... 31
5.2.2. Quantitative polymerase chain reaction (qPCR) applying to measure DNA copy numbers of bacteria... 32
5.3. Mycotoxin extraction and analysis ... 35
5.4. Statistical analysis ... 36
6. Results and the evaluation ... 37
6.1. In vitro interaction between fumonisin B1 and the intestinal microflora of pigs ... 37
6.1.1. Effect of caecal microflora on fumonisin B1 ... 37
6
6.1.2. Effect of fumonisin B1 on caecal microbiota in pigs ... 39
6.2. In vitro effect of fumonisin B1 on ruminal microbiota of sheep ... 42
6.3. In vivo experiment: Effect of fumonisins producing Fusarium sp. on the microbiota in pigs ... 43
7. Conclusions and recommendations ... 47
7.1. In vitro interaction between fumonisin B1 and the intestinal microflora of pigs ... 47
7.2. In vitro effect of fumonisin B1on the ruminal microflora in sheep ... 47
7.3. In vivo experiment: Effect of fumonisins producing Fusarium sp. on the microbiota in pigs ... 47
8. New scientific results... 48
8.1. In vitro interaction between fumonisin B1 and the intestinal microflora of pigs ... 48
8.2. In vitro effect of fumonisin B1 on ruminal microbiota in sheep ... 48
8.3. In vivo experiment: Effect of fumonisins producing Fusarium sp. to the microbiota in pigs ... 48
9. Summary ... 50
9.1. In vitro interaction between fumonisin B1 and the intestinal microflora of pigs ... 50
9.2. In vitro effect of fumonisin B1 on the ruminal microflora of sheep ... 50
9.3. In vivo experiment: Effect of fumonisins producing Fusarium sp. to the microbiota in pigs ... 51
10. Acknowledgements ... 52
11. Bibliography ... 53
12. Publications related to the topic of dissertation ... 78
13. Publications not related to the topic of dissertation ... 79
14. Short professional CV ... 80
7
List of the tables
Table 1. Fumonisins producing fungal species ... 13 Table 2. Functional groups of the fumonisin analogues ... 13 Table 3. Liquid Chromatography – Tandem Mass Spectrometry (LC-MS/MS) conditions applied for the separation of fumonisins ... 18 Table 4. Effect of bacteria on fumonisins ... 26 Table 5: Experimental design to determine in vitro interaction between fumonisin
B1 and the intestinal microflora of pigs ... 29 Table 6: Experimental designto determine in vitro interaction between fumonisin
B1 and the intestinal microflora of sheep ... 30 Table 7. Bacteria groups investigated in the research ... 33 Table 8. Oligonucleotide sequences used for QPCRs ... 34 Table 9: Number of bacteria in the pigs’ caecal chyme incubated with (experimental group) and without (control 1 group) fumonisin B1
measured by culturing (log10 CFU1/g, means ± SD) ... 41 Table 10: Number of bacteria in the pigs’ caecal chyme incubated with (experimental group) and without (control 1 group) fumonisin B1
measured by qPCR (log10 copy number/g, means ± SD) ... 41 Table 11: Number of bacteria in the sheep’s ruminal content incubated with (experimental group) and without (control 1 group) fumonisin B1
measured by qPCR (log10 copy number/g, means ± SD) ... 43 Table 12: Number of bacteria in the pigs’ caecal chyme with (experimental group) and without (control group) fumonisin B1 measured by culturing (log10
CFU1/g, means ± SD) ... 44 Table 13: Number of bacteria in the pigs’ ceacal content with (experimental group) and without (control group) Fusarium measured by QPCR (log10
copy number/g, means ± SD) ... 46
8
List of the figures
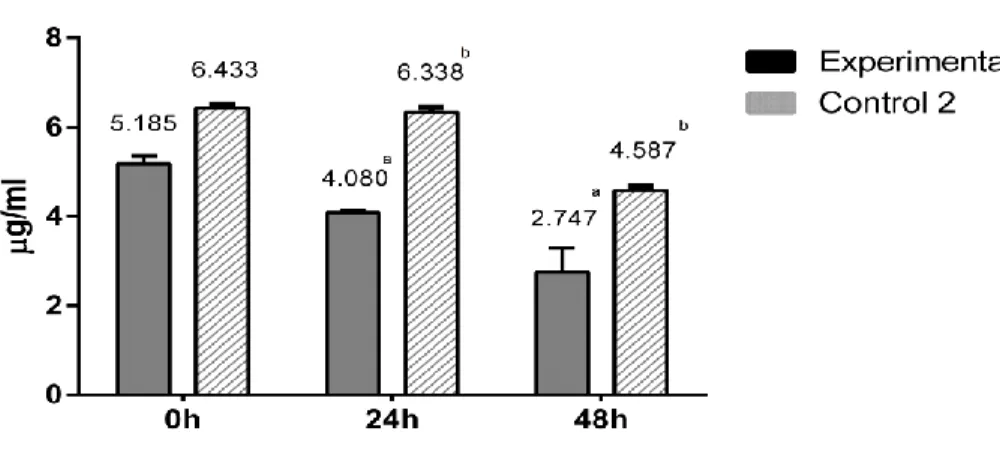
Figure 1: Chemical structure of fumonisins ... 14 Figure 2. Fumonisin B1 concentration in experimental groups and control 2
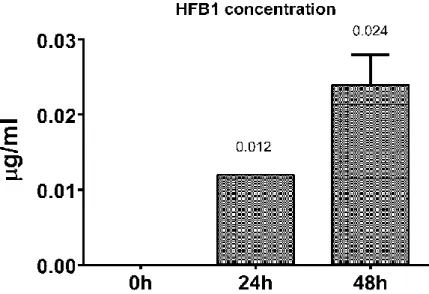
groups during the incubation time ... 37 Figure 3. Hydrolysed Fumonisin B1 concentration in experimental groups during the incubation time ... 38
9
2. Introduction
The fumonisins, first isolated by Gelderblom et al. (1988), are a group of mycotoxins produced by many Fusarium species mostly by Fusarium proliferate and Fusarium verticillioides (former name is Fusarium moniliforme). It was believed that fumonisins were only produced by Fusarium species until the year 2000. However, other fungi can also synthesize fumonisins such as Aspergillus niger (Frisvad et al. 2007) and Aspergillus awamori (Varga et al. 2010). Fumonisins are found mainly in maize, all over the world. The presence of fumonisin B1 (FB1) is the most frequent among fumonisins in maize, representing about 60% of total fumonisins (Voss et al., 2011).
In Europe, FB1 concentrations varied from 0.007 to 250 mg/kg in maize, and 0.008 to 16 mg/kg in maize products (Scientific Committee on Food, EU Commission, 2000). The evaluation of fumonisin exposure in human has been reported in some countries - for example, the mean dietary consumption in Switzerland was 0.03 µg/kg bw/day. In the Netherlands it was between 0.006 and 7.1 µg/kg bw/day (EHC, 2000). The prevalence of FB1 in maize and cornflake samples in Europe was 66% and 46%, respectively (SCOOP, 2003). During an 8-year period (2004-2012), more than 17000 samples of feed and feed raw materials from all over the world were analyzed for contamination with aflatoxins, ochratoxin A, zearalenone, deoxynivalenol and fumonisins. As a result, in Central Europe, the prevalence of fumonisins was 51% (number of samples analysed for FBs: 206) whereas in Southern Europe it was 70% (total number of samples: 233) and no data were available for Northern Europe (Schatzmayr and Streit, 2013). The EU regulations for mycotoxin contamination in human food are among the strictest over the
10
world. The European Commission set maximum limits for the sum of FB1
and FB2, namely 1000 µg/kg for maize and maize-based foods intended for direct human consumption, 800 µg/kg for maize-based breakfast cereals and maize-based snacks, 200 µg/kg for processed maize-based foods and baby foods for infants and young children (Commission Regulation (EC) No 1881/2006). For animals, the European Union’s guidance values are 20 mg/kg for FB1+ FB2 in compound feed for poultry; 5 mg/kg for pig, horse, rabbits and pet animal; 50 (20) mg/kg for ruminants (young) (Commission Recommendation, 2006/576/EC).
The chemical structure of fumonisins consists of a stable carbon chain which is similar to sphinganine (Sa) and sphingosine (So). Therefore, fumonisins can interrupt the sphingolipid synthesised process playing a crucial role in lipoprotein, cell wall synthesis and metabolism regulation. In relatively high doses and after a prolonged feeding of fumonisins, have led to harmful effects on human and animal health (Quinn et al., 2011) such as cause esophageal cancer in human (IARC, 1993), porcine pulmonary edema (PPE), equine leukoencephalomalacia (ELEM) and liver damage in multiple species including pigs, horses, cattle, rabbits, and primates; kidney damage in rats, rabbits, and sheep (Smith, 2007). While pigs are the most sensitive group of animals to fumonisin, the ruminants are the most tolerant species of this toxin.
Pigs fed fumonisin for at least 93 days developed nodular hyperplasia of the liver and pulmonary vasculature is a target of chronic exposure to fumonisin as reported by Casteel et al. (1994). Fumonisin treated pigs (20 mg FB1/kg bw daily) had lower cardiac outputs and heart rates than control pigs after 3 days (Constable et al. 2000). Cortinovis et al. (2014) demonstrated that FB1
had inhibitory effects on porcine granulosa cell proliferation. Regarding the slight effect of fumonisins on ruminant species, some studies were carried out
11
to see how fumonisins induce a negative effect on ruminants. In cattle, FB1
causes liver damage (Osweiler et al., 1993), hepatotoxic and nephrotoxic in milk-fed calves with 1 mg/kg intravenously (Mathur et al., 2001). The decrease in feed intake and milk production as well as the increase of serum aspartate aminotransferase (AST), gamma-glutamyl transferase (GGT) were observed in cow treated with FB1 (Richard et al., 1996; Diaz et al., 2000;
Baker and Rottinghaus, 1999). FB1 was proven in cytotoxic capability via an effect on the oxidative status of bovine peripheral blood mononuclear cells (Bernabucci et al., 2011). In sheep, FB1 induce liver damage and renal toxicity (Edrington et al, 1995). FB1 can cause immunosuppression and immunostimulation in mice immunized with sheep red blood cells (Martinova and Merrill, 1995). It is hypothesized that several biochemical processes have occurred for prohibiting FB1 production, binding, metabolism or degradation FB1 in the rumen. Then less FB1 can pass through the four- chambered stomach to arrive at the small intestine where it can be absorbed mostly and cause toxic effects.
Many experiments were performed to understand the impact of fumonisin on animal health while only a few studies (most of them used in vitro methods) about fumonisins and the gut microbiota were conducted (Becker et al., 1997;
Fodor et al., 2007; Loiseau et al., 2007; Burel et al., 2013). Gastrointestinal tract (GIT) is the first target organ of these toxic compounds entering the body via feed/food and fully understanding of the fumonisin activities in the GIT is necessary to explore the pathway of biotransformation of fumonisin in the body. This research will be carried out to estimate the interaction of fumonisin mycotoxins and the gastrointestinal microbiota in sheep and swine using in vitro and in vivo experiments.
12
3. Literature review
3.1. Fumonisin mycotoxins and the analytic methods 3.1.1. Chemical structure of fumonisins
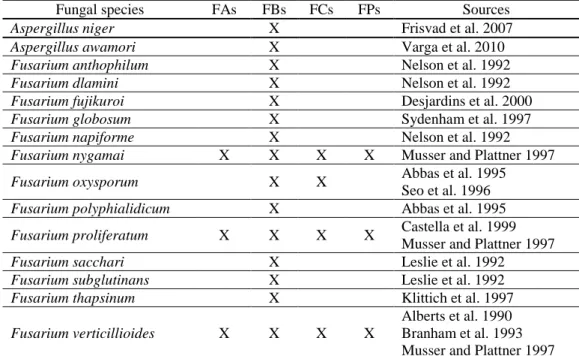
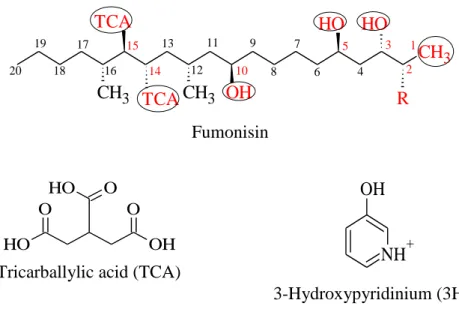
Four groups of fumonisins (FA, FB, FC and FP) were classified based on the structure of backbone and that of the functional groups at positions C1, 2, 3 and 10 (Musser and Plattner, 1997). Fumonisin B group is the most abundant among fumonisins produced by fungal species (Table 1). Theoretically, there are thousands of isomers of fumonisins those can be synthesized based on chiral centres of fumonisin structure (Bartók et al., 2010). More than 100 isomers and stereoisomers of fumonisins were asserted by researchers (Rheeder et al., 2002; Bartók et al., 2008; Varga et al., 2010; Bartók et al., 2014). The chemical structure of fumonisins consists of a 19-carbon amino- polyhydroxy alkyl chain (fumonisin C) or a 20-carbon amino- polyhydroxyalkyl chain (fumonisin A, B, P) and some different chemical groups (N-acetyl amide, amine, tricarboxylic) depending on the type of fumonisin analogue (Table 2, Fig. 1). Basically, compounds at the carbon position number 14 and 15 are tricarballylic acid (TCA) and they can be found in all groups of fumonisins except some isomers. Different fumonisin analogues are also distinguished by interchange hydrogen and hydroxide in C- 3 and C-10 positions. The highest extent of differences among the chemical structures of fumonisins is in C-2 position. These groups are the N-acetyl amide (NHCOCH3) in fumonisin A group, the amine (NH2) in fumonisin B and C, and the 3-hydroxypyridinium (3HP) moiety in fumonisin P.
13
Table 1. Fumonisins producing fungal species (adapted from Rheeder et al., 2002)
Fungal species FAs FBs FCs FPs Sources
Aspergillus niger X Frisvad et al. 2007
Aspergillus awamori X Varga et al. 2010
Fusarium anthophilum X Nelson et al. 1992
Fusarium dlamini X Nelson et al. 1992
Fusarium fujikuroi X Desjardins et al. 2000
Fusarium globosum X Sydenham et al. 1997
Fusarium napiforme X Nelson et al. 1992
Fusarium nygamai X X X X Musser and Plattner 1997
Fusarium oxysporum X X Abbas et al. 1995
Seo et al. 1996
Fusarium polyphialidicum X Abbas et al. 1995
Fusarium proliferatum X X X X Castella et al. 1999 Musser and Plattner 1997
Fusarium sacchari X Leslie et al. 1992
Fusarium subglutinans X Leslie et al. 1992
Fusarium thapsinum X Klittich et al. 1997
Fusarium verticillioides X X X X
Alberts et al. 1990 Branham et al. 1993 Musser and Plattner 1997
Table 2. Functional groups of the fumonisin analogues (adapted from Musser and Plattner, 1997)
Fumonisin Carbon position
Formula
C1 C2 C3 C10
FA1 CH3 NHCOCH3 OH OH C36H61NO16
FA2 CH3 NHCOCH3 OH H C36H61NO15
FA3 CH3 NHCOCH3 H OH C36H61NO15
FB1 CH3 NH2 OH OH C34H59NO15
FB2 CH3 NH2 OH H C34H59NO14
FB3 CH3 NH2 H OH C34H59NO14
FC1 H NH2 OH OH C33H57NO15
FP1 CH3 3HP OH OH C39H62NO16+
FP2 CH3 3HP OH H C39H62NO15+
FP3 CH3 3HP H OH C39H62NO15+
14
Fumonisin
Tricarballylic acid (TCA)
3-Hydroxypyridinium (3HP)
Figure 1: Chemical structure of fumonisins 3.1.2. The metabolized fumonisin products and their toxicity
The chemical structure of the carbon backbone of fumonisins is quite stable.
However, the functional groups which connect to fumonisin backbone can be affected by chemical or physical factors or by an enzyme (Humpf and Voss, 2004; Heiln et al., 2010; Formenti et al., 2012). In fact, changes of those compounds among fumonisin analogues are the solid evidence for the impact of the structure of fumonisins. Up to now, most of the chemical structure studies focus on FBs,especially FB1. The changeable functional groups are in the position of C2, C5, C10 and TCAs at C14 and C15.
Because of the availability of the amine group in FB1, the Maillard reaction between an amino acid and a reducing sugar with the addition of heat was considered as the method to affect the chemical structure of FB1. It was believed that the toxicity of FB1 derived from the amine group because the N-acetyl-FB1 is non-toxic (Gelderblom et al., 1993). Murphy et al. (1996)
R O
H
OH CH3
CH3 TCA
TCACH3
O H
1 2 5 3
14 10 15
4 6 7 8 9 11 12 13 16
17 18 19 20
O O H
O O
O
H OH
OH
NH+
15
suggested using sugar such as fructose or glucose to block the amine group and detoxify FB1. Two derivatives can be converted and isolated from FB1 at the amine group. They are N-(1-deoxy-D-fructose-1-yl)-FB1 (NDFB1) and N- (carboxymethyl) FB1 (NCMFB1). Voss et al. (2001) proved that the NDFB1
can be created during Maillard-like reaction in the heating process. NDF was also presented when FB1 is formed with D-glucose in the binding reaction (Poling et al., 2002). The similar process occurred in FB2 and FB3 with the o- phthalaldehyde (OPA) reagent (Matsuo et al., 2015). Lu et al.(2002) studied on the characterization of FB1-glucose reaction kinetics and showed the method using glucose to decrease FB1 concentration to half at 60 oC in 8 days or 80 oC in 2 days. In an other study, glucose was used successfully to degrade FB1 during twin screw extrusion, till 37% (Jackson et al., 2011). N- (carboxymethyl) FB1 was the principal reaction product following the heating process by reducing sugars in phosphate buffer in the range of 78
oC and 94 oC (Howard et al., 1998). But there is only 3 – 16% of the N- (carboxymethyl) FB1 was created in the muffin in the extrusion conditions (Castelo et al., 2001). From the point of view of toxicity, NDF from FB1 is less toxic than FB1 (Voss et al., 2001).
Other functional groups which are able to affect TCAs and the metabolism products are partially hydrolysed fumonisins (PHFB) or fully hydrolysed fumonisins (HFB). The HFB1 was determined in the 1990s (Gelderblom et al., 1993; Hopmans and Murphy, 1993; Shephard et al., 1994). This process happens during nixtamalisation using alkaline solution or processed with Ca(OH)2 (Scott and Lawrence, 1994) or by some microorganisms (Fodor et al., 2007). Besides, several studies were conducted using enzyme Carboxylesterase FumD to degrade FB1 into HFB1 (Heinl et al., 2010;
Hartinger et al., 2011; Masching et al., 2016). In theory, the PHFBs are easier
16
created than HFBs whenever the degradation process happens because of removing only one TCA group. The simpler chemical structure of HFB compared with FBs leads the higher absorption in the intestine (Caloni et al., 2002). Cirlini (2014) and coworkers reported that HFB1 is more stable than FB1. HFB1 was believed more cytotoxic than FB1 (Gelderblom et al., 1993) and HFB1 toxicity was demonstrated in rats (Hendrich et al, 1993). But recently, the toxicity of HFBs has been investigated; they are far less toxic than FBs, especially in rodents and pigs (Collins et al., 2006; Seiferlein et al., 2007; Voss et al., 2009; Grenier et al., 2012; Harrer et al., 2013).
3.1.3. Analysis of fumonisin mycotoxins by liquid chromatography-mass spectrometry method
To quantify and qualify fumonisins in foods and feed stuff, several chromatographic methods have been developed such as thin layer chromatography (TLC), high performance liquid chromatography (HPLC), liquid chromatography-mass spectrometry (LC-MS) and gas chromatography-mass spectrometry (GC-MS) techniques. Most of the methods are applied to quantify fumonisin Bs because of its dominant presence among fumonisin analogues. Among of them LC-MS is the most frequently used method for quantification of fumonisins because of its high sensitivity and accuracy. This technique combines the physical separation capabilities of LC with the mass analytic capabilities of MS. It had been extremely difficult to connect LC with MS before the 1990s because they require rather different conditions such as temperature or volume of analytes.
The atmospheric pressure ionization (API) solved effectively this problem.
The atmospheric pressure chemical ionization (APCI) and electrospray ionization (ESI) are mainly two types of API interfaces. APCI is suitable for primarily low and medium polarity compounds whereas ESI is the best
17
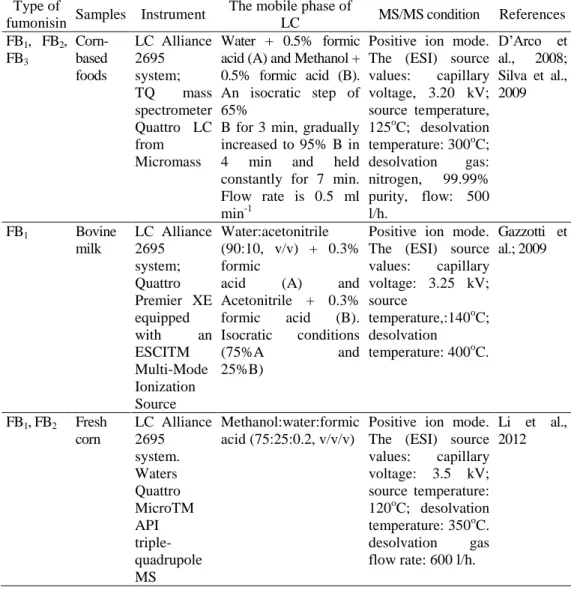
appropriate for ionic compounds with high polarity. Therefore, ESI is selected for fumonisin determination. To analyze fumonisin isomers, LC- tandem mass spectrometry (LC-MS/MS) is usually used based on the better capability of separation and identification of compounds in complex mixtures. The analytical conditions applied to LC-MS/MS depend on the type of fumonisin and the type of samples (Table 3). The limit of quantification (LOQ) for FB1 and FB2 was 2 µg kg-1 (D’Arco et al., 2008), while Silva et al., (2009) reported higher LOQ value, 12 µg kg-1, for fumonisins B1 and B2, using the same LC-MS/MS system and conditions for corn-based foods analysis. Their method was modified by using ultrasonic extraction and LOQs for FB1 and FB2 were 11.7 µg kg-1 and 8.3 µg kg-1 respectively, from fresh corn samples (Li et al., 2012). In order to identify fumonisins and qualify them in corn, Tamura et al. (2015) utilized LC- Orbitrap MS. LOQs for FA1, FA2, FA3 were 0.34 µg kg-1, 1.98 µg kg-1 and 0.92 µg kg-1, respectively. LC-Orbitrap MS analysis proved to be better than LC-MS/MS regarding the detection of fumonisins at very low levels, as LOQs were between 0.05 and 0.12 µg kg-1 for FBs.
18
Table 3. Liquid Chromatography-Tandem Mass Spectrometry (LC-MS/MS) conditions applied to the separation of fumonisins
Type of
fumonisin Samples Instrument The mobile phase of
LC MS/MS condition References FB1, FB2,
FB3
Corn- based foods
LC Alliance 2695 system;
TQ mass spectrometer Quattro LC from Micromass
Water + 0.5% formic acid (A) and Methanol + 0.5% formic acid (B).
An isocratic step of 65%
B for 3 min, gradually increased to 95% B in 4 min and held constantly for 7 min.
Flow rate is 0.5 ml min-1
Positive ion mode.
The (ESI) source values: capillary voltage, 3.20 kV;
source temperature, 125oC; desolvation temperature: 300oC;
desolvation gas:
nitrogen, 99.99%
purity, flow: 500 l/h.
D’Arco et al., 2008;
Silva et al., 2009
FB1 Bovine milk
LC Alliance 2695 system;
Quattro Premier XE equipped with an ESCITM Multi-Mode Ionization Source
Water:acetonitrile (90:10, v/v) + 0.3%
formic
acid (A) and Acetonitrile + 0.3%
formic acid (B).
Isocratic conditions
(75%A and
25%B)
Positive ion mode.
The (ESI) source values: capillary voltage: 3.25 kV;
source
temperature,:140oC;
desolvation
temperature: 400oC.
Gazzotti et al.; 2009
FB1, FB2 Fresh corn
LC Alliance 2695 system.
Waters Quattro MicroTM API triple- quadrupole MS
Methanol:water:formic acid (75:25:0.2, v/v/v)
Positive ion mode.
The (ESI) source values: capillary voltage: 3.5 kV;
source temperature:
120oC; desolvation temperature: 350oC.
desolvation gas flow rate: 600 l/h.
Li et al., 2012
3.2. Gastrointestinal microflora in pigs, sheep and the quantitative methods
3.2.1. Gastrointestinal bacteria in pigs
The microbial ecology in the gastrointestinal tract (GIT) of pigs is complicated and the exploration is still in progress. The knowledge of the
19
GIT microflora is gained by the classical culturing technique in the past and the molecular biological tools nowadays. Several studies presented the classification of GIT microbial ecology by using the microbiological methods (Robinson et al., 1981 and 1984; Russel, 1979; Moore et al., 1987). As their results showed, most of bacteria are belong to the Gram-positive groups including Streptococci and Clostridia while the dominant Gram-negative bacteria are Bacteroides. To get more information about the GIT microbiota, the Pig Intestinal Molecular Microbiology Project was conducted by Leser and coworkers (2002). The result showed that 81% low-GC (Guanine and Cytosine) gram-positive phylotypes were represented and 11.2% belonged to Bacteroides and Prevotella group. Isaacson and Kim (2012) reviewed the component of GIT bacteria in pig and concluded that the primary (90%) of bacterial strains in the pig intestine belong to two phyla: Firmicutes and Bacteroides. By metagenomic analysis, Xiao and coworkers (2016) showed that there were 7.7 million non-redundant genes representing 719 metagenomic species of microbes in faeces from pigs. However, regarding the specific productivities of pigs such as reproduction or slaughtering, the additional feed was added in the diet to change microbial systems. For instance, antimicrobial supplements have been used to improve the body weight gain during the weaning period (Jensen, 1998; Cromwell, 2002).
Dietary plant extract supplementation in weaned piglets increased the amount of Lactobacillus spp (Castillo et al., 2006). When Durmic et al. (1998) added resistant starch to the diet, the amount of total and Gram-negative bacteria increased in the colon.
GIT microbes play important roles in the initial colonization, the barrier function, development of the immune system and impact on feed efficiency (Fouhse et al., 2016). Most of bacteria in the pig intestine need an anaerobic
20
environment for existence and development which are supported by the availability of some initial colonization microbes such as Escherichia coli (E. coli) and Streptococcus spp. (Petri et al., 2010). A representative beneficial bacterial groups which have the protective roles and create the gut barrier are Lactobacillus spp. They helped mucin production (Che et al., 2014) to withstand the pathogenic microorganisms in the small intestine of the pig (Konstantinov et al., 2006). Mach et al. (2015) found the relationship between the IgA concentrations and amount of Prevotella while the macrophages were reduced in germ-free pigs compared with the Lactic acid bacteria (LAB) colonization group (Zhang et al., 2008). In term of feed digestion, the free amino acid can be metabolised by the luminal bacteria in the gut of the pig (Yang et al., 2014) and glutamine may relate to the process in the small intestine (Dai et al., 2012).
3.2.2. Ruminal bacteria in sheep
Ruminal microflora was researched in decades but not so many studies focused on sheep’s ruminal microorganisms. In the last decades, the scientists classified bacteria into the groups of liquid-associated bacteria and solids- associated bacteria. Both of them can help the starch digestion (Faichney et al., 1997). Recently, ruminal microorganisms are usually studied by molecular biological technique. The major ruminal microorganisms of ewes belong to phyla Bacteroidetes, Firmicutes and Proteobacteria (Castro- Carrera et al., 2014). Wang and coworkers (2017) used the next generation sequencing technique to analyse the bacterial system in the rumen of sheep and the results showed 133 genera divided into 16 phyla dominating with Firmicutes and Bacteroidetes. When the nutrient levels were up, Bacteroidetes and Proteobacteria increased while Firmicutes decreased. The construction of bacterial communities is various in a different host
21
(Henderson et al., 2015). In sheep, the results showed the dominance of unclassified Veillonellaceae while Fibrobacter was less than in bovines.
The ecosystem of microorganisms in the sheep rumen are still not fully understood but some isolated strains were studied on their roles in the feed digestion. In those studies, the isolates closing to Streptococcus gallolyticus presented the ability as the tannins resistant bacteria (Babaei et al., 2015).
The sheep’s ruminal anaerobic bacteria can degrade protein via the fermentation process (Ali et al., 2009). The fermenting bacterial communities such as lactate and succinate producing bacteria are also related to the lower CH4 yields by less hydrogen digestion (Kittelmann et al., 2014). Another important role of the ruminal bacteria is supported to produce NH3 by deamination of amino acids (Eschenlauer et al., 2002). Koike and coworkers (2010) isolated successfully some fibre-associated bacteria which can degrade fibrin sheep rumen, namely B76 and R-25. Both of them were gram- positive short rods or cocci and showed hemicellulolytic activity. By pyrosequencing analysis, Wang et al. (2017) showed the entire GIT bacteria of sheep, the most dominant bacteria in sheep’s rumen is Firmicutes and the second biggest amount of bacteria is Bacteroidetes.
3.2.3. Molecular tools for quantitative investigation of gastrointestinal bacteria in pigs and sheep
To measure the amount of gastrointestinal bacteria, the most popular methods are the classical culture-dependent methods. These methods use the series of 10-fold dilution of the samples. The selective media will be used for each type of bacteria with the appropriate conditions (temperature, time, anaerobic or aerobic environment) in the technique known as plate count agar (Buchbinder et al., 1951; Wehr et al., 2004). Other culture-dependent method for a scan the amount of bacteria is the most probable number (MPN) which
22
use the system of cultural tubes and get the quantitative results by comparing the picture of the sample to the standard (Oblinger and Koburger, 1975). The advantage of culturing methods is to know the number of culturable and alive bacteria. However, the biggest problem is that there is over 99% of the microorganisms are not cultivable by those techniques (Hugenholtz et al., 2002). Culture-independent analysis of bacteria was developed based on the specification of the bacterial genes. The method using 16S rRNA gene was applied to investigate the composition of intestinal microorganisms (Amann et al., 1995; Kageyama et al., 2000; Sakamoto et al., 2000). Up to now, there are several molecular methods have been used to determine the qualitative (types of bacteria) and quantitative (amount of a given bacteria) properties of GIT bacteria such as real-time PCR (or qPCR), next generation sequencing (NGS) and the phylochip.
Real-time PCR is a PCR which can monitor the amplification process of a target gene during the PCR. To track the PCR product, the fluorescent dyes or labelled DNA probes bind the DNA, which the fluorescent dye/label is detected during each cycle of the amplification. This technique has been selected by many types of research because of the specific, accurate and reasonable cost assay. The amount of the total bacteria (11.1 ± 0.88 log gene copy number/g fresh matter (FM)), Lactobacilli (7.8 ± 0.37) and Enterobacteria (10.8 ± 1.66) in the jejunum of pigs were measured by quantitative real-time PCR (qPCR) (Castillo et al., 2006). Okabe and coworkers (2007) set up the qPCR for investigating faecal pollution (from human, cow and pig) in freshwater base on the host-specific Bacteroides-Prevotella 16S rRNA genetic markers. The qPCR has been also applied to determine the amount of ruminal bacteria and the result showed that Fibrobacter succinogenes were the most abundant species. In sheep’s rumen, Mosoni et al. (2007) quantified Fibrobacter succinogenes, Ruminococcus
23
albus and Ruminococcus flavefaciens by qPCR targeting 16S rRNA and reported that R. albus was presented at the lowest amount.
There are different approaches to perform NGS. In most cases, NGS is started with the preparation of DNA fragmentation library and in vitro adaptor ligation. The second step is divided into two types of PCR, the bridge PCR which is applied for sequencing by synthesis and the emulsion PCR which is used in pyrosequencing and sequencing by ligation. The NGS can show the sequences of the microflora population and their amount in each phyla. Pajarillo and coworker (2014) have been analysed the fecal microflora of Duroc pigs by pyrosequencing and showed the dominance of Prevotella as well as a phylotype similar to Oscillibacter valericigenes. In the latest investigation of bacteria in the stomach of pig by 16S rRNA analysis using the NGS, Motta et al. (2017) reported that Proteobacteria was the dominant phylum in the gastric contents while the bacteria of the gastric mucus belonged to Herbiconiux and Brevundimonas. The characterization of the microbial communities in the GIT tract of sheep, from the rumen to rectum, were studied by Wang and coworkers (2017) using 454 pyrosequencing analysis. The result showed the various phyla depending on the different part of the GIT but the dominant bacterial phyla in the entire sections were Firmicutes, Bacteroidetes and Proteobacteria.
The phylochip or different microarrays are working with probes attached to a solid surface. The samples find the probes, then the signal will be detected and analysed by the reader or by a computer program depending on the probe density on the surface. Maga et al. (2013) used pigs as the animal model to study composition of gut microbiota. The phylochip was utilized as the analytic method and the result showed that two major phyla of the faeces during milk supplementation are Bacteroides and Firmicutes. To analyse ruminal bacterial communities, the first phylochip was studied and developed
24
by Kim and coworkers (2014) and it is designed to detect 1666 operational taxonomic units.
3.3. Interactions between fumonisins and bacteria 3.3.1. Effect of fumonisins on bacteria
Fumonisins might affect bacterial activities directly or indirectly. However, the scientific information about the impact of fumonisins on bacterial activities is very sparse. To the best of our knowledge, there was only one report from Becker (1997) about the direct effect of fumonisins on some certain bacteria strains. Some in vitro experiments were conducted to estimate the influence of FB1 on the bacteria isolated from various sources.
As the results showed, a large amount of bacteria did not differ significantly between control and treated groups (the range of fumonisin concentration was from 50 µM to 1000 µM) after incubation (Becker et al., 1997). By contrast, some positive results about the indirect impact of fumonisins on bacteria were published. Activities of pathogenic bacteria and the immune system of the body have a tight connection. Fumonisins, which cause immunotoxicity in mice (Abbès et al., 2015) and reduce the phagocytic activity of chicken macrophages (Chatterjee and Mukherjee, 1994), can influence activities of colonized bacteria in the body. When Japanese quails were infected with Salmonella gallinarum, increased mortality and decreased lymphocyte number was observed in FB1 treated group at 150 mg/kg feed for 6 weeks (Deshmukh et al., 2005). Colonization of the small and large intestines by an extra intestinal pathogenic E.coli strain was significantly proliferated when pigs were treated with 0.5 mg/kg of body weight of FB1 for 7 days (Oswald et al., 2003). In case of co-occurrence of fumonisins and other mycotoxins, especially aflatoxin, also intensified the calf susceptibility to Shiga toxin or verotoxin producing E. coli (STEC) associated with
25
hemorrhagic enteritis (Baines et al., 2013). Burel et al. (2013) reported that chronic exposure to a medium concentration of fumonisins in the naturally contaminated feed (11.8 mg/kg for 63 days) had no effect on the pigs’ health but could affect the balance of the microbiota.
3.3.2. Effect of bacteria on fumonisins
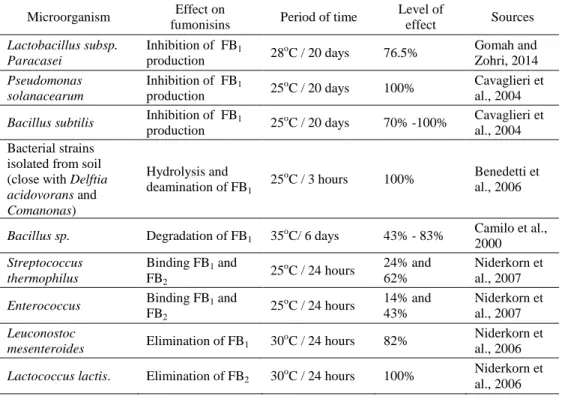
There are reported impacts of bacteria on Fusarium mycotoxins and fumonisins. Bacteria can metabolize or bind fumonisins directly or inhibit fumonisins production of fungi (Table 4).
As for inhibition of fumonisins, Lactobacillus rhamnosus can inhibit FB1
production in the range from 78.64% to 92.88% efficiency and significantly reduces bad impacts of FB1 to liver and kidney of the rat. (Al-Masri et al., 2011). This bacterial strain can diminish FB2 production up to 43.4% in experimental groups (Stiles and Bullerman, 2002). Some isolated rhizobacteria strains were demonstrated to have biological effects on Fusarium verticillioides and FB1. In these bacterial groups, Pseudomonas solanacearum and Bacillus subtilis strongly inhibited FB1 production in the range from 70% to 100% (Cavaglieri et al., 2005; Formenti et al., 2012). The concentration of FB1 was reduced by Lactobacillus subsp. paracasei after 20- day incubation (70.5 µl/ml compared with 300 µl/ml FB1 in control group) and Lactobacillus paracasei subsp. Paracasei can inhibit FB1 production in 10-day incubation (Gomah and Zohri, 2014). In an other report, FB1 level in maize was decreased by lactic acid bacterial activity after 3-day fermentation (Mokoena et al., 2005). A significant reduction of FB1 production and growth of Fusarium verticillioides was reported when cultured with Propionibacterium freudenreichii ssp. shermanii and ssp. Freudenreichii (Gwiazdowska et al., 2008). Concentration of FB1 and FB2 were also reduced significantly by Bacillus amyloliquefaciens, Microbacterium oleovorans and Enterobacter hormaechei
26
(Pereira et al., 2007; Pereira et al., 2010; Sartori et al., 2013). FB1 was hydrolyzed and deaminated by a bacterial strain isolated from soil after 3 hour period of incubation. There was a close phylogenetic relationship between this bacterium and the Delftia acidovorans as well as Comanonas group (Benedetti et al., 2006). FB1 was also degraded by Bacillus sp. isolated from corn and silage in the range from 43% to 83% after 6-day incubation.
Based on the results of Takeuchi et al. (2001) and Täubel (2005), two bacterial enzymes from Sphingopyxis sp. MTA144 were demonstrated that they can degrade FB1 (Heinl et al., 2010). Some bacteria can bind fumonisins, Niderkorn (2006) reported that 82% FB1 can be removed by Leuconostoc mesenteroides and 100% FB2 can be eliminated by Lactococcus lactis.
Streptococcus and Enterococcus also have a significant effect on FB1 and FB2 level, these bacteria bind FB1 and FB2 up to 24 and 62%, respectively (Niderkorn et al., 2007).
Table 4. Effect of bacteria on fumonisins
Microorganism Effect on
fumonisins Period of time Level of
effect Sources Lactobacillus subsp.
Paracasei
Inhibition of FB1
production 28oC / 20 days 76.5% Gomah and Zohri, 2014 Pseudomonas
solanacearum
Inhibition of FB1
production 25oC / 20 days 100% Cavaglieri et al., 2004 Bacillus subtilis Inhibition of FB1
production 25oC / 20 days 70% -100% Cavaglieri et al., 2004 Bacterial strains
isolated from soil (close with Delftia acidovorans and Comanonas)
Hydrolysis and
deamination of FB1 25oC / 3 hours 100% Benedetti et al., 2006
Bacillus sp. Degradation of FB1 35oC/ 6 days 43% - 83% Camilo et al., 2000 Streptococcus
thermophilus
Binding FB1 and FB2
25oC / 24 hours 24% and 62%
Niderkorn et al., 2007 Enterococcus Binding FB1 and
FB2
25oC / 24 hours 14% and 43%
Niderkorn et al., 2007 Leuconostoc
mesenteroides Elimination of FB1 30oC / 24 hours 82% Niderkorn et al., 2006 Lactococcus lactis. Elimination of FB2 30oC / 24 hours 100% Niderkorn et
al., 2006
27
4. Objectives of the dissertation
The aim of the research was to determine the interaction between fumonisins and the gastrointestinal microbiota from the following aspects:
1 - The effect of fumonisin mycotoxin on the bacterial communities of the gastrointestinal tract in sheep and swine.
In pigs, the in vitro and in vivo experiments were performed and the amount of caecal bacteria were measured by culturing technique and qPCR.
In sheep, an in vitro experiment using quantitative polymerase chain reaction (qPCR) was designed to determine DNA copy numbers of ruminal bacteria.
2 - The effect of the microorganisms of the gastrointestinal tract of swine on the metabolism of fumonisin.
28
5. Materials and methods
Three experiments were performed in this research and the methodologies were presented briefly as below:
Experiment 1: In vitro interaction between fumonisin B1 and the intestinal microflora of pigs
Methods: Liquid chromatography-mass spectrometry (LC-MS), plate count agar technique, quantitative polymerase chain reaction (qPCR)
Experiment 2: In vitro effect of fumonisin B1 on the ruminal microflora of sheep
Methods: qPCR
Experiment 3: In vivo experiment: Effect of fumonisins producing Fusarium sp.on the microbiota in pigs
Methods: Plate count agar technique, qPCR 5.1. Experimental designs
5.1.1. In vitro interaction between fumonisin B1 and the intestinal microflora of pigs
Samples of caecal content were collected from adult pigs (n=2; Hungarian Large White) right after slaughtering in a slaughter house and transferred into sterile bottles. The bottles were put in anaerobic plastic bags with Anaerocult gas generator (Merck, Darmstadt, Germany). The pre-incubated (24h/37oC/anaerobic) McDougall buffer solution (9.8 g NaHCO3, 3.7 g anhydrous Na2HPO4, 0.57 g KCl, 0.47 g NaCl, 0.12 g MgSO4.7H2O, 0.04 g CaCl2 and 1000 ml aquadest; pH 8.3) were prepared to serve as a control solution and to homogenise samples.
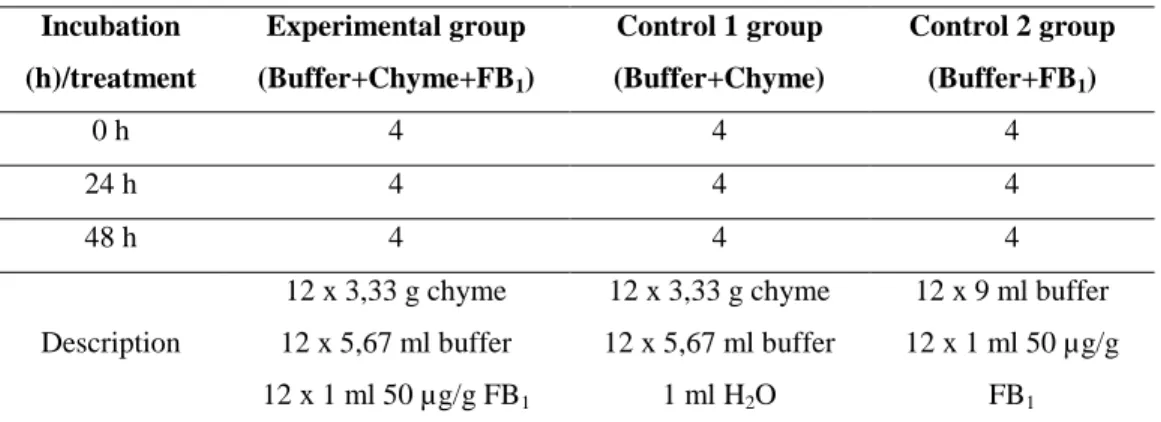
The experiment consisted of 3 groups as shown in Table 5. Two control groups were set up. Tubes in the control 1 group contained buffer and chyme,
29
while control 2 group was prepared including buffer and FB1.
Caecal chyme was homogenised and divided into the control 1 and experimental groups. An aliquot of 3.33g of caecal chyme was suspended in pre-incubated McDougal buffer tubes (experimental and the control 1 group).
After a pre-incubation for four hours at 37oC, FB1 (50 μg/g; Sigma-Aldrich, Darmstadt, Germany) was added to each tube (experimental and control 2 groups) to get a final concentration of 5µg/ml. Samples were taken at 0, 24 and 48 h of anaerobic incubation for determination of bacterial numbers and FB1 concentration.
Table 5: Experimental design to determine in vitro interaction between fumonisin B1 and the intestinal microflora of pigs
Incubation (h)/treatment
Experimental group (Buffer+Chyme+FB1)
Control 1 group (Buffer+Chyme)
Control 2 group (Buffer+FB1)
0 h 4 4 4
24 h 4 4 4
48 h 4 4 4
Description
12 x 3,33 g chyme 12 x 5,67 ml buffer 12 x 1 ml 50 µg/g FB1
12 x 3,33 g chyme 12 x 5,67 ml buffer
1 ml H2O
12 x 9 ml buffer 12 x 1 ml 50 µg/g
FB1
5.1.2. In vitro effect of fumonisin B1 on the ruminal microflora of sheep
Samples of ruminal content were collected from adult sheep (n=2; Racka and Merino crossbred) right after slaughtering in a slaughter house and transferred into sterile bottles. The bottles were put in anaerobic plastic bags with an Anaerocult gas generator (Merck, Darmstadt, Germany). The pre-incubated (24h/37 oC/anaerobic) McDougall buffer solution was prepared to homogenise samples and make the solution for control groups.
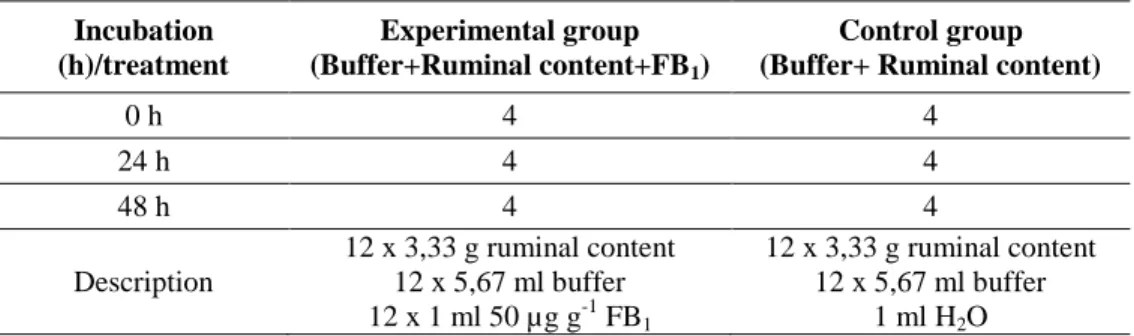
The experiment was designed to have an experimental group and a control group as shown in Table 6. Tubes in control contained buffer and ruminal
30
content, while the experimental group was prepared including buffer, ruminal content and FB1.
The ruminal content was homogenised and divided into control and experimental groups. 3.33g of ruminal content was suspended in pre- incubated McDougal buffer tubes. After a pre-incubation for four hours at 37
oC, FB1 (50 μg g-1; Sigma-Aldrich, Darmstadt, Germany) was added to each experimental tube to get a final concentration of 5µg ml-1. Samples were taken at 0, 24 and 48 h of anaerobic incubation for determination of bacterial numbers.
Table 6: Experimental design to determine in vitro interaction between fumonisin B1 and the intestinal microflora of sheep
Incubation (h)/treatment
Experimental group (Buffer+Ruminal content+FB1)
Control group (Buffer+ Ruminal content)
0 h 4 4
24 h 4 4
48 h 4 4
Description
12 x 3,33 g ruminal content 12 x 5,67 ml buffer 12 x 1 ml 50 µg g-1 FB1
12 x 3,33 g ruminal content 12 x 5,67 ml buffer
1 ml H2O
5.1.3. In vivo experiment: Effect of Fumonisins producing Fusarium sp. on the microbiota in pigs
5.1.3.1. Experimental animals and the design of the experiment
The experimental protocol is authorized by the Food Chain Safety and Animal Health Directorate of the Somogy County Agricultural Office, under permission number XV-I-31/1509-5/2012.
Twelve weaned barrows (n=12) of the same genotype, weighing 12–14 kg, were used in the experiment. The piglets were weighed and then divided into two groups: an experimental group (n = 6) and a control group (n = 6). The animals were placed into metabolic cages (80 x 80 cm) during the trial. The
31
temperature of the trial room were controlled in accordance with the needs of weaned piglets. Feed was given twice a day, in two equal portions, and the amount of feed not consumed by the animals were measured back. Drinking water was available ad libitum via automatic drinkers. After a 7-day adaptation period, according to the method of Tossenberger et al. (2000), a T-cannula were implanted into the caecum, in order to determine the effect of FB1 on the microbiota of the caecum. The duration of the trial was 9 days (following a 7-day adaptation phase and a 1-week regeneration phase after the operation). The experimental animals were fed a basic ration of a composition corresponding to their age (400 – 500 gram/day/pig). After the regeneration period, a Fusarium verticillioides fungal culture was mixed into the ration of the experimental animals, so as to provide a daily FB1 intake of 10 mg/animal. The mycotoxin content (Zearalenone (ZEN), Deoxynivalenol (DON), Fumonisin B1) of the control and experimental feed was measured.
5.1.3.2. Sampling and processing
In the period of Fusarium verticillioides feeding (9 days) samples of caecal content were taken on days 0, 2, 4, 6 and 8 through the T-cannula and transferred into sterile tubes. The tubes of samples on days 0, 4 and 8 were prepared for microbial culturing. Approximately 1 g of post-incubated sample was collected and subsequently homogenised with 9 ml of peptone salt solution. Then the 10-folds series dilution was conducted from 10-1 to 10-8. Samples from all tubes in the collecting points of time were stored in deep freezer (-86 oC) for qPCR analysis.
5.2. Measurement of the amount of bacteria
5.2.1. Media and plate count agar technique applying to measure living bacteria in the in vitro and in vivo experiment in pigs
The plate count technique on selected media was applied for determining the amount of bacteria. Approximately 1 g of post-incubated sample was collected and subsequently homogenised with 9 ml of peptone salt solution.
32
The 10-folds series dilution was conducted from 10-1 to 10-8. An aliquot (100 µl) was pipetted and added to the surface of each respective selected agar to culture bacteria. Five groups of bacteria were enumerated, in the in vitro experiment in pigs, including aerobic bacteria, anaerobic bacteria, coliform, Escherichia coli (E. coli) and Lactobacillus sp. while in the in vivo experiment, one additional bacterial strain was counted, besides the above mentioned five groups, Clostridium perfringens (C. perfringens). The aerobic and anaerobic bacteria were cultured in commercial blood agar (BA; Bak- Teszt Ltd., Budapest, Hungary). Coliform and Escherichia coli population were estimated on ChromoBio Coliform Agar (BioLab). The amount of Lactobacillus sp.was determined by using MRS agar (BioLab). For enumeration of C. perfringens, the pour plating technique with Tryptose sulphite cycloserine (TSC) agar (ISO7937 – VWR Chemical) was applied.
The same amount of diluted sample (100 µl) was pipetted and mixed with TSC agar (10 ml) on the petri dish. Then the other 10 ml TSC agar was utilised to cover thick layer after complete solidification of the previous medium.
The colony forming units/g (CFU/ g) were calculated using the formula:
N=ΣC/Vx1,1xd [Equation 1.]
Where ‘ΣC’ is the sum of the colonies counted on the two dishes retained from two successive dilutions, at least one of which contains a minimum of 10 colonies; ‘V’ is the volume of inoculums placed in each dish, in millilitres; ‘d’ is the dilution corresponding to the first dilution retained.
5.2.2. Quantitative polymerase chain reaction (qPCR) applying to measure DNA copy numbers of bacteria
The qPCRs performed to investigate DNA copy numbers of bacteria in all experiments in this research are summarised in Table 7
33
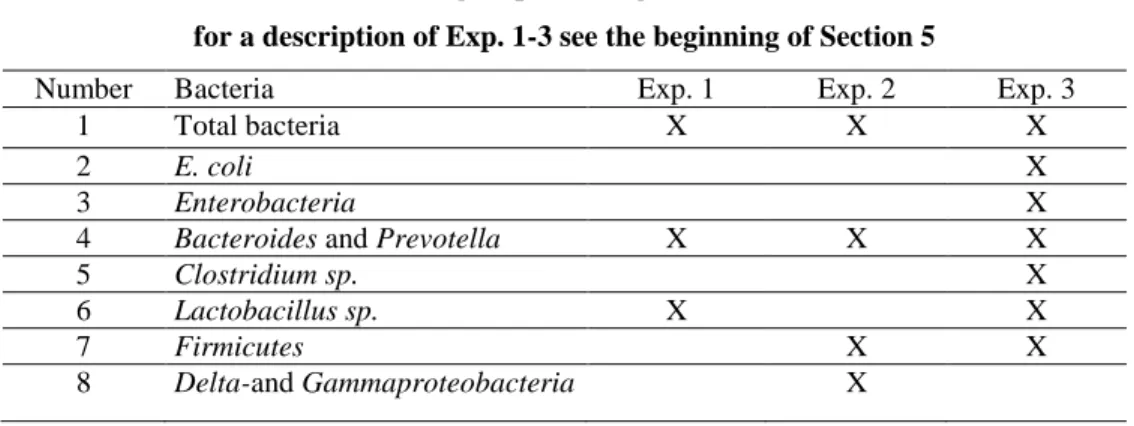
Table 7. Bacteria groups investigated in the research for a description of Exp. 1-3 see the beginning of Section 5
Number Bacteria Exp. 1 Exp. 2 Exp. 3
1 Total bacteria X X X
2 E. coli X
3 Enterobacteria X
4 Bacteroides and Prevotella X X X
5 Clostridium sp. X
6 Lactobacillus sp. X X
7 Firmicutes X X
8 Delta-and Gammaproteobacteria X
Exp. : Experiment
DNA extraction and QPCR
The DNA extraction was carried out with approximately 200 mg of the frozen samples using the QIAamp®DNA Stool Mini Kit according to the manufacturer’s instructions.
The standard curve was created by dilution series of purified PCR products for Lactobacillus sp., Firmicutes, Delta- and Gammaproteobacteria whereas the dilution series of plasmid concentration was used to prepare the standard curve for total bacteria, E.coli, Enterobacteria, C. perfringens, Bacteroides and Prevotella.
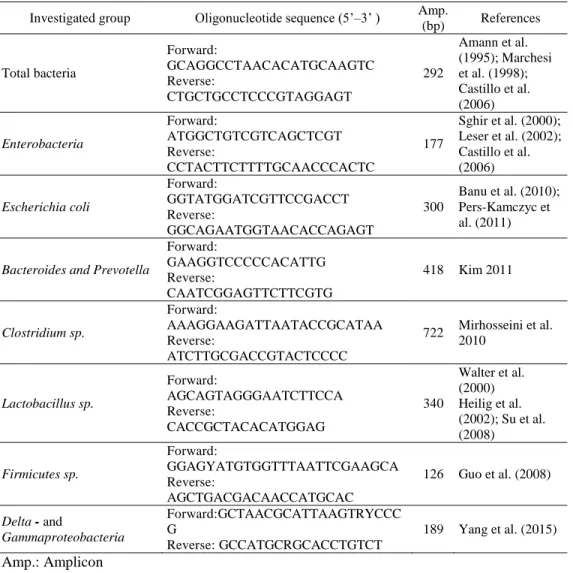
The quantity of bacterial groups was determined by qPCR using SYBR Green. The primers for investigated bacterial groups were selected based on previous literature (Table 8). QPCR was conducted in a 25 µl/tube reaction mixture containing 12.5 µl Brillant II SYBR QPCR Low Rox Master Mix (Agilent Technologies, CA, USA), 0.2 µM of each primer, 10.5 µl sterile DEPC treated distilled water and 1 µl of DNA extract. The PCR program for total bacteria, Enterobacteria, E.coli, Bacteroides and Prevotella consisted of 10 min at 95 °C, 40 cycles of 30 sec at 95 °C, 1 min at 60 °C. The PCR program for Firmicutes, Delta- and Gammaproteobacteria was 10 min at 95
34
°C, 40 cycles of 15 sec at 95 °C, 1 min at 60 °C. To investigate the amount of Clostridium sp., the PCR program was 3 min at 95 °C, 40 cycles of 40 sec at 95 °C, 40 sec at 54 °C, 80 sec at 72 °C and the end cycle was 3 min at 72 °C.
All samples were measured in triplicates. The bacterial content of the samples was calculated by comparison with the standard curve derived from the dilution series. The obtained copy numbers of the samples were adjusted to one gram of sample contents.
Table 8. Oligonucleotide sequences used for QPCRs Investigated group Oligonucleotide sequence (5’–3’ ) Amp.
(bp) References
Total bacteria
Forward:
GCAGGCCTAACACATGCAAGTC Reverse:
CTGCTGCCTCCCGTAGGAGT
292
Amann et al.
(1995); Marchesi et al. (1998);
Castillo et al.
(2006) Enterobacteria
Forward:
ATGGCTGTCGTCAGCTCGT Reverse:
CCTACTTCTTTTGCAACCCACTC
177
Sghir et al. (2000);
Leser et al. (2002);
Castillo et al.
(2006) Escherichia coli
Forward:
GGTATGGATCGTTCCGACCT Reverse:
GGCAGAATGGTAACACCAGAGT
300
Banu et al. (2010);
Pers-Kamczyc et al. (2011)
Bacteroides and Prevotella
Forward:
GAAGGTCCCCCACATTG Reverse:
CAATCGGAGTTCTTCGTG
418 Kim 2011
Clostridium sp.
Forward:
AAAGGAAGATTAATACCGCATAA Reverse:
ATCTTGCGACCGTACTCCCC
722 Mirhosseini et al.
2010
Lactobacillus sp.
Forward:
AGCAGTAGGGAATCTTCCA Reverse:
CACCGCTACACATGGAG
340
Walter et al.
(2000) Heilig et al.
(2002); Su et al.
(2008) Firmicutes sp.
Forward:
GGAGYATGTGGTTTAATTCGAAGCA Reverse:
AGCTGACGACAACCATGCAC
126 Guo et al. (2008)
Delta - and
Gammaproteobacteria
Forward:GCTAACGCATTAAGTRYCCC G
Reverse: GCCATGCRGCACCTGTCT
189 Yang et al. (2015) Amp.: Amplicon