Tumor Volume Estimation and Quasi-
Continuous Administration for Most Effective Bevacizumab Therapy
Johanna Sápi1, Levente Kovács1, Dániel András Drexler2, Pál Kocsis3, Dávid Gajári3, Zoltán Sápi4*
1Research and Innovation Center of Obuda University, Physiological Controls Group, Obuda University, Budapest, Hungary,2Department of Control Engineering and Information Technology, Budapest University of Technology and Economics, Budapest, Hungary,3Preclinical Imaging Center, Gedeon Richter Plc., Budapest, Hungary,41st Department of Pathology and Experimental Cancer Research, Semmelweis University, Budapest, Hungary
*sapi.zoltan.dr@gmail.com
Abstract
Background
Bevacizumab is an exogenous inhibitor which inhibits the biological activity of human VEGF. Several studies have investigated the effectiveness of bevacizumab therapy accord- ing to different cancer types but these days there is an intense debate on its utility. We have investigated different methods to find the best tumor volume estimation since it creates the possibility for precise and effective drug administration with a much lower dose than in the protocol.
Materials and Methods
We have examined C38 mouse colon adenocarcinoma and HT-29 human colorectal ade- nocarcinoma. In both cases, three groups were compared in the experiments. The first group did not receive therapy, the second group received one 200μgbevacizumab dose for a treatment period (protocol-based therapy), and the third group received 1.1μgbevaci- zumab every day (quasi-continuous therapy). Tumor volume measurement was performed by digital caliper and small animal MRI. The mathematical relationship between MRI-mea- sured tumor volume and mass was investigated to estimate accurate tumor volume using caliper-measured data. A two-dimensional mathematical model was applied for tumor vol- ume evaluation, and tumor- and therapy-specific constants were calculated for the three dif- ferent groups. The effectiveness of bevacizumab administration was examined by
statistical analysis.
Results
In the case of C38 adenocarcinoma, protocol-based treatment did not result in significantly smaller tumor volume compared to the no treatment group; however, there was a significant difference between untreated mice and mice who received quasi-continuous therapy (p=
OPEN ACCESS
Citation:Sápi J, Kovács L, Drexler DA, Kocsis P, Gajári D, Sápi Z (2015) Tumor Volume Estimation and Quasi-Continuous Administration for Most Effective Bevacizumab Therapy. PLoS ONE 10(11):
e0142190. doi:10.1371/journal.pone.0142190
Editor:Francesco Bertolini, European Institute of Oncology, ITALY
Received:February 3, 2015 Accepted:October 19, 2015 Published:November 5, 2015
Copyright:© 2015 Sápi et al. This is an open access article distributed under the terms of theCreative Commons Attribution License, which permits unrestricted use, distribution, and reproduction in any medium, provided the original author and source are credited.
Data Availability Statement:All relevant data are within the paper.
Funding:This work was supported by Hungarian Scientific Research Fund (OTKA),http://www.otka.hu/
en, No: K-112993 (János) and Bolyai Research Scholarship of the Hungarian Academy of Sciences, http://mta.hu/cikkek/?node_id=26057, No: 425_12.
Coauthors PK and DG are employed by Gedeon Richter Ltd. Gedeon Richter Ltd. provided support in the form of salaries for authors PK and DG, and in the form of using the resources of Preclinical Imaging Center of Gedeon Richter Ltd., but did not have any additional role in the study design, data collection and
0.002). In the case of HT-29 adenocarcinoma, the daily treatment with one-twelfth total dose resulted in significantly smaller tumors than the protocol-based treatment (p= 0.038).
When the tumor has a symmetrical, solid closed shape (typically without treatment), volume can be evaluated accurately from caliper-measured data with the applied two-dimensional mathematical model.
Conclusion
Our results provide a theoretical background for a much more effective bevacizumab treat- ment using optimized administration.
Introduction
Bevacizumab (Avastin) [1] is an exogenous inhibitor, which inhibits the biological activity of human VEGF [2]. Several studies have investigated the effectiveness of bevacizumab therapy according to different types of cancer [3]: lung cancer [4,5], breast cancer [6–8], colon cancer [9], renal cell carcinoma [10], gastric cancer [11], pancreatic cancer [12], prostate cancer [13]
and melanoma [14]. The majority of debate over Avastin is about breast cancer because, in 2011, the US Food and Drug Administration (FDA) revoked the approval of Avastin for breast cancer treatment in the absence of decisive therapeutic benefit; however, several clinical trials suggested that Avastin can be effective in breast cancer treatment [6,7].
The 1st Department of Pathology and Experimental Cancer Research of the Semmelweis University (Budapest, Hungary) and the Physiological Controls Group of the Obuda Univer- sity (Budapest, Hungary) began collaborating on antiangiogenic therapy research in 2012— including the current experimental investigations. Small MRI measurements were done in the Preclinical Imaging Center of Gedeon Richter Plc. (Budapest, Hungary). The aim of the experi- ment was to create and validate a clinically relevant tumor growth model (using C38 colon ade- nocarcinoma), focusing on the effect of angiogenesis. Tumor growth was investigated without therapy and with antiangiogenic therapy (using bevacizumab [15]). Examination of tumor growth belongs not only to the basic medical research, but to the biomedical engineering field as well. Based on the experimental data, model identification can be carried out which describes the mathematical model of the investigated biological process. Using the mathematical model, different dosage algorithms can be designed for antiangiogenic cancer therapy [16–19]. Due to the collaboration between medical doctors and biomedical engineers, model-based treatment protocols can be created. These model-based protocols can be more effective than the current ones, since they provide individual treatment for the patients.
The article discusses two results. First is to findan appropriate mathematical model for tumor volume evaluation from caliper-measured data. Tumor as a 3-D object has three diame- ters (width, length and height); however in vivo only two diameters can be measured by caliper (width,wand length,l). To evaluate tumor volume, first the shape of the tumor has to be assumed, and if it is necessary for volume calculation, the third diameter (height,h) has to be approximated. According to the Xenograft tumor model protocol [20], tumor volume has to be calculated using the following formula:
V¼w2l
2: ð1Þ
analysis, decision to publish, or preparation of the manuscript. The specific roles of these authors are articulated in the“author contributions”section.
Competing Interests:The authors have the following interests: Coauthors PK and DG are employed by Gedeon Richter Ltd. Avastin (bevacizumab) is manufactured by Genentech, Inc., South San Francisco, California, USA; EU patent expiry in 2019 in the US and 2022 in EU. There are no further patents, products in development or marketed products to declare. This does not alter the authors’adherence to all the PLOS ONE policies on sharing data and materials.
The advantage of this model is that there is no need to approximate tumor height (which could result in error).
In several recent studies ([21,22]), tumor volume is calculated assuming ellipsoid shape:
V¼4 3pl
2w 2h
2: ð2Þ
Whilst studies have shown that tumors can be better estimated with ellipsoid shape than usingEq 1, calculating the volume of an ellipsoid requires the knowledge of the third parame- ter. A possible solution for height approximation [23] is:
h¼2
3l: ð3Þ
Another relatively new but not widely used approach to estimate tumor volume is to assume hemi-ellipsoid shape [24]. In this case, tumor volume has to be calculated in the following way:
V¼pl 2w
2h
2: ð4Þ
This estimation has the same disadvantage as ellipsoid estimation, i.e. tumor height has to be approximated.
From the abovementioned methods, the consequence is that the promising new direction in tumor volume evaluation is the dimension reduction, namely to find a statistical constant which can replace the need of measuring the tumor height. A two-dimensional mathematical model was created from the experimental results of BALB/c mice with KHJJ tumor line [25]:
V¼p
6f ðlwÞ3=2; ð5Þ
wherefis a constant which belongs to a certain tumor type. This formula was the starting point of our examination tofind an appropriate mathematical model.
The second result which is discussed in the article iscomparison of the effectiveness of bevaci- zumab administration in the case of protocol-based and quasi-continuous therapies. The effec- tiveness strongly depends on the administration, and a drug which is effective on a molecular level can be applied in a less effective way because of the incorrectly chosen administration.
Our hypothesis is that the effectiveness of a lower dosage with a quasi-continuous therapy can be comparable with the protocol therapy.
Materials and Methods Ethics statement
The study was carried out in strict accordance with the recommendations in the Guide for the Care and Use of Laboratory Animals of the National Institutes of Health. The protocol was approved by the Hungarian Animal Experimental Research Ethics Council (Állatkísérleti Tudományos Etikai Tanács, ATET), Permit Number: 22.1/1159/3/2010. All surgery and sacri- fice were performed under sodium pentobarbital anaesthesia (Nembutal, 70 mg/kg), and all efforts were made to minimize suffering. Animals were carried out in the most humane and environmentally sensitive manner possible; in addition the 3Rs principle (replacement, refine- ment, reduction) was adequately implemented according to the Directive 2010/63/EU of the European Parliament. Mice were monitored daily. Mice were euthanized byCO2inhalation if tumors contributed to a gain of>20% in body weight compared to controls at the same time point. Mice were humanely sacrificed using cervical dislocation.
Overview of the phases
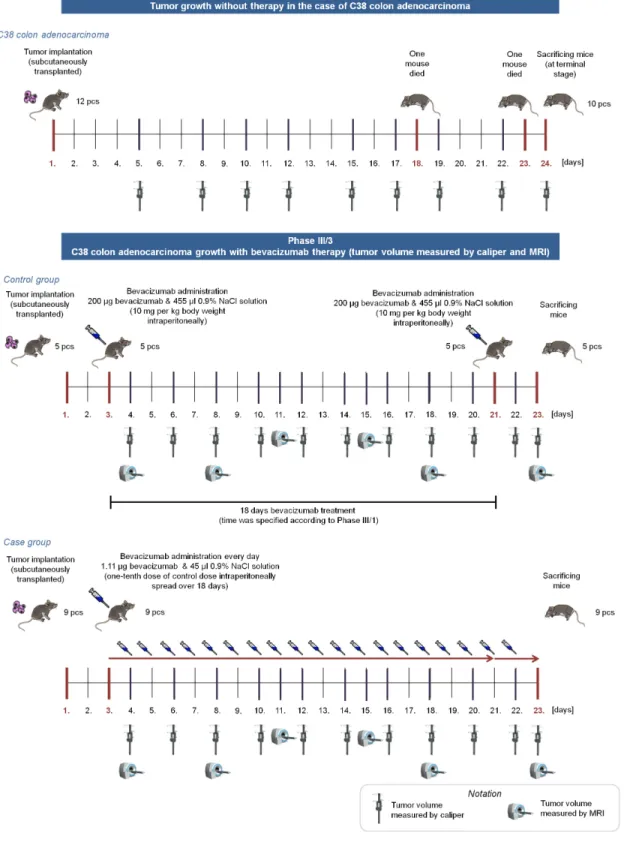
The whole experiment consisted of four phases; the article focuses on the Phase III/3 and its results together with the comparison of Phase I and Phase III/3 (Fig 1).
InPhase I, we have investigated tumor growth without therapy with two types of mouse tumor. 12 immunocompetent mice were transplanted subcutaneously with C38 colon adenocar- cinoma, and 11 immunocompetent mice were injected intramuscularly with B16 melanoma.
Tumor volume was measured with digital caliper. Results of this phase can be found in [26].
InPhase II, the toxicology investigation of the applied angiogenic inhibitor (bevacizumab) was performed; there was no tumor implantation into mice in this phase. We monitored the vital parameters of 4 immunocompetent mice, and there was no serious toxic side-effect or lethality regarding to the usage of bevacizumab.
InPhase III, we have investigated C38 colon adenocarcinoma growth with bevacizumab therapy. Phase III contained three subphases, in every subphases two groups were created; con- trol group received bevacizumab in one dose according to the protocol, while case group received substantially lower doses every day. In the first subphase (Phase III/1), control group members (5 immunocompetent mice) received 10 mg per kg body weight bevacizumab, while case group members (5 immunocompetent mice) received one-tenth dose of control dose spread over 18 days. Bevacizumab administration was started on the 7th day in both cases.
Quantity of the optimal solvent administration was also examined in this subphase. Tumor volume was measured with digital caliper. The second subphase (Phase III/2) was similar to Phase III/1, mice received the same dosage of bevacizumab as in Phase III/1, however sample size was higher (6 immunocompetent mice in control group, 12 immunocompetent mice in case group), and bevacizumab administration started earlier, on the 3rd day of the experiment.
Tumor volume was measured with digital caliper as well. Result of Phase III/2 was that the effectiveness of the small amount of quasi-continuous dosage is comparable with the effective- ness of one large dose [23], however this result is only based on caliper-measured data. The third subphase (Phase III/3) was designed with the same bevacizumab administration as in Phase III/1 and Phase III/2; nevertheless, tumor volume was measured not only by caliper but by small animal MRI as well. In this phase, 5 immunocompetent mice in control group, and 9 immunocompetent mice in case group were used.
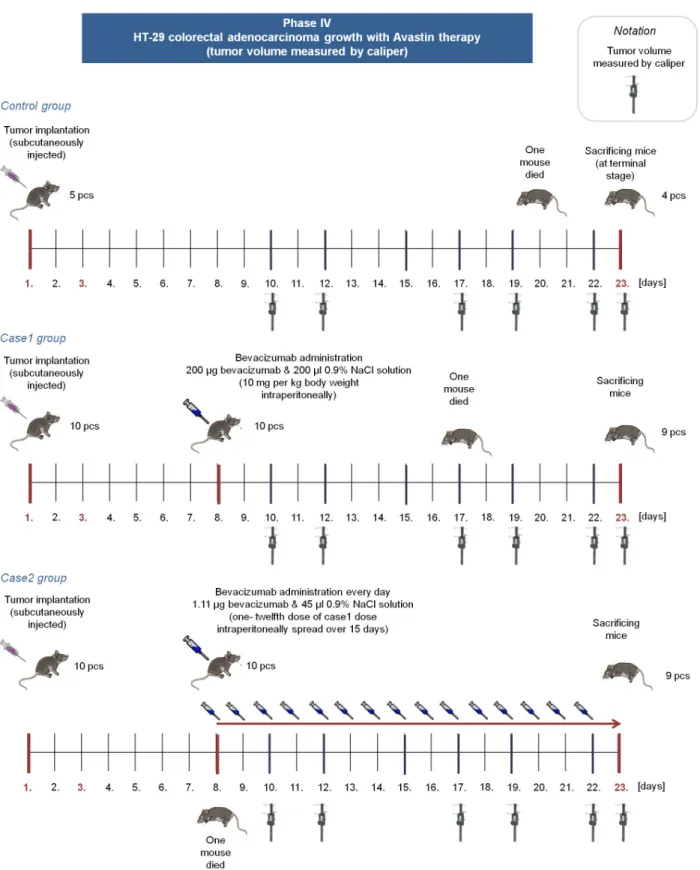
Bevacizumab is a humanized monoclonal antibody, therefore the effectivity of bevacizumab therapy in mice is not trivial. Although there are studies which confirme that“bevacizumab is as effective as the murine anti-VEGF-R2 antibody (DC101) in mouse models”([27,28]), we extended our experiments and performedPhase IV, where immunocompromized (SCID) mice were used with human colorectal adenocarcinoma (HT-29) xenografts. In this phase, three groups were created. Mice in the control group received no treatment (5 mice); case1 group members (10 mice) received 10 mg per kg body weight bevacizumab in one dose; while case2 group members (10 mice) received 1/180 dose of control dose for 15 days. (Fig 2).
Tumor implantation and bevacizumab administration
In Phase I, Phase II and Phase III, eight weeks old male C57Bl/6 mice with implanted C38 mouse colorectal carcinoma was used. In Phase IV, eleven weeks old male SCID mice with implanted HT-29 human colorectal adenocarcinoma was used. Mice were monitored daily by personnel experienced in recognizing signs of morbidity (illness, injury, or abnormal behavior) also in weekends and holidays. The C38 colorectal carcinoma line was maintained by serial subcutaneous transplantations in C57Bl/6 mice. (Inbred C57Bl/6 mice from our institute were used throughout the studies.) In Phase I, Phase II and Phase III, a piece of C38 colon adenocar- cinoma was transplanted subcutaneously in the recipient animal on the 1st day of the
Fig 1. Overview of Phase I and Phase III/3.In Phase I, tumor growth was investigated without antiangiogenic therapy for 24 days (mice were sacrificed when the tumor reached a lethal size). In Phase III/3, control group members received one 200μgbevacizumab dose for an 18-day therapy (on the 3rd and 21st days); case group members received 1.11μgbevacizumab every day for 20 days.
doi:10.1371/journal.pone.0142190.g001
Fig 2. Overview of Phase IV.In Phase IV, control group members received no bevacizumab. Case1 group members received one 200μgbevacizumab dose on the 8th day, case2 group members received 1.11μgbevacizumab from the 8th day every day for 15 days.
doi:10.1371/journal.pone.0142190.g002
experiment (approximately 2106cells were transplanted into each mouse). In Phase IV, approximately 2.9106cells were injected subcutaneously into each SCID mouse. Tumor was located in the last third of the back of the mouse in every case.
Mice in Phase I and Phase IV control group received no bevacizumab. Mice in Phase III/3 control and case groups, and mice in Phase IV case1 and case2 groups received bevacizumab.
Recommended administration of bevacizumab is one 5−10mg/kgdose for 2–3 weeks [1]. We have administered 10mg/kgbody weight intraperitoneally, which means 200μgbevacizumab per a mouse, since the mass of the mice in the experiment was approximately 20g(in the case of C57Bl/6 and SCID mice as well). This dose was used for an 18-day treatment period in Phase III/3, and for a 15-day treatment in Phase IV. In Phase III/3, control group members received 200μgbevacizumab (with 455μl0.9% NaCl solution) in one dose intraperitoneally on the 3rd day and on the 21st day. In Phase III/3, case group members received one-tenth dose of control dose intraperitoneally spread over 18 days. It means that a mouse of the case group received 1.11μgbevacizumab (with 45μl0.9% NaCl solution) every day from the 3rd day for 20 days. In Phase IV, case1 group members received 200μgbevacizumab (with 200μl0.9%
NaCl solution) in one dose intraperitoneally on the 8th day. In Phase IV, case2 group members received 1.11μgbevacizumab (with 45μl0.9% NaCl solution) every day form the 8th day for 15 days. The reason for choosing this type of administration was as follows: a) we wanted to use a daily dose in order to investigate the biological effect of frequent impulse-like control sig- nal for the future controller design; b) we wanted to examine such a low dose which has practi- cally no side-effect but presumably is still effective.
Tumor volume measurement
Tumor volume measurement cannot happen right after tumor implantation. In the case of C38 colon adenocarcinoma, first, the subcutaneously transplanted piece of tumor has to disinte- grate, and after that the new tumor colony (which needs to be measured) can begin to grow from the disintegrated tumor cells. This process takes 4–5 days. The first measurement in Phase I occurred on the 5th day; in Phase III/3, it occurred on the 4th day. In Phase IV, the first measurement occurred when the tumors have reached an average volume of 50–60mm3 (according to the xenograft protocol [20]). It was on the 10th day, since HT-29 colorectal ade- nocarcinoma grows slower in mice than C38 colon adenocarcinoma.
Tumor volume was measured in two different ways. First way is the caliper measurement;
in that case tumor diameters (width, length) are measured with digital caliper. It can be carried out in vivo during the experiment due to the subcutaneous localization of the tumor. Tumor volume (and the third diameter) has to be approximated, assuming a certain shape for the tumor. Measurements with caliper were done on the 5th, 8th, 10th, 12th, 15th, 17th, 19th, 22nd and 24th days of the experiment in Phase I; in the case of Phase III/3, they were done on the 4th, 6th, 8th, 10th, 12th, 14th, 16th, 18th, 20th, 22nd and 23rd days. In Phase IV, the caliper measurement days were the 10th, 12th, 17th, 19th, 22nd and 23rd days.
The other way to measure tumor volume is the usage of small animal MRI, a non-invasive in vivo technology giving the possibility of a more precise volume measurement [29]. In the experiment 9.4 Tesla field strength Varian small-animal MRI was used. Isofluorane (0.95 x 2.0%) was applied for inhalational anesthesia, and intubation was performed. Catheter was placed in the tail vein for injection—according to the mouse tail vein injection protocol [30]—
to investigate drug effect. Position of the mouse was fixed to minimize the movement of the animal. Tumor was located in the last third of the back in every cases, thus the effect of respira- tory movement was minimal. During the MRI measurements, life parameters of the mice were monitored. Breathing was monitored with piezoelectric transducer; temperature of the body
was measured by rectal thermometer. The produced images were converted to NIfTI (Neuro- imaging Informatics Technology Initiative) format, which is suitable for image processing.
Tumor area was determined with flood fill algorithm [31] from the slides; by knowing the vol- ume of a voxel, tumor volume was calculated from these two values.
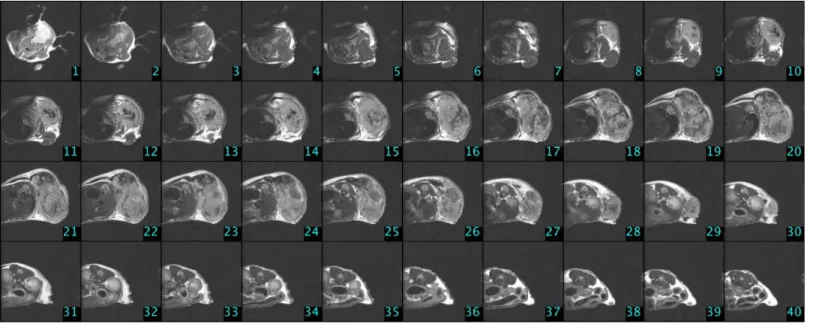
Contrast agents improve the visibility, but it is an extra strain to the organism, which can be lethal to animals which are in the final stage of cancer. We have found in our previous study [32] that measurements without contrast agents resulted in high quality images, where tumor can be circumscribed precisely, thus the usage of contrast is unnecessary. In the case of Phase I and Phase IV, there were no MRI measurements. Measurements with small animal MRI were done on the 4th, 8th, 11th, 15th, 18th and 23rd days of the experiment in Phase III/3. In the first four measurement times 30 slices were done from each mouse; in the last two measure- ment times 40 slices were done from each mouse due to the larger tumor volume. One can see experimental settings inTable 1, while MRI image of a control group mouse (C4) that was measured at the end of the experiment can be found inFig 3.
Table 1. Experimental settings for small animal MRI measurement.
30 slices 40 slices
Pulse sequence: T1WI, sequence: FSE, Pulse sequence: T1WI, sequence: FSE, FOV: 25 x 25, spatial resolution: 128 x 128 x 30, FOV: 30 x 30, spatial resolution: 128 x 128 x 40,
voxel size: 0.1953 x 0.1953 x 1 mm, voxel size: 0.2343 x 0.2343 x 1 mm,
TR: 1800 ms, ESP: 7 ms, TR: 2500 ms, ESP: 7 ms,
axial orientation: axial 90°,flip angle: 90°, axial orientation: axial 90°,flip angle: 90°, averages: 12, scan time: 5 min 53 s averages: 10, scan time: 6 min 45 s In thefirst four measurement times 30 slices, in the last two measurement times 40 slices were done from each mouse. Abbreviations: T1WI: T1 weighted image, FSE: Fast Spin Echo, FOV: Field of View [mm2], TR: Repetition Time, ESP: Echo Spacing.
doi:10.1371/journal.pone.0142190.t001
Fig 3. MRI slices in the case of a control group mouse (C4) on the 23rd day of the experiment (Phase III/3).
doi:10.1371/journal.pone.0142190.g003
Sacrificing mice, immunohistochemistry
Clinical aspects which have to be considered to determine when animals should be euthanized are body weight, physical appearance, measurable clinical signs, unprovoked behavior and response to external stimuli. Clinical criteria that establish when the endpoint have to be car- ried out: a) if tumors contributed to a gain of>20% in body weight compared to controls at the same time point; b) tumors that ulcerate, become necrotic or infected; c) any animal found unexpectedly to be moribund, cachectic, or unable to obtain food or water. All surgery and sac- rifice were performed under sodium pentobarbital anaesthesia (Nembutal, 70 mg/kg). Mice were humanely sacrificed using cervical dislocation. No animals were sacrificed before the experimental endpoint. The size of maximum tumor volumes observed in our study fulfills the requirements of Hungarian animal experimental research protocol.
In Phase I, mice were sacrificed when the tumor reached a lethal size; it was on the 24th day of the experiment. In the case of Phase III/3 and Phase IV, period of time was specified accord- ing to the previous phases (Phase I and Phase III/1); mice were sacrificed on the 23rd day of the experiment. After sacrificing mice, tumors were removed, and their mass was measured.
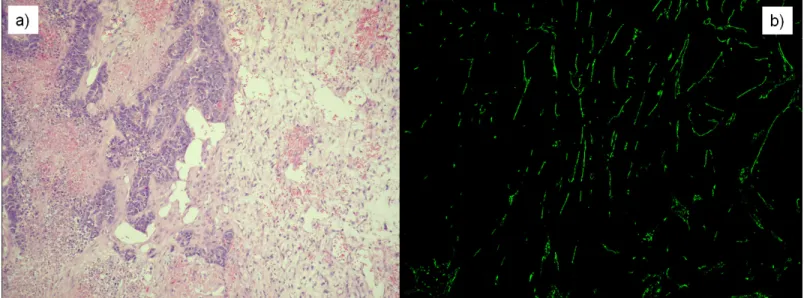
Tumors were cut into two pieces for sample processing: one piece was stored in formalin, and the other piece was frozen using liquid nitrogen. Tumor morphology was investigated using standard Haematoxylin Eosin staining on the samples stored in formalin. Frozen samples were used to create 15μmfrozen cuts. After fixing in methanol, rat anti-mouse CD31 antibody (1:50, 550274 BD PHARMINGEN) was applied as primer antibody, and FITC conjugated anti- rat CD31 antibody (1:100, Jackson Immunoresearch, 712-095-150) was applied on the slides as secondary antibody. After staining, fluorescence pictures were done from the slides using con- focal microscope (BIO-RAD MRC-1024). These images were applied to calculate vasculariza- tion area by using ImageJ (NIH, USA) [33] software (Fig 4).
Statistical analysis
To compare the effectiveness of the different investigated treatment methods, statistical analy- sis was used. PASW Statistics 18 (SPSS Statistics, IBM, USA) and Matlab R2009b (MathWorks,
Fig 4. Stained slices in the case ofn1mouse (Phase I, 24th day of the experiment).a) Haematoxylin Eosin (H&E) staining was applied to investigate tumor morphology. b) Fluorescence picture was created using CD31 antibody immunohistochemistry staining to calculate vascularization area.
doi:10.1371/journal.pone.0142190.g004
USA) were used for statistical analysis. Normality was investigated with one-sample Kolmogo- rov-Smirnov test, and homogeneity of variance (homoscedasticity) was examined with Levene’s test. Analysis of Variance (ANOVA) test was used to compare more than two sam- ples, while pairwise comparison was done by Tukey’s honest significant difference (HSD) test.
Correlation was investigated with Pearson’s rank correlation test (Pearson’sR) and coefficient of determination (R2).
Results
In Phase I, 12 mice were implanted with C38 colon adenocarcinoma. One of them died on the 18th day, and another one on the 23rd day. The cause of death was tumor toxicity; however, none of the clinical criteria for euthanasia could be observed at these animals. In Phase I, 10 mice were sacrificed at the 24th day of the experiment. In Phase III/3, control group contained 5 mice, case group contained 9 mice; all mice were implanted with C38 mouse colon adenocarcinoma.
No mice died during the experiment, therefore 5 mice from the control group, and 9 mice from the case group were sacrificed on the 23rd day. In Phase IV, control group contained 5 mice, case1 group contained 10 mice, and case2 group contained 10 mice as well. All mice were implanted with HT-29 human colorectal adenocarcinoma. In the control group, one mouse died on the 20th day due to tumor toxicity. In the case1 group, one mouse died on the 17th day.
Autopsy revealed large metastasis in the lung, this is the suspected cause of the death. In the case2 group, one mouse died on the 8th day, before the therapy (bevacizumab administration) started. Autopsy revealed only minimal local tumor; however death was not caused by tumor.
Comparing the results of caliper and MRI measurements; finding an appropriate mathematical model for tumor volume evaluation from caliper-measured data
In Phase III/3, MRI-measured tumor volume values are available which can be used as refer- ence values for caliper-measured data. Applying the two-dimensional mathematical model (described inEq 5) the goal is to find thefconstant which belongs to the C38 colon adenocarci- noma and the treatment type. Starting withf= 1, we have investigated the goodness of the fit- ting, using an iterative method. Our results for the case group (daily, quasi-continuous small amount administration) and the control group (one big dose according to the protocol) are
VpIII=3case¼p
66:08 ðlwÞ3=2!fpIII=3case¼6:08; ð6Þ
VpIII=3 control¼p
63:68 ðlwÞ3=2!fpIII=3control¼3:68: ð7Þ
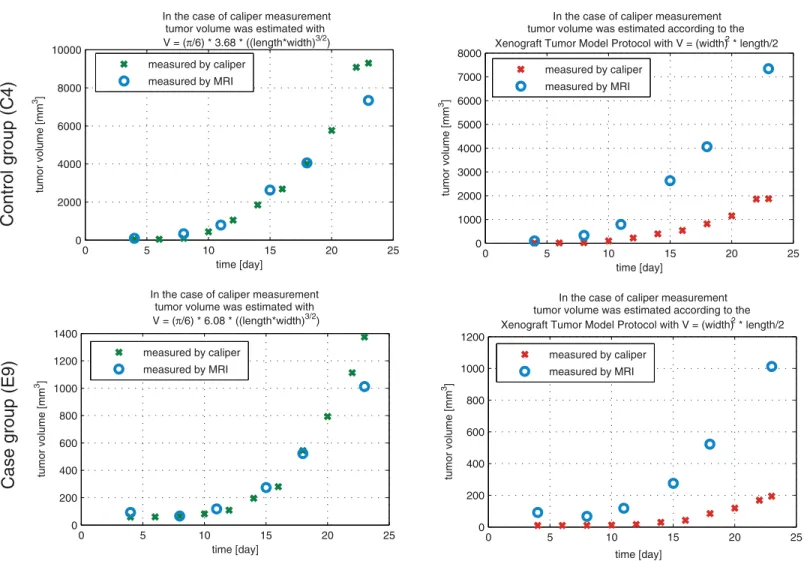
Usage of this formula to calculate tumor volume from length and width values resulted in much more precise approximation of the MRI-measured tumor volume than protocol-based calculation. Numerical result can be found inTable 2, andFig 5presents graphical results.
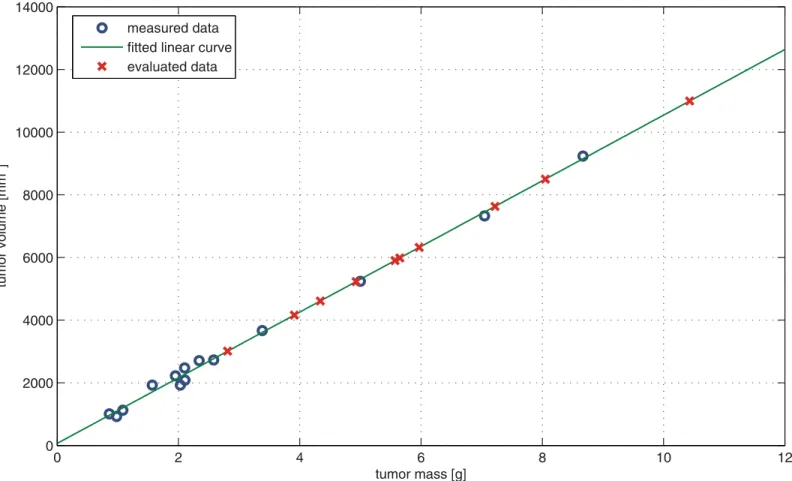
To find thefconstant for tumor growth without therapy (Phase I), first reliable tumor vol- ume values had to be found, since there was no MRI measurement in Phase I. Beside tumor diameters, tumor mass was measured and vascularization area was calculated in the case of the removed tumors. We have investigated the relationship between MRI-measured tumor volume and vascularization area (Phase III/3 case and control groups, 23rd (final) day of the experi- ment) but no significant correlation was found (same results were published in the case of Phase I [26] and Phase III/2 [23]). Examining the relationship between MRI-measured tumor volume and tumor mass values, we have found a very strong linear correlation (R= 0.998,R2=
0.996,p<0.0001). It means that knowing the tumor mass, tumor volume can be estimated with suitable accuracy; hence the lack of MRI measurement can be replaced in the case of Phase I. In the light of the above mentioned, linear curve fitting was carried out to find the mathematical relationship between MRI-measured tumor volume and tumor mass (Phase III/3 case and control groups). The resulted linear curve is
v¼1047:7mþ67:1; ð8Þ
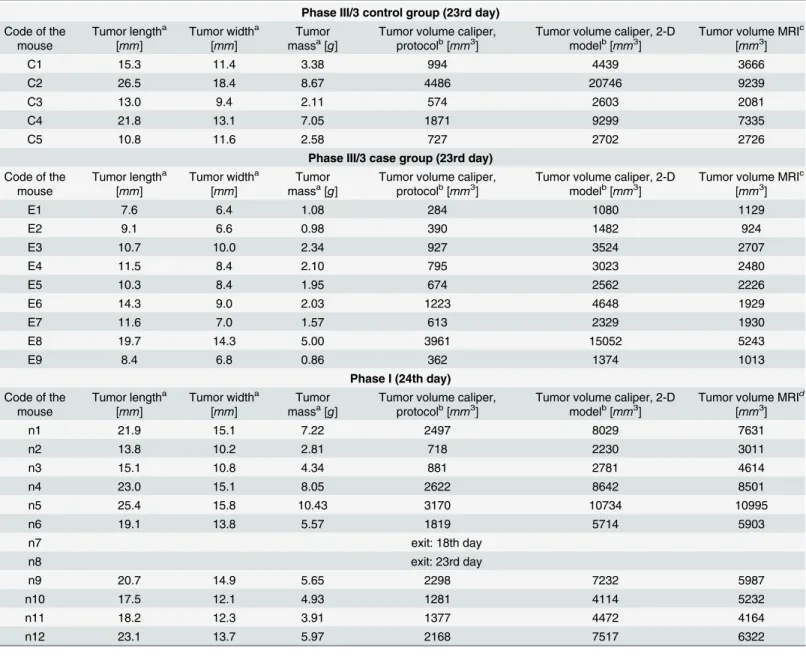
Table 2. Experimental data of C38 mouse colon adenocarcinoma (tumor length, tumor width, tumor mass and tumor volume).
Phase III/3 control group (23rd day) Code of the
mouse
Tumor lengtha [mm]
Tumor widtha [mm]
Tumor massa[g]
Tumor volume caliper, protocolb[mm3]
Tumor volume caliper, 2-D modelb[mm3]
Tumor volume MRIc [mm3]
C1 15.3 11.4 3.38 994 4439 3666
C2 26.5 18.4 8.67 4486 20746 9239
C3 13.0 9.4 2.11 574 2603 2081
C4 21.8 13.1 7.05 1871 9299 7335
C5 10.8 11.6 2.58 727 2702 2726
Phase III/3 case group (23rd day) Code of the
mouse
Tumor lengtha [mm]
Tumor widtha [mm]
Tumor massa[g]
Tumor volume caliper, protocolb[mm3]
Tumor volume caliper, 2-D modelb[mm3]
Tumor volume MRIc [mm3]
E1 7.6 6.4 1.08 284 1080 1129
E2 9.1 6.6 0.98 390 1482 924
E3 10.7 10.0 2.34 927 3524 2707
E4 11.5 8.4 2.10 795 3023 2480
E5 10.3 8.4 1.95 674 2562 2226
E6 14.3 9.0 2.03 1223 4648 1929
E7 11.6 7.0 1.57 613 2329 1930
E8 19.7 14.3 5.00 3961 15052 5243
E9 8.4 6.8 0.86 362 1374 1013
Phase I (24th day) Code of the
mouse
Tumor lengtha [mm]
Tumor widtha [mm]
Tumor massa[g]
Tumor volume caliper, protocolb[mm3]
Tumor volume caliper, 2-D modelb[mm3]
Tumor volume MRId [mm3]
n1 21.9 15.1 7.22 2497 8029 7631
n2 13.8 10.2 2.81 718 2230 3011
n3 15.1 10.8 4.34 881 2781 4614
n4 23.0 15.1 8.05 2622 8642 8501
n5 25.4 15.8 10.43 3170 10734 10995
n6 19.1 13.8 5.57 1819 5714 5903
n7 exit: 18th day
n8 exit: 23rd day
n9 20.7 14.9 5.65 2298 7232 5987
n10 17.5 12.1 4.93 1281 4114 5232
n11 18.2 12.3 3.91 1377 4472 4164
n12 23.1 13.7 5.97 2168 7517 6322
Data was measured at thefinal day of Phase I (24th day) and Phase III/3 (23rd day).
aDirectly measured data (tumor length, tumor width, tumor mass)
bEstimated data (tumor volume measured by caliper, calculated according to Xenograft tumor model protocol or two-dimensional mathematical model)
cMRI-measured data (tumor volume calculated withfloodfill algorithm)
dEvaluated data (“MRI”tumor volume calculated from linear curvefit (seeEq 8)) doi:10.1371/journal.pone.0142190.t002
wherevis tumor volume [mm3] andmis tumor mass [g]. Substituting tumor mass values which were measured in Phase I intoEq 8, the corresponding tumor volume values can be eval- uated (one canfind numerical results inTable 2Tumor volume“MRI”column; and graphical results inFig 6). The last step is tofind thefconstant of the two-dimensional mathematical model for tumor growth without therapy (Phase I). Using the above mentioned iterative method, the resulted equation is
VpI¼p
62:55 ðlwÞ3=2!fpI ¼2:55: ð9Þ
One can see fromTable 2that the goodness of the fit is different in the case of Phase I (tumor growth without therapy) and in the case of Phase III/3 (tumor growth with antiangio- genic therapy). Investigating the results of Phase III/3 one can observe that the two-dimen- sional mathematical model has good estimation property when the tumor width and length values are small; however, for large tumor diameter values the estimation could result in
Fig 5. Validation of caliper-measured data.The figure shows the results of a mouse (C4) from control group (first row), and a mouse (E9) from case group (second row). The first column shows the tumor values which were calculated using the two-dimensional mathematical model; the second column represents the protocol-based tumor volumes. In each case the reference value is the MRI-measured tumor volume. One can see that the two-dimensional
mathematical model fits to the MRI-measured values, while the protocol-based values present totally different curve.
doi:10.1371/journal.pone.0142190.g005
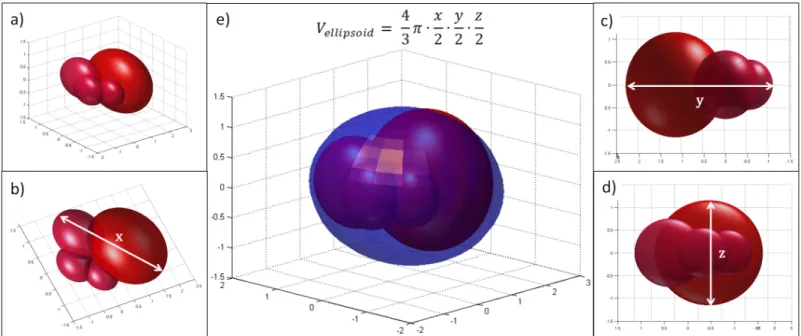
significant error, the estimated value is greater than the measured one (outliers areE8,C2). In the case of Phase I, no similar problem occurs; the two-dimensional mathematical model can handle great values as well (e.g.n5). This problem can be explained by our observation, namely tumors which were grown without therapy have more symmetric and solid closed shape, in contrast to tumors which were grown under antiangiogenic therapy. We have found that mice which have received therapy had tumor with irregular, and in several cases berry-shaped struc- ture, especially when reaching large volume. In that case—even though all the three diameters can be measured—the estimation of the volume has quite a large error. A 3-D illustration can be found inFig 7.
Comparing the effectiveness of bevacizumab administration in the case of protocol-based and quasi-continuous therapies
The results of the three investigated cases using C38 mouse colon adenocarcinoma (Phase I, Phase III/3 control group, and Phase III/3 case group) were compared using tumor volume val- ues from MRI measurements (Phase III/3 control and case groups, 23rd day) and evaluated data (Phase I“MRI”tumor volume calculated from linear curve fit, 24th day). One can find datasets in the last column ofTable 2. Normality was investigated with one-sample
Fig 6. Evaluation of Phase I tumor volume values.“Measured data”is the MRI-measured tumor volume—tumor mass pairs on the 23rd day of Phase III/3 (case and control group). For this dataset, linear curve fitting was carried out (“fitted linear curve”) to find the mathematical relationship between MRI- measured tumor volume and tumor mass. Substituting tumor mass values which were measured on the 24th day of Phase I to the equation of the resulted curve, the corresponding tumor volume values can be evaluated (“evaluated data”).
doi:10.1371/journal.pone.0142190.g006
Kolmogorov-Smirnov test; each sample has normal distribution (ppI= 0.883,ppIII/3_case= 0.716,ppIII/3_control= 0.869). Homogeneity of variance was examined with Levene’s test; the sample variances are equal (p= 0.052).
To compare more than two samples, ANOVA test was applied. We have found that there is significant difference between the means of the samples (p= 0.002, using 0.05 level of signifi- cance). Pairwise comparison was done by Tukey’s honest significant difference test to find those samples, which have significantly different means. The post hoc test resulted in the fol- lowing. Phase I and Phase III/3 control groups are not significantly different (p= 0.572), while Phase I and Phase III/3 control groups are significantly different (p= 0.002). This means that mice which were treated with the recommended bevacizumab protocol (one 200μgbevacizu- mab dose for an 18-day therapy) did not have significantly smaller tumor volume than mice which did not receive therapy at all. However mice which were treated with a quasi-continuous therapy (one-tenth dose of control dose spread over 18 days, i.e. 1.11μgbevacizumab every day) had significantly smaller tumor volume than mice that did not receive therapy. Average of tumor volumes for every measurement days of the experiment can be seen inFig 8.
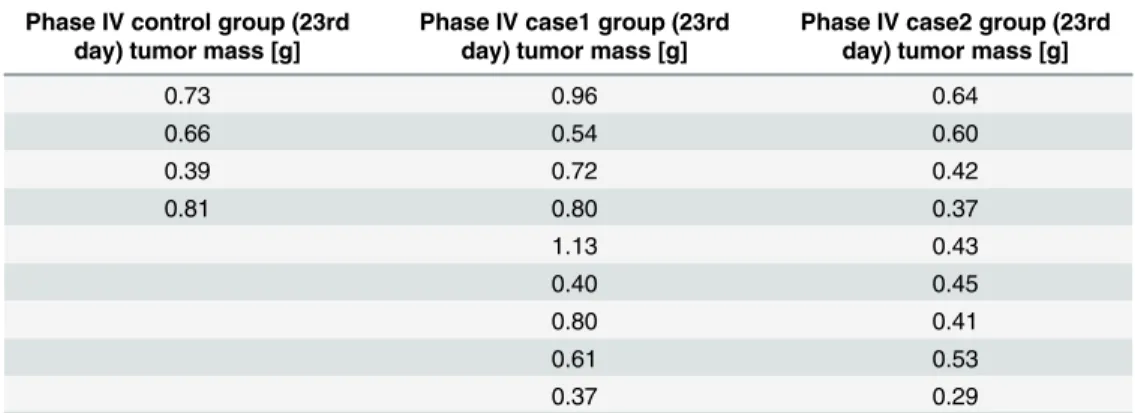
To validate our results which come from the experiments where mouse tumor vascularization was inhibited with humanized VEGF, we evaluated the results of Phase IV, where immunocom- promized (SCID) mice were used with human colorectal adenocarcinoma (HT-29) xenografts.
In this phase, control group members received no treatment; case1 group members received one 200μgbevacizumab dose; while case2 group members received 1.11μgbevacizumab daily for 15 days (the total dose of case2 group members is the one-twelfth dose of case1 group members).
For the most precise result, tumor mass values, which were measured at the end of the experi- ment, were compared in the statistical analysis. One can find datasets inTable 3. Pursuant to one-sample Kolmogorov-Smirnov test, each sample has normal distribution (ppIV_control= 0.981, ppIV_case1= 0.998,ppIV_case2= 0.854). Levene’s test showed that the sample variances are equal
Fig 7. Illustration for tumor with irregular structure (berry-shaped).a) berry-shaped tumor; b)x-diameter of the tumor; c)y-diameter of the tumor; d)z- diameter of the tumor; e) berry-shaped tumor with ellipsoidal estimation. Even though all the three diameters can be measured, the estimation of the volume has quite a large error.
doi:10.1371/journal.pone.0142190.g007
(p= 0.108). The means of the samples arempIV_control= 0.65,mpIV_case1= 0.70,mpIV_case2= 0.46.
ANOVA test showed significant difference between these means (p= 0.041, using 0.05 level of significance). Tukey’s HSD test resuled in significant difference between case1 and case2 groups (p= 0.038). This means that the daily treatment with one-twelfth total dose resulted in signifi- cantly smaller tumors than the protocol-based treatment.
Fig 8. Average of tumor volumes for every measurement days of the experiment in the case of Phase I, Phase III/3 control and Phase III/3 case group.The significant difference between quasi-continuous therapy (Phase III/3 case group) and tumor growth without treatment (Phase I) was proved with statistical analysis as well.
doi:10.1371/journal.pone.0142190.g008
Table 3. Experimental data of human colorectal adenocarcinoma (HT-29) xenografts (tumor mass).
Phase IV control group (23rd day) tumor mass [g]
Phase IV case1 group (23rd day) tumor mass [g]
Phase IV case2 group (23rd day) tumor mass [g]
0.73 0.96 0.64
0.66 0.54 0.60
0.39 0.72 0.42
0.81 0.80 0.37
1.13 0.43
0.40 0.45
0.80 0.41
0.61 0.53
0.37 0.29
doi:10.1371/journal.pone.0142190.t003
Discussion
Since 2004, the target therapy of bevacizumab (Avastin) is widely used to treat colorectal [9], kidney [10], cervical [34], ovarian [35], non-small cell lung cancers [5], melanoma [14] and certain brain tumors (e.g. recurrent glioblastoma (rGBM) [36]) as a first or second line treat- ment, usually in combination with chemo- or immunotherapy. The usual administration is via intravenous infusion; once every 2 or 3 weeks. The dose depends mainly on weight. However, most serious questions are: for how long and continuous or not? The most recent ESMO (European Society for Medical Oncology) consensus guidelines suggest that treatment discon- tinuation or maintenance are feasible options after 4–6 months of full-dose first-line therapy to treat colon and rectal adenocarcinoma [37]. However, if the treatment is lengthy, the problem of side-effects also has to be considered. To overcome all of these difficulties (continuity of the administration and side-effects), model identification should be determined and then a control algorithm (controller) can be designed for the created mathematical model. Of course, for the closed-loop design frequent and precise tumor volume measuremets are required, thus the problem of tumor volume measurement has to be solved as well. Finding the mathematical relationship between MRI-measured tumor volume and tumor mass creates the possibility to estimate tumor volume from caliper-measured data. However, it has to be taken into consider- ation that in several cases using antiangiogenic therapy, tumor shape is irregular (berry- shaped). Consequently, when tumor mass data is unavailable (during the experiment), tumor volume value can be validated with MRI; in that way outlier data points (which were calculated using the two-dimensional mathematical model) can be filtered out. In clinical practice, the determination of the tumor size (volume) is done by MRI and/or CT, but this is for the purpose of validating the effectiveness of the treatment, and therefore it is not a continuous monitoring.
In the concept of model-based treatment, a continuous and precise tumor volume monitoring is needed concerning which, may be possible in the near future by nanotechnology [38].
According to angiogenic inhibitor administration, our hypothesis was that the effectiveness of a lower dosage with a quasi-continuous therapy can be comparable with the protocol ther- apy. Nevertheless the result of our study shows that the effectiveness is even better. Conse- quences are manifold. First of all, our hypothesis according to the importance of
administration is proved. The effectiveness of the quasi-continuous (daily) 1/180 dosage (1.11 μgrelative to 200μg) using C38 mouse colon adenocarcinoma was more effective than one large dose. We found the same result for human colorectal adenocarcinoma (HT-29) xeno- grafts. The explanation of the effectiveness of low dose VEGF therapy is the following ([39– 44]). Healthy tissues have efficient vasculature and effective blood supply due to the balance of proangiogenic and antiangiogenic factors. When tumor cells become able to produce proangio- genic factors (the process is called as angiogenic switch), it will result in abnormal and ineffi- cient vascular network (with high vascular permeability and poor perfusion) due to the hurried process of vessel formation. Tumor growth can take place under such conditions; however delivery of chemotherapeutic drugs is obstructed. Hence, the first step has to be the vasculature normalization with the reconstruction of the balance of pro- and antiangiogenic factors. This means that continuous, low dose antiangiogenic factor (VEGF) administration is needed. This creates the possibility of further efficient therapeutic agent use (if any) or assists the more effec- tive direct antitumoral effect of bevacizumab.
Similarly, Zhang et al. [45] have found that the combination of low-dose cyclophosphamide and ginsenoside Rg3 therapy can be more effective than the normal administration. Although the low dose bevacizumab therapy is well known in the literature, we found no article (in the English literature) regarding very low dose and quasi-continuous bevacizumab therapy, as used in our study. Secondly, the aspect of side-effects are not inconsiderable. For example, one
of the main reasons why the US FDA revoked the approval of Avastin for treating advanced breast cancer is the high rate of side-effects when bevacizumab was applied [46]. Typical side- effects and adverse events are arterial and venous thromboembolic events, bleeding, hyperten- sion, febrile neutropenia, infections, proteinuria, mucositis, and hand-foot syndrome. Using an extremely low dosage (as in our study), there is a high probability that these adverse effects can be minimized.
In our study, we applied a two-dimensional mathematical model and determined the corre- sponding tumor- and therapy-specific constants in the three investigated cases (C38 colon ade- nocarcinoma growth without therapy, C38 colon adenocarcinoma growth with protocol-based bevacizumab therapy and C38 colon adenocarcinoma growth with quasi-continuous bevacizu- mab therapy). This helps to calculate accurate tumor volume from caliper measured data which will be useful for further animal experiments and as a consequence no small MRI mea- surements will be needed. In addition, we have found that the quasi-continuous administration of bevacizumab is effective against tumor growth of C38 colon adenocarcinoma, in contrast to protocol-based treatment. Considering the possibility of precise tumor volume determination and the effective quasi-continuous drug administration, it opens a new treatment choice based on closed-loop control. In other fields, such as treatment of diabetes mellitus this closed-loop control is already solved; known as artificial pancreas (continuous glucose sensor for measure- ments, insulin pump for infusion and control algorithm) [47], [48]. Similarly, we may have the possibility to a) measure the tumor volume using nanotechnology, b) create a pump for drug administration and c) design control algorithms for specific tumor types. Controller-based therapy has the obvious advantage against e.g. constant low-dose therapy because in the case of controller-based administration, the control signal (administration dose) can vary from zero to the maximum tolerable dose according to the perceived tumor volume. In this way, the tar- geted therapy can be used in a much more individualized form.
Acknowledgments
The authors say special thanks to Katalin DezsőMD. PhD from the 1st Department of Pathol- ogy and Experimental Cancer Research Institute from Semmelweis University, Budapest, for making the fluorescence pictures with confocal microscope. The authors also say thanks to András Sztodola, from the 1st Department of Pathology and Experimental Cancer Research Institute from Semmelweis University Animal Laboratory, for his technical help during the experiments.
Author Contributions
Conceived and designed the experiments: ZS JS. Performed the experiments: JS ZS PK DG.
Analyzed the data: JS ZS PK DG DAD LK. Contributed reagents/materials/analysis tools: ZS PK LK. Wrote the paper: JS ZS PK LK.
References
1. Genentech (2013). Prescribing information of Avastin (Bevacizumab). Available:http://www.gene.com/
download/pdf/avastin_prescribing.pdf. Accessed 1 December 2014.
2. European Medicines Agency (2005). Scientific discussion of Avastin. Available:http://www.ema.
europa.eu/docs/en_GB/document_library/EPAR_-_Scientific_Discussion/human/000582/
WC500029262.pdf. Accessed 1 December 2014.
3. Amit L, Ben-Aharon I, Vidal L, Leibovici L, Stemmer S (2013) The impact of bevacizumab (Avastin) on survival in metastatic solid tumors—a meta-analysis and systematic review. PLoS One 8(1): e51780.
doi:10.1371/journal.pone.0051780PMID:23349675
4. Soria JC, Mauguen A, Reck M, Sandler AB, Saijo N, et al. (2013) Systematic review and meta-analysis of randomised, phase II/III trials adding bevacizumab to platinum-based chemotherapy as first-line treatment in patients with advanced non-small-cell lung cancer. Ann Oncol 24(1): 20–30. doi:10.1093/
annonc/mds590PMID:23180113
5. Vokes EE, Salgia R, Karrison TG (2013) Evidence-based role of bevacizumab in non-small cell lung cancer. Ann Oncol 24(1): 6–9. doi:10.1093/annonc/mds608PMID:23251009
6. von Minckwitz G, Eidtmann H, Rezai M, Fasching PA, Tesch Hea (2012) Neoadjuvant chemotherapy and bevacizumab for HER2-negative breast cancer. N Engl J Med 366(4): 299–309. doi:10.1056/
NEJMoa1111065PMID:22276820
7. Bear HD, Tang G, Rastogi P, Geyer CEJ, Robidoux A (2012) Bevacizumab added to neoadjuvant che- motherapy for breast cancer. N Engl J Med 366(4): 310–320. doi:10.1056/NEJMoa1111097PMID:
22276821
8. Montero AJ, Vogel C (2012) Fighting fire with fire: rekindling the bevacizumab debate. N Engl J Med 366(4): 374–375. doi:10.1056/NEJMe1113368PMID:22276827
9. Tebbutt NC, Wilson K, Gebski VJ, Cummins MM, Zannino D, et al. (2010) Capecitabine, bevacizumab, and mitomycin in first-line treatment of metastatic colorectal cancer: results of the Australasian gastroin- testinal trials group randomized Phase III MAX study. J Clin Oncol 28(19): 3191–3198. doi:10.1200/
JCO.2009.27.7723PMID:20516443
10. Rini BI, Halabi S, Rosenberg JE, Stadler WM, Vaena DA, et al. (2010) Phase III trial of bevacizumab plus interferon alfa versus interferon alfa monotherapy in patients with metastatic renal cell carcinoma:
final results of CALGB 90206. J Clin Oncol 28(13): 2137–2143. doi:10.1200/JCO.2009.26.5561PMID:
20368558
11. Ohtsu A, Shah MA, Van Cutsem E, Rha SY, Sawaki A, et al. (2011) Bevacizumab in combination with chemotherapy as first-line therapy in advanced gastric cancer: a randomized, double-blind, placebo- controlled phase III study. J Clin Oncol 29(30): 3968–3976. doi:10.1200/JCO.2011.36.2236PMID:
21844504
12. Kindler HL, Niedzwiecki D, Hollis D, Sutherland S, Schrag D, et al. (2010) Gemcitabine plus bevacizu- mab compared with gemcitabine plus placebo in patients with advanced pancreatic cancer: phase III trial of the cancer and leukemia group B (CALGB 80303). J Clin Oncol 28(22): 3617–3622. doi:10.
1200/JCO.2010.28.1386PMID:20606091
13. Kelly WK, Halabi S, Carducci M, George D, Mahoney JF, et al. (2012) Randomized, double-blind, pla- cebo-controlled phase III trial comparing docetaxel and prednisone with or without bevacizumab in men with metastatic castration-resistant prostate cancer: CALGB 90401. J Clin Oncol 30(13): 1534–1540.
doi:10.1200/JCO.2011.39.4767PMID:22454414
14. Kim KB, Sosman JA, Fruehauf JP, Linette GP, Markovic SN, et al. (2012) BEAM: a randomized phase II study evaluating the activity of bevacizumab in combination with carboplatin plus paclitaxel in patients with previously untreated advanced melanoma. J Clin Oncol 30(1): 34–41. doi:10.1200/JCO.2011.34.
6270PMID:22124101
15. Mukherji SK (2010) Bevacizumab (Avastin). AJNR Am J Neuroradiol 31(2): 235–236. doi:10.3174/
ajnr.A1987PMID:20037132
16. Kovács L, Szeles A, Sápi J, Drexler DA, Rudas I, et al. (2014) Model-based angiogenic inhibition of tumor growth using modern robust control method. Comput Methods Programs Biomed 114(3): e98– 110. doi:10.1016/j.cmpb.2014.01.002PMID:24472366
17. Szeles A, Drexler DA, Sápi J, Harmati I, Kovács L (2014) Model-based angiogenic inhibition of tumor growth using adaptive fuzzy techniques. Periodica Polytechnica Electrical Engineering and Computer Science 58:(1): 29–36. doi:10.3311/PPee.7030
18. Drexler DA, Sápi J, Szeles A, Harmati I, Kovács L (2012) Comparison of path tracking flat control and working point linearization based set point control of tumor growth with angiogenic inhibition. Scientific Bulletin of the“Politehnica”University of Timisoara, Transactions on Automatic Control and Computer Science 57 (71):(2: ): 113–120.
19. Sápi J, Drexler DA, Harmati I, Sápi Z, Kovács L (2015) Qualitative analysis of tumor growth model under antiangiogenic therapy—choosing the effective operating point and design parameters for con- troller design. Optimal Control Applications and Methods First published online: 9 September 2015: doi:
10.1002/oca.2196
20. Protocol Online (2005). Xenograft tumor model protocol. Available:http://www.protocol-online.org/prot/
Protocols/Xenograft-Tumor-Model-Protocol-3810.html. Accessed 1 December 2014.
21. Tomayko MM, Reynolds CP (1989) Determination of subcutaneous tumor size in athymic (nude) mice.
Cancer Chemother Pharmacol 24(3): 148–154. doi:10.1007/BF00300234PMID:2544306
22. Jensen MM, Jørgensen JT, Binderup T, Kjaer A (2008) Tumor volume in subcutaneous mouse xeno- grafts measured by microCT is more accurate and reproducible than determined by 18F-FDG-micro- PET or external caliper. BMC Med Imaging: 8–16.
23. Sápi J, Drexler DA, Sápi Z, Kovács L (2014) Identification of C38 colon adenocarcinoma growth under bevacizumab therapy and without therapy. In: CINTI 2014—15th IEEE International Symposium on Computational Intelligence and Informatics. pp. 443–448. Budapest, Hungary.
24. Heitjan DF, Manni A, Santen RJ (1993) Statistical analysis of in vivo tumor growth experiments. Cancer Res 53(24): 6042–6050. PMID:8261420
25. Feldman JP, Goldwasser R, Mark S, Schwartz J, Orion I (2009) A mathematical model for tumor vol- ume evaluation using two-dimensions. J Appl Quant Methods 4: 455–462.
26. Sápi J, Drexler DA, Harmati I, Szeles A, Kiss B, et al. (2013) Tumor growth model identification and analysis in case of C38 colon adenocarcinoma and B16 melanoma. In: SACI 2013—8th IEEE Interna- tional Symposium on Applied Computational Intelligence and Informatics. pp. 303–308. Timisoara, Romania.
27. Heiduschka P, Julien S, Hofmeister S, Bartz-Schmidt KU, Schraermeyer U (2008) Bevacizumab (avas- tin) does not harm retinal function after intravitreal injection as shown by electroretinography in adult mice. Retina 28(1): 46–55. doi:10.1097/IAE.0b013e31815e9368PMID:18185137
28. Hollanders K, Van Bergen T, Van de Velde S, Sijnave D, Vandewalle E, et al. (2014) Bevacizumab revisited: Its use in different mouse models of ocular pathologies. Curr Eye Res 12: 1–11.
29. Koo V, Hamilton PW, Williamson K (2006) Non-invasive in vivo imaging in small animal research. Cell Oncol 28(4): 127–139. PMID:16988468
30. Targeson (2012). Mouse tail vein injection protocol. Available:http://www.targeson.com/sites/default/
files/content/pages/pdfs/tail_vein_protocol_2012_0.pdf. Accessed 1 December 2014.
31. Pachghare VK (2005) Comprehensive Computer Graphics: Including C++. Laxmi Publications, 22– 23 pp.
32. Kiss B, Sápi J, Kovács L (2013) Imaging method for model-based control of tumor diseases. In: SISY 2013—11th IEEE International Symposium on Intelligent Systems and Informatics. pp. 271–275. Subo- tica, Serbia.
33. ImageJ. Image processing and analysis in Java. Available:http://rsbweb.nih.gov/ij/index.html.
Accessed 1 December 2014.
34. Monk BJ, Sill MW, Burger RA, Gray HJ, Buekers TE, et al. (2009) Phase II trial of bevacizumab in the treatment of persistent or recurrent squamous cell carcinoma of the cervix: a gynecologic oncology group study. J Clin Oncol 27(7): 1069–1074. doi:10.1200/JCO.2008.18.9043PMID:19139430 35. Kumaran GC, Jayson GC, Clamp AR (2009) Antiangiogenic drugs in ovarian cancer. Br J Cancer 100
(1): 1–7. doi:10.1038/sj.bjc.6604767PMID:19002176
36. Friedman HS, Prados MD, Wen PY, Mikkelsen T, Schiff D, et al. (2009) Bevacizumab alone and in combination with irinotecan in recurrent glioblastoma. J Clin Oncol 27(28): 4733–4740. doi:10.1200/
JCO.2008.19.8721PMID:19720927
37. Schmoll HJ, Van Cutsem E, Stein A, Valentini V, Glimelius B, et al. (2012) ESMO consensus guidelines for management of patients with colon and rectal cancer: A personalized approach to clinical decision making. Ann Oncol 23(10): 2479–2516. doi:10.1093/annonc/mds236PMID:23012255
38. McCarroll J, Teo J, Boyer C, Goldstein D, Kavallaris M, et al. (2014) Potential applications of nanotech- nology for the diagnosis and treatment of pancreatic cancer. Front Physiol 5: 2(1–10). doi:10.3389/
fphys.2014.00002PMID:24478715
39. Reinacher-Schick A, Pohl M, Schmiegel W (2008) Drug insight: antiangiogenic therapies for gastroin- testinal cancers–focus on monoclonal antibodies. Nat Clin Pract Gastroenterol Hepatol 5(5): 250–267.
doi:10.1038/ncpgasthep1097PMID:18382435
40. Jain R (2005) Normalization of tumor vasculature: an emerging concept in antiangiogenic therapy. Sci- ence 307(5706): 58–62. doi:10.1126/science.1104819PMID:15637262
41. Jain R, Tong R, Munn L (2007) Effect of vascular normalization by antiangiogenic therapy on interstitial hypertension, peritumor edema, and lymphatic metastasis: insights from a mathematical model. Can- cer Res 67(6): 2729–2735. doi:10.1158/0008-5472.CAN-06-4102PMID:17363594
42. Batchelor T, Sorensen A, di Tomaso E, Zhang W, Duda D, et al. (2007) AZD2171, a pan-VEGF recep- tor tyrosine kinase inhibitor, normalizes tumor vasculature and alleviates edema in glioblastoma patients. Cancer Cell 11(1): 83–95. doi:10.1016/j.ccr.2006.11.021PMID:17222792
43. Tong R, Boucher Y, Kozin S, Winkler F, Hicklin D, et al. (2004) Vascular normalization by vascular endothelial growth factor receptor 2 blockade induces a pressure gradient across the vasculature and improves drug penetration in tumors. Cancer Res 64(11): 3731–3736. doi:10.1158/0008-5472.CAN- 04-0074PMID:15172975
44. Goel S, Wong A, Jain R (2012) Vascular normalization as a therapeutic strategy for malignant and non- malignant disease. Cold Spring Harb Perspect Med 2(3): a006486. doi:10.1101/cshperspect.a006486 PMID:22393532
45. Zhang Q, Kang X, Zhao W (2006) Antiangiogenic effect of low-dose cyclophosphamide combined with ginsenoside Rg3 on Lewis lung carcinoma. Biochem Biophys Res Commun 342(3): 824–828. doi:10.
1016/j.bbrc.2006.02.044PMID:16499874
46. Carey K (2012) Avastin loses breast cancer indication. Nature Biotechnology 30: 6. doi:10.1038/
nbt0112-6a
47. Cobelli C, Eric Renard E, Kovatchev B (2014) The artificial pancreas: a digital-age treatment for diabe- tes. Lancet Diabetes Endocrinol 2(9): 679–681. doi:10.1016/S2213-8587(14)70126-3PMID:
24943066
48. Kovács L, Benyó B, Bokor J, Benyó Z (2011) Induced L2-norm minimization of glucose-insulin system for type I diabetic patients. Comput Methods Programs Biomed 102(2): 105–118. doi:10.1016/j.cmpb.
2010.06.019PMID:20674065