International Journal of
Molecular Sciences
Article
Investigation of the Antihypertrophic and Antifibrotic Effects of Losartan in a Rat Model of Radiation-Induced Heart Disease
Mónika Gabriella Kovács1 , Zsuzsanna Z. A. Kovács1, Zoltán Varga2, Gerg ˝o Sz ˝ucs1 , Marah Freiwan1 , Katalin Farkas3, Bence K ˝ovári4, Gábor Cserni4, András Kriston5,6,7, Ferenc Kovács5,6,7, Péter Horváth5,6,7, Imre Földesi3, Tamás Csont1,*, Zsuzsanna Kahán2,†and Márta Sárközy1,*,†
Citation: Kovács, M.G.; Kovács, Z.Z.A.; Varga, Z.; Sz ˝ucs, G.; Freiwan, M.; Farkas, K.; K˝ovári, B.; Cserni, G.;
Kriston, A.; Kovács, F.; et al.
Investigation of the Antihypertrophic and Antifibrotic Effects of Losartan in a Rat Model of Radiation-Induced Heart Disease.Int. J. Mol. Sci.2021, 22, 12963. https://doi.org/10.3390/
ijms222312963
Academic Editors: Francesco Fedele and Paul J. Mather
Received: 31 October 2021 Accepted: 26 November 2021 Published: 30 November 2021
Publisher’s Note:MDPI stays neutral with regard to jurisdictional claims in published maps and institutional affil- iations.
Copyright: © 2021 by the authors.
Licensee MDPI, Basel, Switzerland.
This article is an open access article distributed under the terms and conditions of the Creative Commons Attribution (CC BY) license (https://
creativecommons.org/licenses/by/
4.0/).
1 Interdisciplinary Center of Excellence and MEDICS Research Group, Department of Biochemistry, Albert Szent-Györgyi Medical School, University of Szeged, H-6720 Szeged, Hungary;
kovacs.monika.gabriella@med.u-szeged.hu (M.G.K.); kovacs.zsuzsanna@med.u-szeged.hu (Z.Z.A.K.);
szucs.gergo@med.u-szeged.hu (G.S.); marah.mf.94@gmail.com (M.F.)
2 Department of Oncotherapy, Albert Szent-Györgyi Medical School, University of Szeged,
H-6720 Szeged, Hungary; varga.zoltan@med.u-szeged.hu (Z.V.); kahan.zsuzsanna@med.u-szeged.hu (Z.K.)
3 Department of Laboratory Medicine, Albert Szent-Györgyi Medical School, University of Szeged, H-6720 Szeged, Hungary; farkas.katalin@med.u-szeged.hu (K.F.); foldesi.imre@med.u-szeged.hu (I.F.)
4 Department of Pathology, Albert Szent-Györgyi Medical School, University of Szeged,
H-6720 Szeged, Hungary; kovari.bence@med.u-szeged.hu (B.K.); cserni.gabor@med.u-szeged.hu (G.C.)
5 Synthetic and Systems Biology Unit, Biological Research Centre, Eötvös Loránd Research Network, H-6726 Szeged, Hungary; kriston.andras@single-cell-technologies.com (A.K.);
kovacs.ferenc@single-cell-technologies.com (F.K.); peter.horvath@brc.hu (P.H.)
6 Single-Cell Technologies Ltd., H-6726 Szeged, Hungary
7 Institute for Molecular Medicine Finland (FIMM), University of Helsinki, FIN-00014 Helsinki, Finland
* Correspondence: csont.tamas@med.u-szeged.hu (T.C.); sarkozy.marta@med.u-szeged.hu (M.S.)
† These authors contributed to the work equally.
Abstract: Radiation-induced heart disease (RIHD) is a potential late side-effect of thoracic radio- therapy resulting in left ventricular hypertrophy (LVH) and fibrosis due to a complex pathome- chanism leading to heart failure. Angiotensin-II receptor blockers (ARBs), including losartan, are frequently used to control heart failure of various etiologies. Preclinical evidence is lacking on the anti-remodeling effects of ARBs in RIHD, while the results of clinical studies are controversial. We aimed at investigating the effects of losartan in a rat model of RIHD. Male Sprague-Dawley rats were studied in three groups: (1) control, (2) radiotherapy (RT) only, (3) RT treated with losartan (per os 10 mg/kg/day), and were followed for 1, 3, or 15 weeks. At 15 weeks post-irradiation, losartan alleviated the echocardiographic and histological signs of LVH and fibrosis and reduced the overexpression of chymase, connective tissue growth factor, and transforming growth factor-beta in the myocardium measured by qPCR; likewise, the level of the SMAD2/3 protein determined by Western blot decreased. In both RT groups, the pro-survival phospho-AKT/AKT and the phospho- ERK1,2/ERK1,2 ratios were increased at week 15. The antiremodeling effects of losartan seem to be associated with the repression of chymase and several elements of the TGF-β/SMAD signaling pathway in our RIHD model.
Keywords:onco-cardiology; radiation-induced heart disease; diastolic dysfunction; left ventricular hypertrophy; fibrosis; heart failure; angiotensin-II receptor blocker (ARB); losartan; chymase;
TGF-β/SMAD signaling pathway
1. Introduction
Cardiovascular diseases and cancer are the leading causes of morbidity and mortality worldwide [1,2]. The most common cancerous diseases are breast and lung cancers in women and men, respectively [2]. Cancer therapy has undergone significant improve- ment, which led to increased long-term survival rates among cancer patients [3]. About
Int. J. Mol. Sci.2021,22, 12963. https://doi.org/10.3390/ijms222312963 https://www.mdpi.com/journal/ijms
Int. J. Mol. Sci.2021,22, 12963 2 of 24
50% of cancer patients receive radiotherapy (RT), which also has an important role in the treatment of malignancies superposed on the chest wall, such as breast cancer and thoracic malignancies including lung, and esophageal cancers, Hodgkin’s lymphoma, and thymoma [3,4]. While high-energy ionizing radiation (i.e., RT) successfully kills tumor cells, it could have harmful effects on the surrounding healthy tissues [5]. Depending on the RT technique and dose used in thoracic and breast malignancies, the heart can be at risk of being exposed to ionizing radiation resulting in radiogenic sequelae in a dose-dependent manner [6,7]. The syndrome of unwanted cardiovascular side effects of thoracic RT is termed radiation-induced heart disease (RIHD), which is a critical concern in current oncology and cardiology practice [8–10].
RIHD is a progressive multifactorial disease that covers a broad spectrum of cardiac pathology [8–10]. Its clinical manifestation includes acute and chronic pericarditis, con- duction system abnormalities, ischemic heart disease, cardiomyopathy, heart failure with preserved ejection fraction (HFpEF) or reduced ejection fraction (HFrEF), and valvular heart disease [8–10]. RT simultaneously causes damage to the cardiac macrovasculature (i.e., coronary arteries) and microvasculature, as well as the myocardium (i.e., diffuse injury), leading to the complex pathomechanism of RIHD [11,12]. However, the precise molecular mechanisms in the progression of RIHD from acute to chronic heart diseases are not clearly understood yet. Evidence suggests that RT-induced direct nitro-oxidative damage of macromolecules, including DNA, proteins, and lipids, initiates the development of RIHD. At this acute phase of RIHD, the elevated nitro-oxidative stress causes injury to the endothelial and other cells, eventually leading to various forms of cell death and acute inflammation [8,12,13]. In the early chronic phase of RIHD, the sublethally damaged surviving cardiomyocytes develop hypertrophy accompanied by endothelial cell prolif- eration as a compensatory mechanism [8,12,13]. If these compensatory mechanisms are exhausted, chronic inflammatory processes, fibrosis, and endothelial senescence play the primary role in the progression of RIHD [8,12,13]. Several pathomechanisms, including nitro-oxidative stress, cell death, and inflammatory processes, overlap in the acute and chronic phases of RIHD [8]. The injury of the capillaries or coronary arteries disturbs circulation and leads to hypoxia which aggravates tissue damage [8]. These mechanisms seem to activate and potentiate each other leading to a vicious cycle in the progression of RIHD [8]. Unfortunately, therapeutic options for RIHD are currently insufficient. Therefore, understanding the exact molecular mechanisms in the progression of RIHD is essential for developing preventive and therapeutic strategies together with testing drugs that do not interfere with the anti-cancer effects of RT.
Chronic activation of the renin-angiotensin-aldosterone system (RAAS) plays a pivotal role in cardiovascular pathophysiology, including hypertension, cardiac hypertrophy, and heart failure via different systemic and tissue-specific mechanisms such as elevated nitro-oxidative and endoplasmic reticulum stress, inflammation, apoptosis, and fibrosis via transforming growth factor-β(TGF-β) signaling, and the transactivation of various intracellular protein kinases such as ERKs and AKT [14,15]. There is some preclinical evidence that irradiation could upregulate angiotensin-II (AngII) expression in the rat heart [16] and lungs [17] in a dose-dependent manner [18]. Interestingly, preclinical studies evaluating the cardiac effects of the widely used selective AngII type 1 (AT1) receptor blockers in RIHD are lacking in the literature. Only two clinical studies investigated the effects of ARBs in cancer patients treated with thoracic RT, and their results were controversial [19,20]. In the present study, we aimed at investigating the effects of the ARB losartan (widely used in standard heart failure therapy) in a rat model of RIHD.
2. Results
2.1. Systemic Effects of the Radiotherapy in Our RIHD Model
An overview of the experimental setup is shown in Figure1. Altogether two animals died in the RT only group (in the 3-week and 15-week subgroups).
Int. J. Mol. Sci.2021,22, 12963 3 of 24
Int. J. Mol. Sci. 2021, 22, x FOR PEER REVIEW 3 of 24
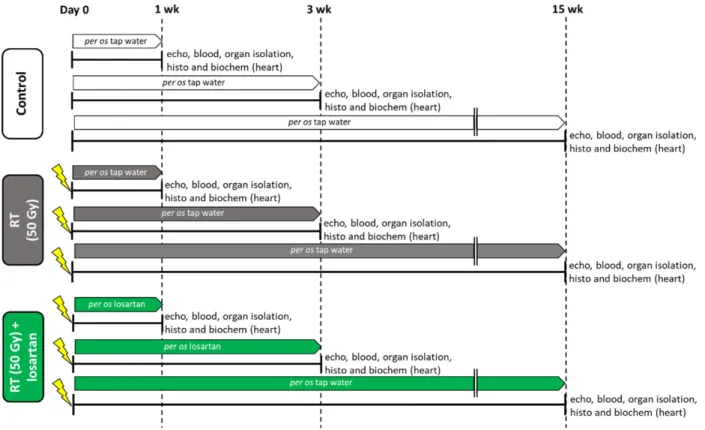
Figure 1. Experimental setup. Rats (n = 63) were divided into three groups (n = 6–9) and treated via oral gavage daily for
1, 3, or 15 weeks, respectively, as follows: (i) control group treated with tap water, (ii) radiotherapy (RT) only group treated with tap water, and (iii) RT plus losartan group treated with losartan (per os 10 mg/kg/day) dissolved in tap water. Cardiac morphology and function were assessed by transthoracic echocardiography (echo) at the end-points of each experiment under anesthesia. Then, blood was collected from the abdominal aorta to measure routine laboratory parameters, and hearts, lungs, and tibias were isolated. Left and right ventricles were separated, and left ventricular samples were prepared for histology (histo) and biochemical measurements (biochem). The development of LVH and fibrosis in the irradiated groups were investigated by the measurement of cardiomyocyte cross-sectional areas on hematoxylin-eosin-stained slides and picrosirius red/fast green-stained slides. The expression of selected genes related to LVH and fibrosis, heart failure, renin-angiotensin-aldosterone system (RAAS), and inflammation were measured at the transcript level by qRT-PCR. Left ventricular levels of selected proteins related to the RAAS, cardiac hypertrophy, and fibrosis pathways were measured by Western blot.
At weeks 1, 3, and 15, hearts, lungs, and tibias were isolated, then left and right ven- tricles were separated, and the organ weights and tibia lengths were measured (Figure 1 and Table 1). Before the treatments, there were no significant differences in the body weights between the groups in each experiment (Table 1). At week 1, there were no sig- nificant differences in the tibia length, heart weight, lung weight, and right ventricular weight between the groups. In contrast, body weight was significantly lower in the RT plus losartan group as compared to the control group (Table 1). Moreover, left ventricular weight was significantly reduced in both RT groups irrespective of the addition of losar- tan treatment as compared to the control group at week 1 (Table 1). At week 3, there was no significant difference in tibia length, heart weight, or right ventricular weight between the groups (Table 1). However, body weight and left ventricular weight were significantly smaller in the RT groups irrespective of losartan treatment compared to the control group at week 3, probably due to the detrimental effects of ionizing radiation in the RT groups (Table 1). Moreover, lung weights were significantly higher both in the RT only and losar- tan-treated RT groups compared to the control group, suggesting the presence of pulmo- nary edema at week 3 (Table 1) (Fluid was found in the lungs during the autopsy, data not shown). At week 15, body weight, tibia length, heart weight, and left ventricular weight were significantly smaller in both RT groups, irrespective of losartan treatment, indicating that the irradiated animals had severe developmental retardation in the late chronic phase of RIHD (Table 1). In contrast, right ventricular and lung weights were not significantly different between the groups (Table 1).
Figure 1.Experimental setup. Rats (n= 63) were divided into three groups (n= 6–9) and treated via oral gavage daily for 1, 3, or 15 weeks, respectively, as follows: (i) control group treated with tap water, (ii) radiotherapy (RT) only group treated with tap water, and (iii) RT plus losartan group treated with losartan (per os 10 mg/kg/day) dissolved in tap water. Cardiac morphology and function were assessed by transthoracic echocardiography (echo) at the end-points of each experiment under anesthesia. Then, blood was collected from the abdominal aorta to measure routine laboratory parameters, and hearts, lungs, and tibias were isolated. Left and right ventricles were separated, and left ventricular samples were prepared for histology (histo) and biochemical measurements (biochem). The development of LVH and fibrosis in the irradiated groups were investigated by the measurement of cardiomyocyte cross-sectional areas on hematoxylin-eosin-stained slides and picrosirius red/fast green-stained slides. The expression of selected genes related to LVH and fibrosis, heart failure, renin-angiotensin-aldosterone system (RAAS), and inflammation were measured at the transcript level by qRT-PCR. Left ventricular levels of selected proteins related to the RAAS, cardiac hypertrophy, and fibrosis pathways were measured by Western blot.
At weeks 1, 3, and 15, hearts, lungs, and tibias were isolated, then left and right ventricles were separated, and the organ weights and tibia lengths were measured (Figure1 and Table1). Before the treatments, there were no significant differences in the body weights between the groups in each experiment (Table1). At week 1, there were no significant differences in the tibia length, heart weight, lung weight, and right ventricular weight between the groups. In contrast, body weight was significantly lower in the RT plus losartan group as compared to the control group (Table1). Moreover, left ventricular weight was significantly reduced in both RT groups irrespective of the addition of losartan treatment as compared to the control group at week 1 (Table1). At week 3, there was no significant difference in tibia length, heart weight, or right ventricular weight between the groups (Table1). However, body weight and left ventricular weight were significantly smaller in the RT groups irrespective of losartan treatment compared to the control group at week 3, probably due to the detrimental effects of ionizing radiation in the RT groups (Table 1). Moreover, lung weights were significantly higher both in the RT only and losartan-treated RT groups compared to the control group, suggesting the presence of pulmonary edema at week 3 (Table1) (Fluid was found in the lungs during the autopsy, data not shown). At week 15, body weight, tibia length, heart weight, and left ventricular weight were significantly smaller in both RT groups, irrespective of losartan treatment,
Int. J. Mol. Sci.2021,22, 12963 4 of 24
indicating that the irradiated animals had severe developmental retardation in the late chronic phase of RIHD (Table1). In contrast, right ventricular and lung weights were not significantly different between the groups (Table1).
Blood counts, hemoglobin concentrations, and hematocrit levels were determined at weeks 1, 3, and 15 to investigate the effects of losartan on the severity of systemic inflammation and the compensatory increase in hemoglobin synthesis associated with radiation-induced lung and heart damage (Figure1). One week post-RT, white blood cell counts were not significantly higher (7% increase,p= 0.646) in the RT only group and significantly increased in the RT plus losartan group as compared to that in the control group (Table2). At week 3, white blood cell counts were significantly increased in the irradiated groups irrespective of losartan treatment, suggesting the presence of systemic inflammation at that time point (Table2). No such differences were detected between the groups at week 15 (Table 2). RT might lead to the activation of platelets which are considered important sources of pro-thrombotic agents during the inflammatory process [21]. Platelet counts were not significantly different between the groups at weeks 1 and 15. However, platelet counts showed a non-significant increase (16%,p= 0.073) in the RT only group and a significant increase in the losartan-treated RT group as compared to that in the control group at week 3 (Table2).
At week 1, red blood cell counts were significantly elevated in both RT groups com- pared to the control group (Table2). Hemoglobin level showed a trend to an increase (10%,p= 0.057) in the RT only group and a significant increase in the RT plus losartan group compared to the control group (Table2). There was no significant difference in the hematocrit levels between the groups (Table2). At week 3, there were no significant differ- ences in the red blood cell counts, hemoglobin, or hematocrit levels between the groups (Table2). In contrast, at week 15, red blood cell counts showed a trend to an increase (10%, p= 0.076) in the RT only group, and a significant increase in the RT plus losartan group, while hemoglobin concentrations and hematocrit levels were significantly increased in the RT groups irrespective of losartan treatment compared to the control group (Table2).
2.2. Post-RT Diastolic Dysfunction Was Alleviated by Losartan at Weeks 1 and 3 but Not at Week 15
Transthoracic echocardiography was performed at weeks 1, 3, and 15 to monitor the effects of RT and losartan on cardiac morphology and function (Figure1). At week 1, the diastolic parameter mitral valve early flow velocity (E) was not significantly different between the groups (Table3). A sensitive parameter of the diastolic function, the septal mitral annulus velocity (e’), was significantly decreased in the RT only group as compared to the control group, indicating an early-phase diastolic dysfunction (DD) at week 1 (Table3, Figure2a). Septal e’ was not significantly different between the control and the losartan- treated RT groups (Table3, Figure2a). Another indicator of DD, the E/e’ ratio, was not significantly different between the RT only group and the control group. However, the E/e’
ratio was significantly reduced in the RT plus losartan group as compared to the RT only or control groups at week 1 (Figure2b).
At week 3, E velocity was not significantly different between the RT only and the control group (Table3). In contrast, E velocity was significantly lower in the losartan- treated RT group than in RT only group at week 3 (Table3). At week 15, E velocity was significantly lower in both RT groups irrespective of losartan treatment compared to the control group (Table 3). At weeks 3 and 15, the significantly decreased septal e’ and significantly increased E/septal e’ ratio indicated the presence of DD in the RT only groups compared to the time-matched control groups, respectively (Table2, Figure2a,b). Losartan significantly ameliorated these parameters compared to the RT group at week 3 (Table2, Figure2a,b). Nonetheless, at week 15, there was a trend to an increase (13.5%,p= 0.061) in the septal e’ and a trend to decrease (17%,p= 0.16) in the E/septal e’ parameter in the RT plus losartan group compared to the RT only group (Table2, Figure2a,b).
Int. J. Mol. Sci.2021,22, 12963 5 of 24
Table 1.Post-RT body weights, organ weights, and tibia lengths at weeks 1, 3, and 15.
Parameter (Unit) Week 1 Week 3 Week 15
Control RT RT Los Control RT RT Los Control RT RT Los
Body weight at the beginning (g) 233±8 233±5 232±4 * 282±5 281±7 282±6 261±3 263±4 261±5
Body weight at the endpoint (g) 269±7 258±6 251±5 * 382±9.57 338±5.22 * 344±8.8 * 525±14 377±29 * 414±17 *
Tibia length (cm) 3.39±0.06 3.36±0.03 3.33±0.04 3.83±0.07 3.73±0.05 3.86±0.09 4.5±0.04 4.25±0.08 * 4.28±0.04 *
Heart weight (g) 0.91±0.02 0.87±0.03 0.87±0.02 1.16±0.03 1.1±0.04 1.06±0.05 2.24±0.11 1.75±0.04 * 1.63±0.11 *
Left ventricle weight (g) 0.62±0.01 0.57±0.02 * 0.55±0.02 * 0.77±0.02 0.69±0.02 * 0.66±0.02 * 1.3±0.05 0.99±0.03 * 0.88±0.06 *
Right ventricle weight (g) 0.17±0.01 0.17±0.01 0.18±0.01 0.24±0.01 0.25±0.01 0.23±0.02 0.35±0.01 0.33±0.01 0.32±0.02
Lung weight (g) 1.3±0.02 1.29±0.05 1.3±0.03 1.7±0.12 2.98±0.26 * 2.47±0.29 * 1.64±0.04 1.88±0.32 1.50±0.1
Values are presented as mean±S.E.M., *p< 0.05 vs. control group, (n= 6–7, One-Way ANOVA, Holm-Sidak post hoc test). RT: radiotherapy only group (50 Gy), RT Los: RT plus losartan group.
Table 2.Post-RT blood cell counts, hemoglobin, and hematocrit values.
Parameter (Unit) Week 1 Week 3 Week 15
Control RT RT Los Control RT RT Los Control RT RT Los
White blood cell counts (109/L) 5.79±0.43 6.18±0.7 7.15±0.36 * 4.44±0.56 6.77±0.8 * 7.16±0.7 * 6.09±0.58 6±0.39 6.51±0.52
Platelet counts (109/L) 569±8 587±20 643±33 559±27 646±35 673±31 * 636±17 586±67 736±53
Red blood cell counts (1012/L) 6.69±0.11 7.37±0.29 * 7.74±0.2 * 7.54±0.15 7.54±0.18 7.95±0.18 8.30±0.15 9.16±0.44 9.50±0.3 *
Hemoglobin (g/L) 130±3 143±5 146±3 * 143±3 142±3 152±3 146±2 165±8 * 175±7 *
Hematocrit (L/L) 0.41±0.01 0.44±0.02 0.45±0.01 0.44±0.01 0.45±0.01 0.47±0.01 0.43±0.01 0.49±0.02 * 0.50±0.02 *
Values are presented as mean±S.E.M., *p< 0.05 vs. control group, (n= 6–7, One-Way ANOVA, Holm-Sidak post hoc test). RT: radiotherapy only group (50 Gy), RT Los: RT plus losartan group.
Table 3.Echocardiographic parameters according to treatment groups at weeks 1, 3, and 15.
Parameter (Unit) Week 1 Week 3 Week 15
Control RT RT Los Control RT RT Los Control RT RT Los
E velocity (m/s) 1.00±0.04 0.94±0.05 0.90±0.04 1.00±0.04 1.05±0.03 0.93±0.04 # 1.01±0.02 0.81±0.10 * 0.75±0.05 *
e’ (m/s) 0.060±0.002 0.053±0.001 * 0.063±0.005 0.066±0.006 0.038±0.002 * 0.056±0.005 # 0.077±0.007 0.035±0.002 * 0.042±0.002 *
SWTs (mm) 2.70±0.10 2.84±0.16 2.91±0.10 3.14±0.15 3.47±0.12 3.18±0.14 3.58±0.12 4.64±0.17 * 4.29±0.32
SWTd (mm) 1.61±0.10 1.60±0.09 1.90±0.06 1.79±0.12 1.73±0.06 1.77±0.14 1.83±0.04 3.23±0.33* 3.12±0.28
AWTs (mm) 2.64±0.17 2.61±0.09 2.92±0.20 2.85±0.17 3.19±0.18 2.89±0.27 3.3±0.23 4.56±0.28 * 4.51±0.17 *
AWTd (mm) 1.63±0.17 1.51±0.07 1.75±0.09 1.61±0.07 1.67±0.11 1.67±0.09 1.99±0.13 3.14±0.31 * 3.04±0.17 *
IWTs (mm) 2.24±0.13 2.47±0.08 2.70±0.10 * 2.67±0.07 3.32±0.17 * 2.91±0.23 3.44±0.25 4.56±0.09 * 3.69±0.31
IWTd (mm) 1.48±0.03 1.51±0.09 1.67±0.09 1.73±0.07 1.98±0.07 * 1.90±0.15 2.01±0.12 3.67±0.12 * 2.72±0.26 *#
LVEDD (mm) 7.73±0.22 7.34±0.27 6.98±0.16 * 8.33±0.2 7.4±0.14 * 7.11±0.29 * 8.44±0.33 4.85±0.17 * 5.67±0.29 *#
LVESD (mm) 4.75±0.21 4.05±0.28 3.68±0.21 * 4.83±0.17 3.40±0.20 * 3.25±0.25 * 4.26±0.55 0.98±0.15 * 1.63±0.16 *
FS (%) 39±2 45±2 * 48±2 * 42±2 54±2 * 54±2 * 50±5 80±3 * 71±3 *
EF (%) 56±2 57±3 52±1 53±2 53±3 53±1 53±2 57±2 55±1
Values are presented as mean±S.E.M., *p< 0.05 vs. control group, #p< 0.05 vs. RT group (n= 6–7, One-Way ANOVA, Holm-Sidak post hoc test). RT: radiotherapy only group (50 Gy), RT Los: RT plus losartan group. AWT: anterior wall thickness, d: diastolic, E: early flow velocity, e’: velocity of the septal mitral annulus, EF: ejection fraction, FS: fractional shortening, IWT: inferior wall thickness, LVEDD: left ventricular end-diastolic diameter, LVESD: left ventricular end-diastolic diameter, s: systolic, SWT: septal wall thickness.
Int. J. Mol. Sci.2021,22, 12963 6 of 24
Int. J. Mol. Sci. 2021, 22, x FOR PEER REVIEW 6 of 24
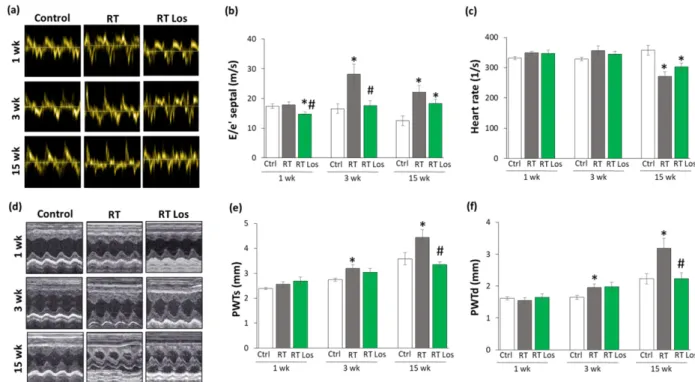
Figure 2. The effects of losartan on the echocardiographic parameters at weeks 1, 3, and 15. (a) Rep-
resentative tissue Doppler images of diastolic septal mitral annulus velocity e’, (b) mitral valve early flow velocity (E)/ e’, (c) heart rate, (d) representative M-mode images of wall thicknesses and left ventricular diameters, (e) posterior wall thicknesses in systole (PWTs) and (f) diastole (PWTd). Val- ues are presented as mean ± S.E.M., * p < 0.05 vs. control group, # p < 0.05 vs. RT only group (n = 6–
7, One-Way ANOVA, Holm-Sidak post hoc test). Ctrl: control group, RT: radiotherapy only group (50 Gy), RT Los: RT plus losartan group. Representative M-mode images were saved from the Echo- Pac Dimension v201 software.
2.3. RT-Related Echocardiographic Signs of Left Ventricular Hypertrophy (LVH) Were Alleviated by Losartan at Week 15
At week 1, there was no significant difference in wall thicknesses and left ventricular diameters, and ejection fraction between the RT only and control groups (Table 3, Figure 2d–f). Nevertheless, in the RT only group, the systolic inferior and posterior wall thick- nesses increased in a statistically non-significant manner (10%, p = 0.14 and 7%, p = 0.17, respectively) while the left ventricular end-systolic diameter decreased in comparison with the control group (trend, 15%, p = 0.07), supposing the beginning of the development of LVH at week 1 (Table 3, Figure 2d–f). These echocardiographic signs of a mild LVH resulted in significantly increased fractional shortening in the RT only group measured by the Teichholz method in M-mode images at week 1 (Table 3). Interestingly, similar statistically significant changes occurred in the systolic inferior wall thickness and left ventricular end-systolic and end-diastolic diameters in the RT plus losartan group com- pared to the control group at week 1 (Table 3). The systolic posterior wall thickness showed a trend to increase (13%, p = 0.084) in the RT plus losartan group compared to the control group at week 1 (Figure 2e). Notably, there were no significant differences in the echocardiographic morphologic and functional parameters between the RT only and RT plus losartan groups at week 1.
At week 3, inferior and posterior wall thicknesses both in systole and diastole were significantly increased in the RT only group as compared to that in the control group, indicating the development of LVH (Table 3, Figure 2d–f). Accordingly, the left ventricu- lar end-systolic and end-diastolic diameters were significantly smaller, and the fractional shortening was significantly higher in the RT only group as compared to that in the con- trol group at week 3 (Table 3, Figure 2d). There were no significant differences in the sys- tolic and diastolic inferior and systolic posterior wall thicknesses between the control and RT plus losartan groups (Table 3, Figure 2d–f). However, the left ventricular end-diastolic and end-systolic diameters remained significantly smaller, and the fractional shortening was significantly higher in the RT plus losartan group compared to those in the control
Figure 2. The effects of losartan on the echocardiographic parameters at weeks 1, 3, and 15. (a) Representative tissue Doppler images of diastolic septal mitral annulus velocity e’, (b) mitral valve early flow velocity (E)/ e’, (c) heart rate, (d) representative M-mode images of wall thicknesses and left ventricular diameters, (e) posterior wall thicknesses in systole (PWTs) and (f) diastole (PWTd). Values are presented as mean±S.E.M., *p< 0.05 vs. control group, #p< 0.05 vs. RT only group (n= 6–7, One-Way ANOVA, Holm-Sidak post hoc test). Ctrl: control group, RT: radiotherapy only group (50 Gy), RT Los: RT plus losartan group. Representative M-mode images were saved from the Echo- Pac Dimension v201 software.
Irradiation and cardiac remodeling might lead to heart rate changes [8]. There were no significant differences in the heart rate between the groups at weeks 1 and 3 (Figure2c).
In contrast, the heart rate was significantly decreased in both RT groups irrespective of losartan treatment at week 15 (Figure2c).
2.3. RT-Related Echocardiographic Signs of Left Ventricular Hypertrophy (LVH) Were Alleviated by Losartan at Week 15
At week 1, there was no significant difference in wall thicknesses and left ventric- ular diameters, and ejection fraction between the RT only and control groups (Table3, Figure2d–f). Nevertheless, in the RT only group, the systolic inferior and posterior wall thicknesses increased in a statistically non-significant manner (10%, p = 0.14 and 7%, p= 0.17, respectively) while the left ventricular end-systolic diameter decreased in com- parison with the control group (trend, 15%, p= 0.07), supposing the beginning of the development of LVH at week 1 (Table3, Figure2d–f). These echocardiographic signs of a mild LVH resulted in significantly increased fractional shortening in the RT only group measured by the Teichholz method in M-mode images at week 1 (Table3). Interestingly, similar statistically significant changes occurred in the systolic inferior wall thickness and left ventricular end-systolic and end-diastolic diameters in the RT plus losartan group compared to the control group at week 1 (Table3). The systolic posterior wall thickness showed a trend to increase (13%,p= 0.084) in the RT plus losartan group compared to the control group at week 1 (Figure2e). Notably, there were no significant differences in the echocardiographic morphologic and functional parameters between the RT only and RT plus losartan groups at week 1.
At week 3, inferior and posterior wall thicknesses both in systole and diastole were significantly increased in the RT only group as compared to that in the control group,
Int. J. Mol. Sci.2021,22, 12963 7 of 24
indicating the development of LVH (Table3, Figure2d–f). Accordingly, the left ventricular end-systolic and end-diastolic diameters were significantly smaller, and the fractional shortening was significantly higher in the RT only group as compared to that in the control group at week 3 (Table3, Figure2d). There were no significant differences in the systolic and diastolic inferior and systolic posterior wall thicknesses between the control and RT plus losartan groups (Table3, Figure2d–f). However, the left ventricular end-diastolic and end-systolic diameters remained significantly smaller, and the fractional shortening was significantly higher in the RT plus losartan group compared to those in the control group at week 3 (Table3, Figure2c,d). There were no significant differences in the ejection fraction between the groups at week 3.
At week 15, severe concentric LVH developed in the RT only group with a significant increase in all wall thicknesses and fractional shortening and a marked reduction in the left ventricular end-diastolic and end-systolic diameters compared to the control group (Table3, Figure2d–f). After losartan therapy, the systolic and diastolic posterior and diastolic inferior wall thicknesses were significantly reduced, and the left ventricular end- diastolic diameter markedly increased as compared to these values in the RT only group suggesting anti-hypertrophic effects of losartan in our chronic RIHD model at week 15 (Table3, Figure2d–f). Moreover, systolic inferior wall thickness and fractional shortening showed a trend of being lower (19%,p= 0.068 and 13%,p= 0.098, respectively), and the left ventricular end-systolic diameter seemed to be higher (66%,p= 0.063) in response to losartan compared to the RT only group at week 15 (Table3). However, there was no significant difference in the ejection fraction between the groups at week 15.
2.4. Cardiomyocyte Hypertrophy and the Overexpression of LVH Markers Were Reduced in the Losartan-Treated Animals 3 and 15 Weeks after RT
Cardiomyocyte cross-sectional areas were measured on hematoxylin–eosin-stained histological slides. Additionally, the left ventricular expressions of cardiac hypertro- phy markers were measured by qRT-PCR to resolve the contradiction between the au- topsy and echocardiography results on heart size and LVH development (Tables1and3, Figures2and3).
At week 1, there were no significant differences in the cardiomyocyte cross-sectional areas between the groups, supporting the heart weight results (Figure3a,b, and Table1).
In contrast, at week 1, the echocardiographic signs showed the initiation of LVH (Table3 and Figure2d–f). Therefore, we investigated the expression of the fetal myosin heavy chainβ-isoform (i.e., β-MHC or Myh7) and the adult myosin heavy chainα-isoform (i.e.,α-MHC orMyh6), as well as their ratio, in order to use them as molecular markers of LVH (Figure3c–e). The increased ratio of theβ-MHC to theα-MHC is an indicator of the fetal gene reprogramming in LVH in response to tissue hypoxia [22]. At week 1, the expression ofα-MHC was significantly decreased, and the expression ofβ-MHC was tendentiously increased in both RT groups irrespective of losartan treatment (93%, p= 0.061 and 80%,p= 0.067, respectively, Figure3c,d). Accordingly, as a compensatory mechanism to cardiac tissue damage due to RT, theβ-MHC toα-MHC (Myh7/Myh6) ratio was significantly increased in both RT groups compared to the control group, supporting the echocardiographic signs of the initiation of compensatory LVH at week 1 (Table2).
At week 3, the cardiomyocyte cross-sectional area showed a trend toward a decrease (10%, p= 0.08) in the RT only group compared to the control group, paralleling the left ventricular weight results (Figure3a,b, Table1). Notably, there were no significant differences in the cardiomyocyte cross-sectional areas between the control and losartan- treated RT groups, supposing the protective effects of losartan in our RIHD model at week 3 (Figure3a,b). At the molecular level, there was no significant difference in the expression ofα-MHC between the groups at week 3 (Figure3c). In contrast, theβ-MHC expression and theβ-MHC toα-MHC ratio were significantly higher in the RT only group compared to the control group, supporting the echocardiographic signs of a mild LVH in our RIHD model at week 3 (Figure3d,e, Table1). There were no significant differences in theβ-MHC expression and theβ-MHC toα-MHC ratio between the losartan-treated RT and control
Int. J. Mol. Sci.2021,22, 12963 8 of 24
groups, similar to the echocardiographic and histologic results in our RIHD model at week 3 (Figure3d,e, Table1).
Int. J. Mol. Sci. 2021, 22, x FOR PEER REVIEW 8 of 24
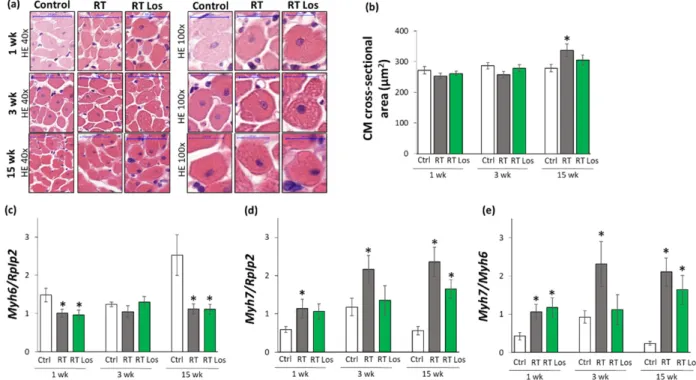
Figure 3. The effects of losartan on left ventricular hypertrophy assessed by histology at weeks 1, 3, and 15. (a) Representa-
tive hematoxylin-eosin (HE)-stained sections at 40× and 100× magnification, (b) cardiomyocyte cross-sectional area, (c) alpha-myosin heavy chain (Myh6), and (d) beta-myosin heavy chain (Myh7) expression in the left ventricle normalized to the ribosomal protein lateral stalk subunit P2 (RpIp2) gene expression, (e)
Myh7/Myh6 ratios. On the digital HE images,cardiomyocyte (CM) cross-sectional areas were measured in 100 selected cardiomyocytes in left ventricular tissue sections cut on equivalent planes. Scale bars represent 50 µm in the 40× magnified images and 20 µm in the 100× magnified images.
Values are presented as mean ± S.E.M., * p < 0.05 vs. control group, (n = 6–7, One-Way ANOVA, Holm-Sidak post hoc test).
Ctrl: control group, RT: radiotherapy only group (50 Gy), RT Los: RT plus losartan group. Representative HE-stained slides were captured in the Panoramic Viewer 1.15.4 software.
At week 15, the cardiomyocyte cross-sectional area was significantly higher in the RT only group compared to the control group, indicating the development of hypertrophy in the surviving cardiomyocytes as a compensatory mechanism despite the smaller heart size in our RIHD model (Figure 3a,b, Table 1). Moreover, there were no significant differ- ences in the cardiomyocyte cross-sectional areas between the losartan-treated RT and con- trol groups, similarly to the echocardiographic results on the anti-hypertrophic effects of losartan at week 15 (Figure 3a,b, Table 1). The α-MHC expressions were markedly de- creased, and the β-MHC expressions with the β-MHC to α-MHC ratios were significantly increased in the RT only group as compared to that in the control group, indicating the development of cardiac hypertrophy at the molecular level in consistence with the echo- cardiographic results (Figures 2 and 3c–e, Table 3). Notably, the losartan-treated RT group showed a trend to a decrease (30%, p = 0.139) in β-MHC expression compared to the RT only group, in accordance with the echocardiographic results and supporting the anti- hypertrophic effects of losartan in our RIHD model (Figure 3d and Table 3).
2.5. Interstitial Fibrosis Was Reduced in the Losartan-Treated Animals 15 Weeks after RT
To further characterize the anti-remodeling effects of losartan in RIHD, fibrosis was quantified on picrosirius red and fast green-stained sections, and the left ventricular gene expression changes of fibrosis and heart failure markers were measured by qRT-PCR (Fig- ures 1 and 4).
At week 1, there was no significant difference in the collagen content between the groups (Figure 4a,b). Moreover, at week 1, left ventricular expressions of collagen type I alpha 1 (Col1a1) and the fibrosis marker connective tissue growth factor (Ctgf) showed no significant difference between the control and RT only groups (Figure 4c). Interestingly, losartan significantly reduced the Ctgf expression compared to the control group at week 1 (Figure 4c).
Figure 3.The effects of losartan on left ventricular hypertrophy assessed by histology at weeks 1, 3, and 15. (a) Representative hematoxylin-eosin (HE)-stained sections at 40×and 100×magnification, (b) cardiomyocyte cross-sectional area, (c) alpha- myosin heavy chain (Myh6), and (d) beta-myosin heavy chain (Myh7) expression in the left ventricle normalized to the ribosomal protein lateral stalk subunit P2 (RpIp2)gene expression, (e)Myh7/Myh6ratios. On the digital HE images, cardiomyocyte (CM) cross-sectional areas were measured in 100 selected cardiomyocytes in left ventricular tissue sections cut on equivalent planes. Scale bars represent 50µm in the 40×magnified images and 20µm in the 100×magnified images.
Values are presented as mean±S.E.M., *p< 0.05 vs. control group, (n= 6–7, One-Way ANOVA, Holm-Sidak post hoc test).
Ctrl: control group, RT: radiotherapy only group (50 Gy), RT Los: RT plus losartan group. Representative HE-stained slides were captured in the Panoramic Viewer 1.15.4 software.
At week 15, the cardiomyocyte cross-sectional area was significantly higher in the RT only group compared to the control group, indicating the development of hypertrophy in the surviving cardiomyocytes as a compensatory mechanism despite the smaller heart size in our RIHD model (Figure3a,b, Table1). Moreover, there were no significant differences in the cardiomyocyte cross-sectional areas between the losartan-treated RT and control groups, similarly to the echocardiographic results on the anti-hypertrophic effects of losartan at week 15 (Figure3a,b, Table1). Theα-MHC expressions were markedly decreased, and theβ-MHC expressions with theβ-MHC toα-MHC ratios were significantly increased in the RT only group as compared to that in the control group, indicating the development of cardiac hypertrophy at the molecular level in consistence with the echocardiographic results (Figures2and3c–e, Table3). Notably, the losartan-treated RT group showed a trend to a decrease (30%,p= 0.139) inβ-MHC expression compared to the RT only group, in accordance with the echocardiographic results and supporting the anti-hypertrophic effects of losartan in our RIHD model (Figure3d and Table3).
2.5. Interstitial Fibrosis Was Reduced in the Losartan-Treated Animals 15 Weeks after RT To further characterize the anti-remodeling effects of losartan in RIHD, fibrosis was quantified on picrosirius red and fast green-stained sections, and the left ventricular gene expression changes of fibrosis and heart failure markers were measured by qRT-PCR (Figures1and4).
Int. J. Mol. Sci.2021,Int. J. Mol. Sci. 2021, 22, x FOR PEER REVIEW 22, 12963 9 of 24 9 of 24
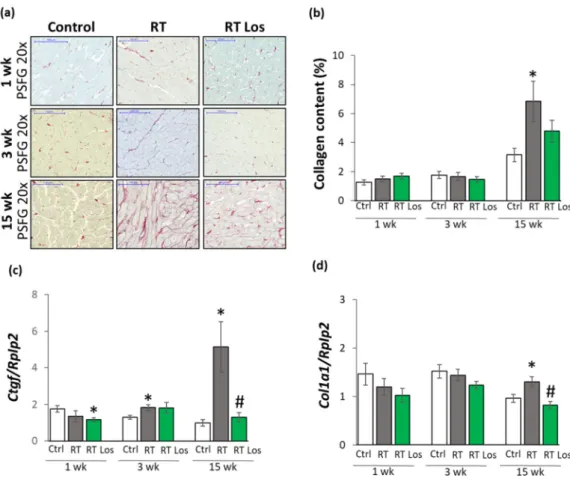
Figure 4. The effects of losartan on left ventricular fibrosis as assessed by histology and qRT-PCR at weeks 1, 3, and 15. (a) Representative picrosirius red and fast green (PSFG)-stained sections at 20× magnification, (b) left ventricular collagen content, left ventricular expression of (c) connective tissue growth factor (Ctgf), (d) collagen 1a1 (Col1a1) normalized to ribosomal protein lateral stalk subunit P2 (Rplp2) gene expression. The mean values of the collagen content of 10 repre- sentative PSFG-stained images were calculated and used for statistical evaluation in each left ventricular sample. Scale bars represent 100 µm at the 20× magnified images. Values are presented as mean ± S.E.M., * p < 0.05 vs. control group, # p < 0.05 vs. RT only group (n = 6–7, One-Way ANOVA, Holm-Sidak post hoc test). Ctrl: control group, RT: radiotherapy only group (50 Gy), RT Los: RT plus losartan group. Representative PSFG-stained slides were captured in the Panoramic Viewer 1.15.4 software.2.7.
At week 3, there were no significant differences in the collagen content and Col1a1 expressions between the groups, suggesting no severe fibrosis in this stage of RIHD (Fig- ure 4a,b,d). Interestingly, the expression of the pro-fibrotic Ctgf was significantly in- creased in the RT only group and tendentiously elevated (43%, p = 0.074) in the losartan- treated RT group compared to the control group (Figure 4d), probably due to initiating wound healing by fibrosis after RT.
At week 15, the collagen content and Col1a1 and Ctgf, expressions were significantly increased in the RT only group compared to that in the control group, supporting the development of left ventricular fibrosis (Figure 4a–d). There was no significant difference in the collagen content between the control and the losartan-treated RT groups, indicating the anti-fibrotic effects of losartan in RIHD at week 15 (Figure 4a,b). Indeed, losartan sig- nificantly reduced the overexpression Col1a1 and Ctgf compared to the RT only group, showing its anti-remodeling effects in our RIHD model at the molecular level (Figure 4c–
f).
2.6. Losartan Reduced the Chymase Overexpression at Weeks 3 and 15 after RT
Inflammatory processes triggered by the over-activation of RAAS are major contrib- utors to the development of cardiac remodeling and fibrosis in RIHD [8]. Therefore, the Figure 4.The effects of losartan on left ventricular fibrosis as assessed by histology and qRT-PCR at
weeks 1, 3, and 15. (a) Representative picrosirius red and fast green (PSFG)-stained sections at 20× magnification, (b) left ventricular collagen content, left ventricular expression of (c) connective tissue growth factor (Ctgf), (d) collagen 1a1 (Col1a1) normalized to ribosomal protein lateral stalk subunit P2 (Rplp2) gene expression. The mean values of the collagen content of 10 representative PSFG-stained images were calculated and used for statistical evaluation in each left ventricular sample. Scale bars represent 100µm at the 20×magnified images. Values are presented as mean±S.E.M., *p< 0.05 vs. control group, #p< 0.05 vs. RT only group (n= 6–7, One-Way ANOVA, Holm-Sidak post hoc test). Ctrl: control group, RT: radiotherapy only group (50 Gy), RT Los: RT plus losartan group.
Representative PSFG-stained slides were captured in the Panoramic Viewer 1.15.4 software.2.7.
At week 1, there was no significant difference in the collagen content between the groups (Figure4a,b). Moreover, at week 1, left ventricular expressions of collagen type I alpha 1 (Col1a1) and the fibrosis marker connective tissue growth factor (Ctgf) showed no significant difference between the control and RT only groups (Figure4c). Interestingly, losartan significantly reduced theCtgf expression compared to the control group at week 1 (Figure4c).
At week 3, there were no significant differences in the collagen content andCol1a1 expressions between the groups, suggesting no severe fibrosis in this stage of RIHD (Figure4a,b,d). Interestingly, the expression of the pro-fibrotic Ctgf was significantly increased in the RT only group and tendentiously elevated (43%,p= 0.074) in the losartan- treated RT group compared to the control group (Figure4d), probably due to initiating wound healing by fibrosis after RT.
At week 15, the collagen content andCol1a1andCtgf, expressions were significantly increased in the RT only group compared to that in the control group, supporting the development of left ventricular fibrosis (Figure4a–d). There was no significant difference in the collagen content between the control and the losartan-treated RT groups, indicating the anti-fibrotic effects of losartan in RIHD at week 15 (Figure4a,b). Indeed, losartan
Int. J. Mol. Sci.2021,22, 12963 10 of 24
significantly reduced the overexpression Col1a1 and Ctgf compared to the RT only group, showing its anti-remodeling effects in our RIHD model at the molecular level (Figure4c–f).
2.6. Losartan Reduced the Chymase Overexpression at Weeks 3 and 15 after RT
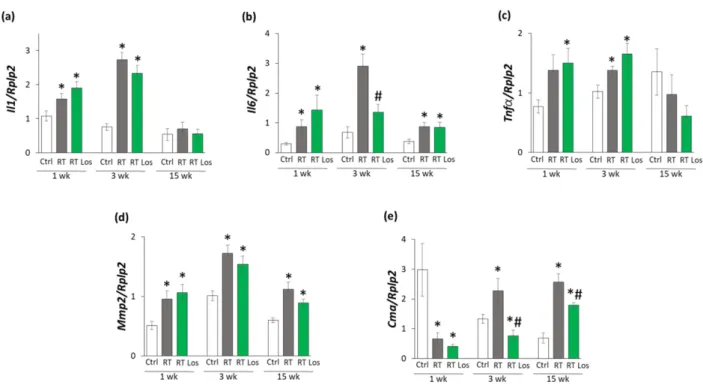
Inflammatory processes triggered by the over-activation of RAAS are major contrib- utors to the development of cardiac remodeling and fibrosis in RIHD [8]. Therefore, the effects of losartan on the cardiac expression of the inflammatory cytokines interleukin-1 (Il1), interleukin-6 (Il6), and tumor necrosis factor-α(Tnfα) were measured by qRT-PCR.
At week 1, the expressions ofIl1andIl6were significantly higher in both RT groups, and the expression ofTnfαwas tendentiously increased (79%,p= 0.062) in the RT only group and significantly increased in the RT plus losartan group as compared to the control group, indicating tissue inflammation after RT (Figure5a–c). At week 3, all measured inflammatory markers, includingIl1,Il6, andTnfα, were significantly overexpressed in the RT only group compared to the control group, pointing out the presence of tissue inflammation at week 3 also (Figure5a–c). Nevertheless, losartan significantly reduced the overexpression of Il6 at week 3 (Figure5b). In contrast, the expression ofIl1andTnfα remained significantly higher in the RT plus losartan group compared to the control group at week 3 (Figure5a,c). At week 15, there were no significant differences in theIl1and Tnfαexpressions between the groups (Figure5a–c). However, it should be mentioned that losartan reduced the Tnfαexpression in a non-significant manner (45%,p= 0.348) compared to the control group. OnlyIl6was significantly overexpressed in the RT groups irrespective of losartan treatment compared to the control group (Figure5b). Mast cell chymase is an alternative activator of tissue AngII in the heart under inflammatory conditions [23,24].
The collagenase matrix metalloprotease 2 (Mmp2) and the mast cell chymase (Cma) could be activated by each other in the heart under inflammatory conditions [25]. Indeed, due to the cardiac inflammation in or RIHD model,Mmp2was overexpressed in the RT groups irrespective of losartan treatment compared to the time-matched control groups at weeks 1, 3, and 15, respectively (Figure 5d). In contrast, Cma was significantly repressed in both RT groups irrespective of losartan treatment compared to the control group at week 1 (Figure5e). At weeks 3 and 15, the significant overexpression ofCmadue to RT was markedly reduced in the RT plus losartan group (Figure5e).
2.7. Losartan Alleviated the Cardiac Fibrosis via Inhibiting the TGF-β-Mediated SMAD-Dependent Pathway in Our RIHD Model at Weeks 3 and 15
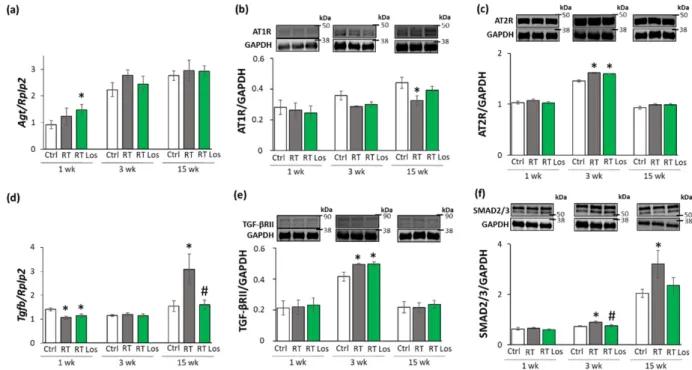
To further characterize the anti-remodeling effects of the AT1 receptor blocker losartan in RIHD, the expression of angiotensinogen (Agt) and transforming growth factor-β(Tgfb) was measured by qRT-PCR. In addition, the expression of the main AngII receptors, including the pro-inflammatory, pro-hypertrophic, and pro-fibrotic AT1 receptor, and the anti-inflammatory, anti-hypertrophic and anti-fibrotic type 2 (AT2) receptor were studied at the protein level [14,15] (Figure6a–f). AT1 receptor was described to activate TGF- β, which can induce fibrosis via the canonical SMAD-dependent and the non-canonical SMAD-independent signaling pathways [14,15,26].
At week 1, there was no significant difference inAgtexpression between the control and RT only groups. However, in the RT plus losartan group, significantly increasedAgt expression was found as compared to the control group at week 1 (Figure6a). No significant differences were detected in the expression of AT1 and AT2 receptors, TGF-βreceptor type II (TGF-βRII) and SMAD2/3 levels between the groups at week 1, in consistence with the histology results on either collagen content or cardiomyocyte cross-sectional areas at week 1 (Figure6b,c,e,f). Interestingly,Tgfbwas significantly repressed in both RT groups irrespective of losartan compared to the control group at week 1 (Figures4and6d).
Int. J. Mol. Sci.2021,22, 12963 11 of 24
Int. J. Mol. Sci. 2021, 22, x FOR PEER REVIEW 10 of 24
effects of losartan on the cardiac expression of the inflammatory cytokines interleukin-1 (Il1), interleukin-6 (Il6), and tumor necrosis factor-α (Tnfα) were measured by qRT-PCR.
At week 1, the expressions of Il1 and Il6 were significantly higher in both RT groups, and the expression of Tnfα was tendentiously increased (79%, p = 0.062) in the RT only group and significantly increased in the RT plus losartan group as compared to the control group, indicating tissue inflammation after RT (Figure 5a–c). At week 3, all measured in- flammatory markers, including Il1, Il6, and Tnfα, were significantly overexpressed in the RT only group compared to the control group, pointing out the presence of tissue inflam- mation at week 3 also (Figure 5a–c). Nevertheless, losartan significantly reduced the over- expression of Il6 at week 3 (Figure 5b). In contrast, the expression of Il1 and Tnfα remained significantly higher in the RT plus losartan group compared to the control group at week 3 (Figure 5a,c). At week 15, there were no significant differences in the Il1 and Tnfα ex- pressions between the groups (Figure 5a–c). However, it should be mentioned that losar- tan reduced the Tnfα expression in a non-significant manner (45%, p = 0.348) compared to the control group. Only Il6 was significantly overexpressed in the RT groups irrespective of losartan treatment compared to the control group (Figure 5b). Mast cell chymase is an alternative activator of tissue AngII in the heart under inflammatory conditions [23,24].
The collagenase matrix metalloprotease 2 (Mmp2) and the mast cell chymase (Cma) could be activated by each other in the heart under inflammatory conditions [25]. Indeed, due to the cardiac inflammation in or RIHD model, Mmp2 was overexpressed in the RT groups irrespective of losartan treatment compared to the time-matched control groups at weeks 1, 3, and 15, respectively (Figure 5d). In contrast, Cma was significantly repressed in both RT groups irrespective of losartan treatment compared to the control group at week 1 (Figure 5e). At weeks 3 and 15, the significant overexpression of Cma due to RT was mark- edly reduced in the RT plus losartan group (Figure 5e).
Figure 5. The effects of losartan on inflammatory gene expressions assessed by qRT-PCR at weeks 1, 3, and 15. Expression
of (a) interleukin-1 (Il1), (b) interleukin-6 (Il6), (c) tumor necrosis factor-alpha (Tnfα), (d) matrix metalloprotease-2 (Mmp2), and (e) chymase (Cma) normalized to ribosomal protein lateral stalk subunit P2 (RpIp2) gene expression were measured in left ventricle samples. Values are presented as mean ± S.E.M., * p < 0.05 vs. control group, # p < 0.05 vs. RT only group (n = 6–7, One-Way ANOVA, Holm-Sidak post hoc test). Ctrl: control group, RT: radiotherapy only group (50 Gy), RT Los:
RT plus losartan group.
2.7. Losartan Alleviated the Cardiac Fibrosis via Inhibiting the TGF-β-Mediated SMAD- Dependent Pathway in Our RIHD Model at Weeks 3 and 15
To further characterize the anti-remodeling effects of the AT1 receptor blocker losar- tan in RIHD, the expression of angiotensinogen (Agt) and transforming growth factor-β
Figure 5.The effects of losartan on inflammatory gene expressions assessed by qRT-PCR at weeks 1, 3, and 15. Expression of (a) interleukin-1 (Il1), (b) interleukin-6 (Il6), (c) tumor necrosis factor-alpha (Tnfα), (d) matrix metalloprotease-2 (Mmp2), and (e) chymase (Cma) normalized to ribosomal protein lateral stalk subunit P2 (RpIp2) gene expression were measured in left ventricle samples. Values are presented as mean±S.E.M., *p< 0.05 vs. control group, #p< 0.05 vs. RT only group (n= 6–7, One-Way ANOVA, Holm-Sidak post hoc test). Ctrl: control group, RT: radiotherapy only group (50 Gy), RT Los:
RT plus losartan group.
At week 3, theAgtexpression was tendentiously increased (40%,p= 0.118) in the RT only group compared to the control group, which may suggest a mild activation of tissue RAAS (Figure6a). In both RT groups, the AT1 receptor protein levels showed a trend to decrease (19%,p= 0.054 and 16%,p= 0.090, respectively) compared to the control group (Figure6b,c). Moreover, in both RT groups, the AT2 receptor protein expressions were significantly increased as compared to the control group (Figure6c). There was no significant difference in the cardiacTgfbexpression between the groups (Figure6d). In contrast, TGF-βRII and SMAD2/3 protein levels were significantly increased in the RT only group compared to the control group (Figure6e,f). Losartan significantly reduced the SMAD2/3 levels but not the TGF-βRII level compared to the RT only group at week 3 (Figure6e,f).
At week 15, there was no significant difference inAgtexpression between the groups (Figure6a). The AT1 receptor protein level was significantly decreased in the RT only group compared to the control group at week 15, supposedly, in response to the over-activation of AngII (Figure6b). There was no significant difference in the AT1 receptor protein levels between the control and losartan-treated RT groups at week 15 (Figure6b). There were no significant differences between the AT2 protein levels between the groups (Figure6c).
Interestingly, the significant overexpression ofTgfbwas markedly reduced by losartan at week 15 (Figure6d). Accordingly, SMAD2/3 protein levels were significantly increased in the RT only group compared to the control group at week 15, suggesting that the canonical SMAD-dependent signaling pathway might play a crucial role in the development of fibrosis in RIHD (Figure6f). Interestingly, there were no significant differences between the AT2 receptor and TGF-βRII levels between the groups at week 15 (Figure6c,e). In accordance with the echocardiography and histology results, there was no significant difference in the SMAD2/3 protein level between the losartan-treated RT and the control groups at week 15.
Int. J. Mol. Sci.2021,22, 12963 12 of 24
Int. J. Mol. Sci. 2021, 22, x FOR PEER REVIEW 11 of 24
(Tgfb) was measured by qRT-PCR. In addition, the expression of the main AngII receptors, including the pro-inflammatory, pro-hypertrophic, and pro-fibrotic AT1 receptor, and the anti-inflammatory, anti-hypertrophic and anti-fibrotic type 2 (AT2) receptor were studied at the protein level [14,15] (Figure 6a–f). AT1 receptor was described to activate TGF-β, which can induce fibrosis via the canonical SMAD-dependent and the non-canonical SMAD-independent signaling pathways [14,15,26].
Figure 6. The effects of losartan on the expression of genes and proteins related to the cardiac renin-
angiotensin-aldosterone system and canonical SMAD-dependent pathway at weeks 1, 3, and 15.
Left ventricular expression of (a) angiotensinogen (Agt) normalized to ribosomal protein lateral stalk subunit P2 (RpIp2) gene expression, left ventricular protein expression and cropped repre- sentative images of (b) angiotensin II type 1 receptor (AT1R, 41 kDa), and (c) angiotensin II type 2 receptor (AT2R, 41 kDa), (d) left ventricular expression of transforming growth factor-beta (Tgfb) normalized to RpIp2 gene expression, left ventricular expression and cropped representative images of (e) TGF-β receptor II (TGF-βRII, 85 kDa) and (f) SMAD2/3 (52 and 60 kDa). Values are presented as mean ± S.E.M., * p < 0.05 vs. control group, # p < 0.05 vs. RT only group (n = 6–7, One-Way ANOVA, Holm-Sidak post hoc test). Ctrl: control group, RT: radiotherapy only group (50 Gy), RT Los: RT plus losartan group. Glyceraldehyde-3-phosphate dehydrogenase (GAPDH, 37 kDa) was used as a loading control in protein expression changes assessed by Western blot. Images were cap- tured with the Odyssey CLx machine and exported with Image Studio 5.2.5 software. Black lines next to the Western blot images represent the position of protein markers with corresponding mo- lecular weights. The uncropped Ponceau-stained membranes and the full-length Western blot im- ages with the protein ladders are presented in Figures S1–S9.
At week 1, there was no significant difference in Agt expression between the control and RT only groups. However, in the RT plus losartan group, significantly increased Agt expression was found as compared to the control group at week 1 (Figure 6a). No signifi- cant differences were detected in the expression of AT1 and AT2 receptors, TGF-β recep- tor type II (TGF-βRII) and SMAD2/3 levels between the groups at week 1, in consistence with the histology results on either collagen content or cardiomyocyte cross-sectional ar- eas at week 1 (Figure 6b,c,e,f). Interestingly, Tgfb was significantly repressed in both RT groups irrespective of losartan compared to the control group at week 1 (Figures 6d and 4).
At week 3, the Agt expression was tendentiously increased (40%, p = 0.118) in the RT only group compared to the control group, which may suggest a mild activation of tissue RAAS (Figure 6a). In both RT groups, the AT1 receptor protein levels showed a trend to decrease (19%, p = 0.054 and 16%, p = 0.090, respectively) compared to the control group (Figure 6b,c). Moreover, in both RT groups, the AT2 receptor protein expressions were
Figure 6.The effects of losartan on the expression of genes and proteins related to the cardiac renin-angiotensin-aldosterone system and canonical SMAD-dependent pathway at weeks 1, 3, and 15. Left ventricular expression of (a) angiotensinogen (Agt) normalized to ribosomal protein lateral stalk subunit P2 (RpIp2) gene expression, left ventricular protein expression and cropped representative images of (b) angiotensin II type 1 receptor (AT1R, 41 kDa), and (c) angiotensin II type 2 receptor (AT2R, 41 kDa), (d) left ventricular expression of transforming growth factor-beta (Tgfb) normalized toRpIp2gene expression, left ventricular expression and cropped representative images of (e) TGF-βreceptor II (TGF-βRII, 85 kDa) and (f) SMAD2/3 (52 and 60 kDa). Values are presented as mean±S.E.M., *p< 0.05 vs. control group, #p< 0.05 vs. RT only group (n= 6–7, One-Way ANOVA, Holm-Sidak post hoc test). Ctrl: control group, RT: radiotherapy only group (50 Gy), RT Los: RT plus losartan group. Glyceraldehyde-3-phosphate dehydrogenase (GAPDH, 37 kDa) was used as a loading control in protein expression changes assessed by Western blot. Images were captured with the Odyssey CLx machine and exported with Image Studio 5.2.5 software. Black lines next to the Western blot images represent the position of protein markers with corresponding molecular weights. The uncropped Ponceau-stained membranes and the full-length Western blot images with the protein ladders are presented in Figures S1–S9.
2.8. ERK1,2- and AKT-Mediated Pathways Might Be Involved in Compensatory Hypertrophy after RT at Week 15
The non-canonical SMAD-independent signaling pathways include ERK1,2, AKT, and STAT3-mediated fibrotic and hypertrophic pathways beyond other mediators [27]. The levels of total (t)ERK1,2, AKT, and STAT3 as well as their phosphorylated (p) forms are presented in the Figures S10 and S11.
At week 1, there was no significant difference in the expression of the pERK1,2/tERK1,2, pAKT/tAKT, and pSTAT3/STAT3 ratios between the groups (Figure7a–d). At week 3, there were no significant differences in the pERK1/tERK1 and pERK2/tERK2 ratios between the RT only and control groups (Figure7a,b). In contrast, after losartan treatment at week 3, the pERK1/tERK1 ratio was significantly increased, and a trend to an increase (60%, p= 0.072) was seen in the case of the pERK2/tERK2 ratio (Figure7a,b). The higher pERK1 and pERK2 protein levels led to the increased pERK1/tERK1 and pERK2/tERK2 ratios in the losartan-treated RT group compared to the control group at week 3 (Figure S10). At week 15, pERK1/tERK1 and pERK2/tERK2 ratios were significantly increased in the RT groups irrespective of losartan treatment as compared to the control group (Figure7a,b).
Moreover, in response to losartan, the pERK1/tERK1 ratio was significantly elevated, and the pERK2/tERK2 ratio showed a trend to an increase (61%,p= 0.063) as compared to the RT only group (Figure7a,b). The pERK1 and pERK2 protein levels showed a similar pattern to the pERK/tERK ratios (Figure S10). At weeks 1 and 3, there were no