Research Article
Prediabetes Induced by Fructose-Enriched Diet Influences
Cardiac Lipidome and Proteome and Leads to Deterioration of Cardiac Function prior to the Development of Excessive Oxidative Stress and Cell Damage
GergőSzűcs ,1,2Andrea Sója,1,2Mária Péter,3Márta Sárközy ,1,2Bella Bruszel,2,4
Andrea Siska,5Imre Földesi,5Zoltán Szabó,2,4Tamás Janáky,2,4László Vígh,3Gábor Balogh,3 and Tamás Csont 1,2
1Metabolic Diseases and Cell Signaling Group, Department of Biochemistry, Faculty of Medicine, University of Szeged, Szeged H-6720, Hungary
2Interdisciplinary Centre of Excellence, University of Szeged, Szeged H-6720, Hungary
3Institute of Biochemistry, Biological Research Center of the Hungarian Academy of Sciences, Szeged H-6726, Hungary
4Institute of Medical Chemistry, Faculty of Medicine, University of Szeged, Szeged H-6720, Hungary
5Department of Laboratory Medicine, Faculty of Medicine, University of Szeged, Szeged H-6720, Hungary Correspondence should be addressed to GergőSzűcs; szucs.gergo@med.u-szeged.hu
and Tamás Csont; csont.tamas@med.u-szeged.hu
Received 21 June 2019; Revised 3 October 2019; Accepted 16 October 2019; Published 9 December 2019 Guest Editor: Konstantin Lyamzaev
Copyright © 2019 GergőSzűcs et al. This is an open access article distributed under the Creative Commons Attribution License, which permits unrestricted use, distribution, and reproduction in any medium, provided the original work is properly cited.
Prediabetes is a condition affecting more than 35% of the population. In some forms, excessive carbohydrate intake (primarily refined sugar) plays a prominent role. Prediabetes is a symptomless, mostly unrecognized disease which increases cardiovascular risk. In our work, we examined the effect of a fructose-enriched diet on cardiac function and lipidome as well as proteome of cardiac muscle. Male Wistar rats were divided into two groups. The control group received a normal diet while the fructose-fed group received 60% fructose-supplemented chow for 24 weeks. Fasting blood glucose measurement and oral glucose tolerance test (OGTT) showed slightly but significantly elevated values due to fructose feeding indicating development of a prediabetic condition. Both echocardiography and isolated working heart perfusion performed at the end of the feeding protocol demonstrated diastolic cardiac dysfunction in the fructose-fed group. Mass spectrometry-based, high-performance lipidomic and proteomic analyses were executed from cardiac tissue. The lipidomic analysis revealed complex rearrangement of the whole lipidome with special emphasis on defects in cardiolipin remodeling.
The proteomic analysis showed significant changes in 75 cardiac proteins due to fructose feeding including mitochondria-, apoptosis-, and oxidative stress-related proteins. Nevertheless, just very weak or no signs of apoptosis induction and oxidative stress were detected in the hearts of fructose-fed rats. Our results suggest that fructose feeding induces marked alterations in the cardiac lipidome, especially in cardiolipin remodeling, which leads to mitochondrial dysfunction and impaired cardiac function. However, at the same time, several adaptive responses are induced at the proteome level in order to maintain a homeostatic balance. These findings demonstrate that even very early stages of prediabetes can impair cardiac function and can result in significant changes in the lipidome and proteome of the heart prior to the development of excessive oxidative stress and cell damage.
Volume 2019, Article ID 3218275, 21 pages https://doi.org/10.1155/2019/3218275
1. Introduction
Diabetes mellitus is a heterogeneous chronic metabolic disor- der characterized by hyperglycemia [1]. The number of peo- ple suffering from diabetes increased from 108 million in 1980 to 422 million by 2014, and global prevalence almost doubled since 1980, from 4.7% to 8.5% [2]. According to the International Diabetes Federation, the number of people with diabetes may rise to 629 million by 2045 [3]. Prediabe- tes—in which glucose levels do not meet the criteria for dia- betes but are too high to be considered normal—usually precedes diabetes mellitus and may remain symptomless for several years [4]. Prediabetes affects more than 35% of the population, and it is known that even nondiabetic levels of hyperglycemia and impaired glucose tolerance may be associated with an elevated risk of cardiovascular disease [5]. It has been recently shown that a mild diastolic dysfunc- tion occurs even in prediabetic rats [6].
Type 2 diabetes is associated with myocardial lipotoxicity [7], which can cause impaired mitochondrial function [8].
Impaired mitochondrial function enhances oxidative stress, activates apoptosis, and thus contributes to cardiac dysfunc- tion [7, 9, 10]. Although the role of lipotoxicity, oxidative stress, and apoptosis in diabetes has been well studied, the role of these mechanisms in prediabetes has not yet been well described. Saccharose and high-fructose corn syrup (isoglu- cose) are often used as sweeteners in the food and drink industry, and the consumption of these fructose-rich foods or beverages has an adverse effect on both animals [11] and humans [12]. A high-fructose diet is often used as a model of prediabetes or impaired glucose tolerance. After absorp- tion, fructose is rapidly and uncontrollably absorbed in the liver, where its metabolism increases de novo lipogenesis (DNL). Induction of DNL has the capacity to alter the circu- lating nonesterified fatty acid (FA) profile, which, in turn, might affect cardiac lipid composition [13].
Proper cardiac lipid composition is strongly correlated with cardiac function and largely relies on proper cardioli- pin (CL) content and species profile [14]. CL is the hall- mark phospholipid (PL) of mitochondria that plays a role in many mitochondrial processes, including respiration and energy conversion. The heart is full of mitochondria, and CL accounts for about 10-15 mol% of all membrane lipids. Changes in the CL pool due to either oxidation or pathological remodeling cause mitochondrial dysfunctions and trigger retrograde signaling pathways that are associ- ated with a large number of cardiac diseases including dia- betes [15]. It is widely accepted that the symmetric tetra- linoleoyl (18:2) CL species, which constitutes up to 80%
of mammalian cardiac CL, is required for mitochondria to work optimally in metabolically active tissues [16]. After its initial biosynthesis, premature CL undergoes intensive remodeling processes to produce maturated CL (Supple- mentary Lipid Figure 1) [14, 15, 17–19]. In the first step of maturation, the removal of a single acyl chain is executed by a calcium-independent phospholipase A2 to produce monolysocardiolipin (MLCL). Reacylation can be carried out by CoA-dependent acyltransferases or a CoA- independent reversible PL-lysoPL (LPL) transacylase called
tafazzin. Tafazzin itself lacks acyl chain preference; still, it is believed to be the major enzyme involved in CL remodeling to produce homo-acylated CL [16]. Mutations in tafazzin cause abnormal molecular species of CL and the clinical phenotype of Barth syndrome, a rare and often fatal x-linked genetic disorder characterized by dilated cardiomyopathy, skeletal myopathy, and neutropenia [20].
Although CL is known to be relatively resistant to dietary manipulations, by“appropriate”interventions, the linoleoyl chain can be replaced [21]. Fructose feeding might represent such an intervention due to its highly lipogenic nature.
Therefore, our study is aimed at examining the effects of fructose-enriched diet on the interplay of cardiac function, cardiac lipidome and proteome, and oxidative stress and apoptosis in a rat prediabetes model. To achieve this goal, several methods and techniques were applied including con- ventional blood tests, detailed serum analysis, enzymatic assays, protein expression analyses, transthoracic echocardi- ography, and high-performance mass spectrometry- (MS-) based proteomics and lipidomics.
2. Materials and Methods
This investigation conformed to the National Institutes of Health Guide for the Care and Use of Laboratory Animals (NIH Publication No. 85-23, Revised 1996) and was approved by the Animal Research Ethics Committee of Uni- versity of Szeged.
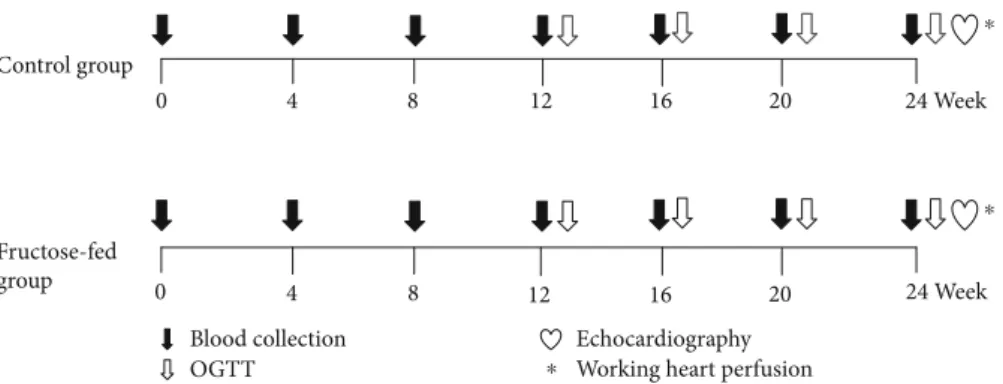
2.1. Experimental Design.Male Wistar rats (310–450 g,n= 16 in the entire study) were kept under controlled tempera- ture with 12/12 h light/dark cycles. Animals were divided into two groups and were fed with the following diets for 24 weeks: the control group (n= 8) was fed with a standard laboratory chow, while the fructose-fed group (n= 8) received a chow containing 60% fructose. Fasting blood glucose was measured every 4 weeks, while at weeks 12, 16, 20, and 24 oral glucose tolerance tests (OGTT) were performed. At week 20 and week 24, blood samples were taken to measure serum parameters. At the end of the feeding protocol, cardiac function was assessed by both in vivo echocardiography and ex vivo working heart perfu- sions (Figure 1). Following the perfusions, myocardial tis- sue was harvested for biochemical analysis.
2.2. Transthoracic Echocardiography. Cardiac morphology and function were assessed by transthoracic echocardiogra- phy at week 24 as described previously [22–24]. Briefly, rats were anesthetized with sodium pentobarbital (Euthasol, 40 mg/kg body weight i.p.). Then, the chest was shaved, and the rat was placed in a supine position onto a heating pad. Two-dimensional, M-mode, and Doppler echocardio- graphic examinations were performed by the criteria of the American Society of Echocardiography with a Vivid IQ ultrasound system (General Electric Medical Systems) using a phased array 5.0–11 MHz transducer (GE 12S-RS probe). Data of three consecutive heart cycles were ana- lyzed (EchoPac Dimension software; General Electric Med- ical Systems) by an experienced investigator in a blinded
manner. Systolic and diastolic wall thickness parameters were obtained from parasternal short-axis view at the level of the papillary muscles (anterior and inferior walls) and long-axis view at the level of the mitral valve (septal and posterior walls). The left ventricular diameters were mea- sured by means of M-mode echocardiography from long- axis views between the endocardial borders. Fractional shortening (FS) was used as a measure of cardiac contractil- ity (FS =ðLVEDD−LVESDÞ/LVEDD × 100). Functional parameters including left ventricular end-diastolic volume (LVEDV) and left ventricular end-systolic volume (LVESV) were calculated on four-chamber view images delineating the endocardial borders in diastole and systole. The stroke volume was calculated as the difference of LVEDV and LVESV. The ejection fraction (EF) was calculated according to the formulaðLVEDV−LVESVÞ/LVEDV∗100. Diastolic function was assessed using pulse-wave Doppler across the mitral valve from the apical four-chamber view. Early (E) and atrial (A) flow velocities provide an indication of dia- stolic function. Heart rate was also calculated using pulse- wave Doppler images during the measurement of transvalv- ularflow velocity profiles according to the length of 3 con- secutive heart cycles measured between the start points of the E waves. The mean values of three measurements were calculated and used for statistical evaluation.
2.3. Working Heart Perfusion.Immediately after the echocar- diography, cardiac performance was assessed in isolated working rat hearts, as described earlier [25–27]. Anesthetized rats were given 500 U·kg−1 heparin intravenously. Hearts were then isolated, and the aorta was cannulated and initially perfused in Langendorff mode (at a constant pressure of 73 mmHg, 37°C) with Krebs-Henseleit buffer containing NaCl 118 mM, NaHCO3 25 mM, KCl 4.3 mM, CaCl2 2.4 mM, KH2PO4 1.2 mM, MgSO4 1.2 mM, and glucose 11 mM, gassed with 95% O2 and 5% CO2 [22, 28]. Then, the perfusion system was switched to working mode accord- ing to Neely with recirculating buffer [28, 29]. Hydrostatic preload and afterload were kept constant at 13 mmHg and
73 mmHg, respectively, throughout the experiments. Hearts were subjected to 10 min equilibration period before mea- surement (n= 7–8). Cardiac functional parameters includ- ing heart rate, coronary flow, aortic flow, cardiac output, left ventricular developed pressure (LVDP) and itsfirst deriv- atives (dp/dt max and dp/dt min), and left ventricular end- diastolic pressure (LVEDP) were measured. At the end of the perfusion, the hearts were weighed, and the left and right ventricles were separated. The right and left ventricles were snap frozen in liquid nitrogen and stored at−80°C until they were used for biochemical assays.
2.4. Measurement of Malondialdehyde Levels. In order to measure the level of systemic and cardiac lipid peroxidation, serum malondialdehyde and left ventricular tissue malon- dialdehyde were assayed spectrophotometrically at 535 nm as described previously [27, 30]. Results are expressed as nmol/mL serum and nmol/mg protein.
2.5. mRNA Expression Profiling by qRT-PCR. Quantitative RT-PCR was performed with gene-specific primers to mon- itor mRNA expression as described previously [24]. To assess de novo lipid synthesis, expression of sterol regula- tory element-binding transcription factor 1 (Srebf1), stearoyl-CoA desaturase 1 (Scd1), stearoyl-CoA desaturase 2 (SCD2), fatty acid synthase (Fasn), acetyl-CoA carboxyl- ase 1 (Acaca), carbohydrate-responsive element-binding protein (Mlxipl), elongation of very-long-chain fatty acids protein 6 (ELOVL6), fatty acid desaturase 1 (Fads1), and fatty acid desaturase 2 (Fads2) were measured from liver samples. To assess cardiac hypertrophy, expression of myo- sin heavy chainαisoform (MYH6) and myosin heavy chain βisoform (MYH7) was measured. RNA was isolated using Qiagen RNeasy Fibrous Tissue Mini Kit (Qiagen, #74704) from the liver and heart tissues. Briefly, 4μg and 2.2μg of total RNA from liver and heart samples, respectively, were reverse transcribed using iScript™Advanced cDNA Synthe- sis kit (Bio-Rad, 1725038), and specific primers and SsoAd- vanced™Universal SYBR® Green Supermix (Bio-Rad) were
0 4 8 12 16 20 24 Week
24 Week
0 4 8 12 16 20
Control group
Fructose-fed group
Blood collection OGTT
⁎
⁎
Echocardiography
⁎ Working heart perfusion
Figure 1: Experimental protocol. Male Wistar rats were divided into control (n= 8) and fructose-fed (n= 8) groups receiving either a standard chow or a chow supplemented with 60% fructose, respectively, for 24 weeks. Fasting blood glucose measurement or oral glucose tolerance test (OGTT) was performed every four weeks to monitor the development of prediabetic condition. At week 24, transthoracic echocardiography was performed to monitor cardiac function and morphology. Then, the hearts of the animals were isolated and mounted on a working heart perfusion system to measure hemodynamic and pressure parameters. After the perfusions, hearts were frozen for measurement of biochemical parameters.
used according to the manufacturer’s instructions. Hypo- xanthine phosphoribosyltransferase 1 (Hprt1) was used as control for normalization.
2.6. Lipidomics. Approximately 20 mg of the powdered left ventricle was directly extracted by adding 1 mL of methanol containing 0.001% butylated hydroxytoluene as an antioxi- dant and 60μg di20:0 phosphatidylcholine as extraction standard. After a 5 min sonication in a water bath sonica- tor, the mixture was shaken for 5 min and centrifuged at 10000× g for 5 min. The supernatant was transferred into a new Eppendorf tube and stored at−20°C until mass spec- trometry (MS) analysis.
The solvents used for extraction and MS analyses were of Optima LCMS grade from Thermo Fisher Scientific (Bre- men, Germany) and liquid chromatographic grade from Merck (Darmstadt, Germany). Lipid standards were pur- chased from Avanti Polar Lipids (Alabaster, AL). All other chemicals were from Sigma-Aldrich (Steinheim, Germany) and were of the best available grade.
Mass spectrometric analyses were performed on an LTQ-Orbitrap Elite instrument (Thermo Fisher Scientific, Bremen, Germany) equipped with a robotic nanoflow ion source (TriVersa NanoMate; Advion BioSciences; Ithaca, NY, USA) as described in [31]. Further details of MS mea- surements and lipid species annotation are given in the Supplementary Methods.
2.7. Proteomics. Approximately 30 mg of powdered left ventricle tissue samples was homogenized in lysate buffer (containing 2% SDS and 0.1 M DTT in 0.1 Tris solution).
The homogenized samples were incubated at 98°C for 5 min. Proteins were precipitated by the addition of methanol/chloroform mixture (4 : 1) and were resuspended in 8 M urea. The total protein contents were determined using BCA (Thermo) protocol. 20μg protein was digested by trypsin (Thermo) using RapiGest (Waters) detergent to enhance the digestion. In-gel fractionation was performed for pooled sample. In-gel fractionated samples were also digested by trypsin.
1D gel samples and pooled samples were measured in DDA (data-dependent acquisition) using a 90 min gradient on a Waters nanoAcquity-Thermo Q Exactive Plus LC-MS system to build a spectrum library of detectable peptides.
The individual samples were measured in DIA (Data Inde- pendent Acquisition) mode for protein quantification with the same LC gradient using the spectrum library. The acquired data were analyzed with Encyclopedia [32] and sta- tistically evaluated using Perseus [33] software. Enrichment of significantly changing proteins according to subcellular localization was carried out by Gene Ontology analysis (https://www.ebi.ac.uk/QuickGO/). Pathway assignment analysis of significantly altered proteins was performed with Reactome (https://www.reactome.org) after assignment to human genes, for higher annotation coverage. Further details of proteomic analysis are given in the Supplementary Methods.
2.8. Measurement of Serum and Pancreatic Insulin Levels.
Serum and pancreatic insulin levels were measured by an
enzyme immunoassay (Mercodia, Ultrasensitive Rat Insulin ELISA) in order to verify the development of hyperinsuline- mia and decreased pancreatic insulin content as a conse- quence of beta cell damage in impaired glucose tolerance.
Insulin ELISA was carried out according to the instructions of the manufacturer from either sera or homogenized pan- creatic tissue samples of fructose-fed and control rats. Sera were centrifuged (2000 g for 10 min at 4°C) and kept at -20°C until further investigation. Pancreata were removed, trimmed free of adipose tissue, and weighed. Pancreata were homogenized in 6 mL cold acidified ethanol (0.7 M HCl : ethanol (1 : 3v/v)) with an Ultra Turrax homogenizer and were kept at 4°C for 24 h. Then, pancreas homogenates were centrifuged (900 g for 15 min at 4°C), and the superna- tants were stored at 4°C. The pellet was extracted again with 3 mL acidified ethanol for 24 h at 4°C. The supernatant obtained after centrifugation was pooled with the previous one and kept at -20°C until assayed [34, 35].
2.9. HOMA-IR Index. To estimate insulin resistance in fructose-fed or control rats, the widely used HOMA-IR index was calculated [34, 36, 37] by multiplying fasting serum insu- lin (μU/mL) with fasting serum glucose (mmol/L) then dividing by the constant 22.5, i.e., HOMA‐IR =ðfasting serum insulin concentration × fasting serum glucose
concentrationÞ/22:5.
2.10. Measurement of Serum Lipid Levels.Serum cholesterol, triglyceride, LDL, and HDL levels were measured at week 24 using a test kit supplied by Diagnosticum Zrt. (Budapest, Hungary) as described previously [27].
2.11. 3-NT ELISA. A double-antibody sandwich ELISA kit specific for 3-nitrotyrosine measurement was purchased from Genasiabio (Shanghai, China). Left ventricles were homogenized (Heilscher UP100H Ultrasonic Processor) in Phosphate Buffer Saline (PBS) (pH 7.2–7.4) and then centri- fuged at 3000 rpm for 20 min at 4°C. Nitrotyrosine was mea- sured according to the manufacturer’s instructions and protocols, and optical densities (OD) were determined at 450 nm. Results were expressed as nmol/mg protein.
2.12. Measurement of Serum Laboratory Parameters. Urea and creatinine levels in serum were quantified by kinetic UV method using urease and glutamate dehydrogenase enzymes and Jaffe method, respectively. The reagents and the platform analyzers were from Roche Diagnostics. Serum sodium, potassium, and chloride levels were determined by indirect potentiometry using ion-selective electrodes at week 24. All reagents and instruments were from Roche Diagnos- tics. Alanine aminotransferase (ALAT), aspartate amino- transferase (ASAT), creatine kinase (CK), and lactate dehydrogenase (LDH) enzyme activities were measured with Roche UV assays standardized according to the recommen- dations of IFCC (International Federation of Clinical Chem- istry). Creatine kinase MB enzyme activities were determined using an immunological UV assay of Roche.
2.13. Western Blot.To investigate changes of apoptotic pro- teins, the standard western blot technique was used in case
of Bax, Bcl-2, Bcl-xL, caspase-7, and caspase-3 with actin or tubulin loading background. Left ventricular samples (n= 8) were homogenized with an ultrasonicator (UP100H Hielscher, Teltow, Germany) in Radio-Immunoprecipitation Assay (RIPA) buffer (50 mM Tris-HCl (pH 8.0)), 150 mM NaCl, 0.5% sodium deoxycholate, 5 mM ethylenediamine tetra-acetic acid (EDTA), 0.1% sodium dodecyl sulfate, 1%
NP-40 (Cell Signaling, Carlsbad, CA, USA) supplemented with phenylmethanesulfonyl fluoride (PMSF). The crude homogenates were centrifuged at 15000 × g for 30 min at 4°C. After quantification of protein concentrations of the supernatants using the BCA Protein Assay Kit (Pierce, Rockford, IL, USA), 25μg of reduced and denaturized pro- tein was loaded. Then, sodium dodecyl-sulfate polyacryl- amide gel electrophoresis (SDS-PAGE) was performed (10% gel, 50 V, 4 h) followed by the transfer of proteins onto a nitrocellulose membrane (20% methanol, 35 V, 1.5 h). The efficacy of transfer was checked using Ponceau staining. The membranes were cut horizontally into parts corresponding to the molecular weights of Bax, Bcl-2, Bcl- xL, caspase-7, caspase-3, actin, and tubulin. Membranes were blocked for 1 h in 5% (w/v) bovine serum albumin (BSA) and were incubated with primary antibodies in the concentrations of 1 : 1000 against Bax (#2772), Bcl-2 (#3498), Bcl-xL (#2764), caspase-7 (#12827), caspase-3 (#14220),α-tubulin (#2144), andβ-actin (#4970) overnight at 4°C in 5% BSA. Then, the membranes were incubated with IRDye® 800CW Goat Anti-Rabbit secondary anti- body (Li-Cor) for 1 h at room temperature in 5% BSA.
Fluorescent signals were detected by Odyssey CLx, and digital images were analyzed and evaluated by Quantity One Software.
2.14. Statistical Analysis. Proteomic data are presented as mean intensities ± CV, fold change, andpvalue. For proteo- mic data, the statistical significance was tested using unpaired Welch test.p< 0:05 and a fold change > 1:5were accepted as a statistically significant difference. Lipidomic data are presented as mean ± SEM; statistical significance was determined according to Storey and Tibshirani [38]
and was accepted forp< 0:05 corresponding to a false dis- covery rate < 0:05. PCA analyses were performed using MetaboAnalyst [39]. All other parameters are presented as mean ± SEM, and significance between groups was determined with two samplet-test or Mann-Whitney Rank Sum Test.
3. Results and Discussion
3.1. Prediabetes and Characterization of the Animal Model.
In the present study, male Wistar rats were fed with 60%
fructose-containing chow for 24 weeks to create a model of prediabetes. We have chosen this model in order to examine the effect of a moderate metabolic condition on the heart, rather than looking at the effects of severely disturbed glucose and lipid homeostasis seen for instance in genetically modi- fied diabetes models (e.g., db/db or ob/ob mice) [40, 41]. In order to verify the development of the prediabetic state, fast- ing blood glucose was measured at every 4th week, and OGTT was performed at weeks 12, 16, 20, and 24. Fasting
glucose levels were slightly but significantly higher in fructose-fed rats at weeks 12, 16, 20, and 24 (Figure 2(a)).
OGTT area under the curve values were also significantly increased in fructose-fed rats at weeks 16, 20, and 24 (Figure 2(b)). These results demonstrate the development of prediabetes with impaired glucose tolerance in the present model. HOMA-IR, a widely used indicator of insulin resis- tance, was significantly higher in the fructose-fed rats at week 20, although no significant difference was detected in serum insulin levels (Figure 2(c)). Pancreatic insulin level was sig- nificantly higher in the fructose-fed group compared to con- trols (Figure 2(e)). These data demonstrate the appearance of a mild insulin resistance in our present model.
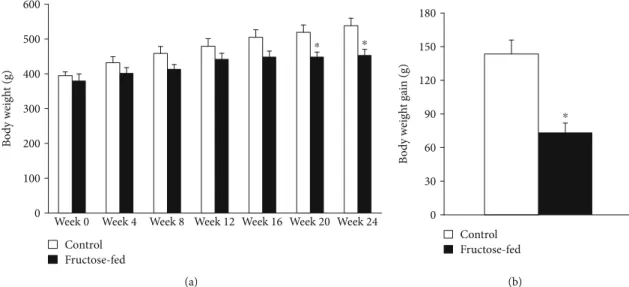
Although body weight increased in both groups during the course of the study, by the end of 24-week feeding, the weight of the fructose-fed rats was significantly smaller com- pared to that of the control rats (Figure 3(a)). Weight gain during the study was decreased in fructose-fed rats (Figure 3(b)). Although liver weight was not significantly dif- ferent in fructose-fed rats, the liver weight to body weight ratio was increased (Table 1). Moreover, during the isolation of organs, we have observed macroscopical signs of fatty degeneration on the liver of fructose-fed animals. These findings may indicate fatty degeneration in the liver due to DNL initiated by fructose feeding. In fact, it has been demonstrated that fructose may activate DNL due to its rapid conversion to pyruvate bypassing the regulatory step of glycolysis catalyzed by the phosphofructokinase-1 enzyme [42]. Compared to the effects of fat-supplemented diet which leads to fat deposits both in the liver and adi- pose tissue (liver as well as body weight gain), dietary fruc- tose preferably increases lipid accumulation only in the liver [42]. Fructose feeding may affect the metabolism of skeletal muscle through metabolic stress. For instance, Gatineau et al. showed that older rats fed with fructose- containing diet lost significantly more lean body mass and maintained more adipose tissue than control rats [43]. In sucrose-fed rats, significantly lower diet-induced muscle protein synthesis was observed compared to starch-fed rats [43]. Additionally, excessive fructose consumption was shown in the liver to increase production of substances such as methylglyoxal, which leads to oxidative stress in the muscle [44]. Activated DNL leads to endoplasmic retic- ulum stress [45] and production of hepatokines, such as fetuin-A [46], known to adversely affect muscle energy metabolism and insulin sensitivity [47]. These findings might explain decreased body weight gain in fructose-fed rats in our present study. Despite the macroscopic signs of fatty degeneration in the liver, neither serum lipid parameters (triglycerides, total cholesterol, and LDL and HDL cholesterol) nor liver enzymes (ALAT, ASAT) were increased in fructose-fed rats (Table 2) indicating an early stage of hepatic consequences.
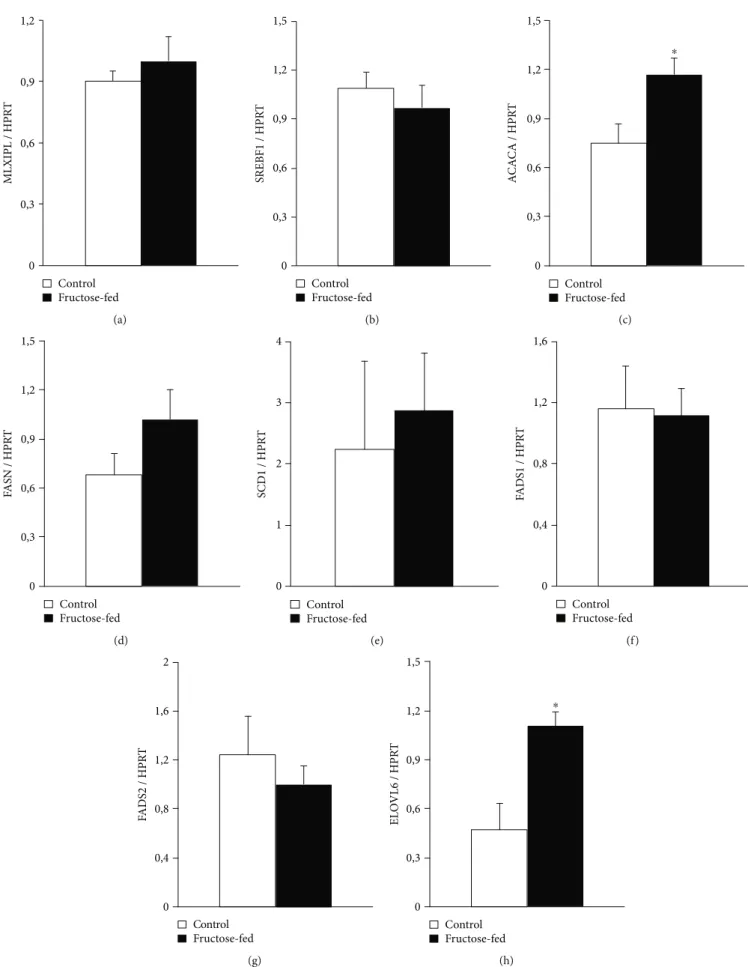
To further characterize metabolic changes in the liver of fructose-fed rats, we performed qRT-PCR. We examined Srebf1 and Mlxipl transcription factors which regulate fatty acid metabolism related genes. No difference was found between control and fructose-fed group. We also examined Acaca and Fasn. Acaca catalyzes the carboxylation of
acetyl-CoA to malonyl-CoA, the rate-limiting step of fatty acid synthesis. Fasn catalyzes the remaining steps of palmitic acid synthesis. Fasn expression showed a tendency of increase, while Acaca expression significantly increased in fructose-fed rats (Figure 4(c)). Thesefindings are consistent with previous results and clearly indicate increased de novo
lipid synthesis in fructose-fed rats [48, 49]. ELOVL6 enzyme, which catalyzes thefirst and rate-limiting reaction of long- chain fatty acid elongation cycle, was also significantly increased in fructose-fed rats. ELOVL6 enzyme is also known to play an important role in nonalcoholic fatty liver disease and steatohepatitis [50, 51] (Figure 4(h)).
8 6 4 2 Fasting blood glucose (mmol/L) 0
Week 0 Week 4 Week 8 Week 12 Week 16 Week 20 Week 24
⁎ ⁎
⁎ ⁎
Control Fructose-fed
(a)
900
600
300
0 Week 12 Week 16 Week 20 Week 24
OGTT AUC (mmol/L⁎min) ⁎⁎ ⁎
Control Fructose-fed
(b) 50
40 30 20 10 0
HOMA-IR 𝜇U/mL⁎ mmol/L ⁎
Control Fructose-fed
(c)
8 6
4 2 0
Serum insulin (ng/mL)
Control Fructose-fed
(d)
8 6
4 2 0 Pancreatic insulin (pg/mL protein)
⁎
Control Fructose-fed
(e)
Figure2: Prediabetic condition: (a) fasting blood glucose levels, (b) area under the curve (AUC) values for OGTT, (c) HOMA-IR index at week 20, (d) serum insulin level at week 20, and (e) pancreatic insulin level at week 24. Values aremean ± SEM(n= 7‐8),∗p< 0:05.
0 100 200 300 400 500 600
Week 0 Week 4 Week 8 Week 12 Week 16 Week 20 Week 24
Body weight (g)
⁎ ⁎
Control Fructose-fed
(a)
0 30 60 90 120 150 180
Body weight gain (g)
⁎
Control Fructose-fed
(b)
Figure3: Body weight and weight gain of control and fructose-fed rats. Values aremean ± SEM(n= 8),∗p< 0:05.
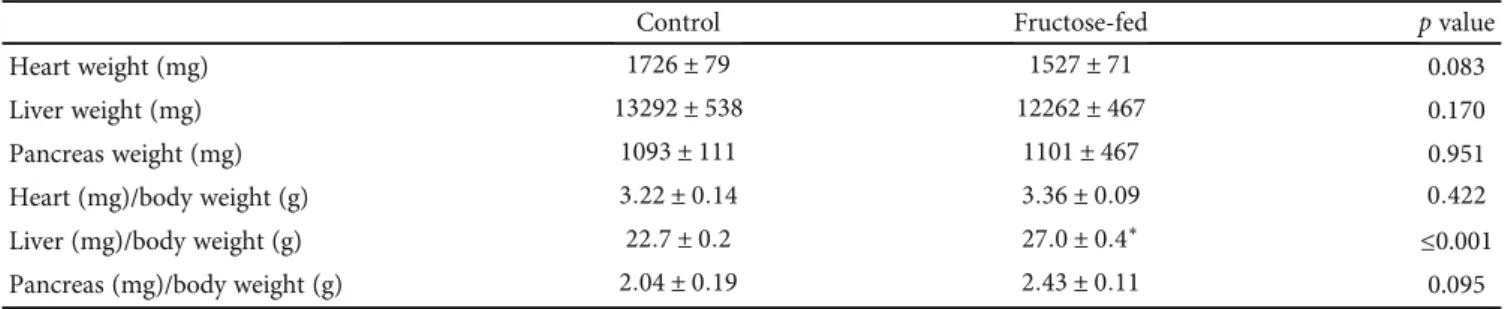
3.2. Heart Function and Morphology. To characterize prediabetes-induced cardiac changes in fructose-fed rats, transthoracic echocardiography was performed at week 24 to investigate cardiac function. Although the weight of the animals was significantly lower in the fructose-fed group, the heart weight and heart weight to body weight ratio were not changed significantly (Table 1).
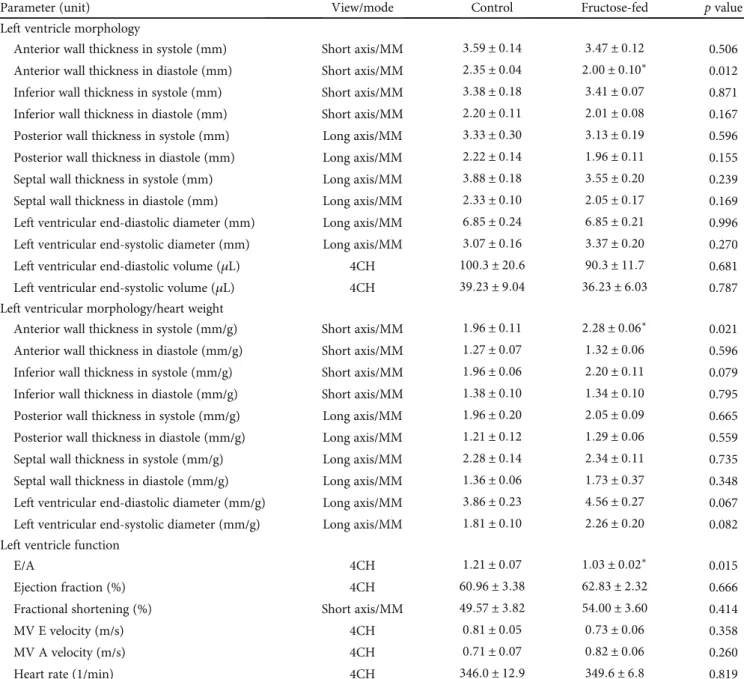
Echocardiographic parameters of morphology and func- tion are shown in Table 3. To exclude the potential effect of variations in cardiac mass, the morphological data were also given after normalization to heart weight (Table 3). Wall thicknesses and ventricular diameters were not changed sig- nificantly due to fructose feeding (except for anterior wall thickness) (Table 3). Although there was no difference in heart rate, ejection fraction, and fractional shortening, the E/A ratio was significantly smaller in fructose-fed rats indi- cating the impairment of diastolic filling (Table 3). These findings may suggest a very early manifestation of a mild hypertrophy and diastolic dysfunction with preserved sys- tolic function in prediabetic rats.
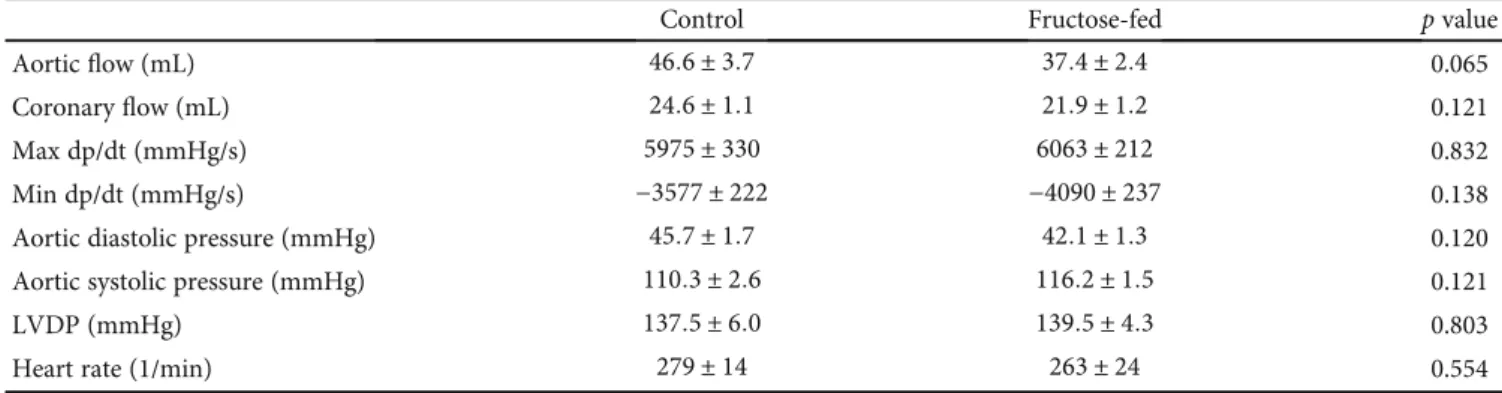
Following echocardiography, the hearts were isolated to assess cardiac performance on a working heart perfusion sys- tem. Left ventricular end-diastolic pressure significantly increased, while cardiac output significantly decreased in fructose-fed rats (Figure 5). However, HR, max and min
dp/dt, LVDP, and aortic systolic and diastolic pressures were not changed between groups during working heart perfusion (Table 4). These results demonstrate the appearance of a mild diastolic dysfunction in prediabetic rats. It is well known that left ventricular hypertrophy is more common in diabetic patients and that 40-75% of patients with type 1 or type 2 diabetes have diastolic dysfunction [52, 53]. How- ever, here we show that the deterioration of diastolic function occurs much earlier than the development of overt diabetes.
These results are consistent with recent reports showing that the development of diastolic dysfunction can precede com- plete diabetes [6].
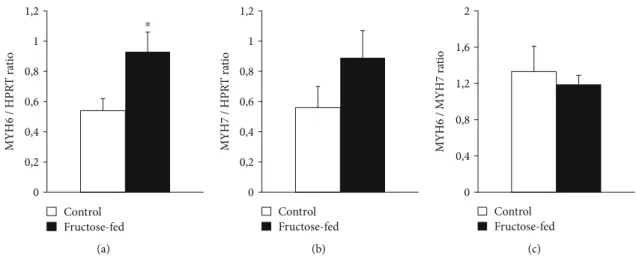
In order to assess cardiac hypertrophy at the molecular level, mRNA expression of myosin heavy chain α isoform (MYH6) and myosin heavy chain βisoform (MYH7) was measured. We have found that cardiac MYH6 mRNA level, consistent with myosin 6 protein level measured by proteo- mics (Table 5), was increased in fructose-fed rats (Figure 6).
However, MYH6/MYH7 ratio did not differ significantly.
According to the literature [54–56], these data do not sup- port cardiac hypertrophy in our fructose-fed rats.
It is known that clinical laboratory markers of myocardial injury are increased in diabetic cardiomyopathy [57] and serum ion parameters, especially potassium, can affect heart function. Therefore, we measured serum ions (potassium, Table1: Isolated organ weights and isolated organ weight to body weight ratios at week 24 in both control and fructose-fed rats. Values are mean ± SEM(n= 8),∗p< 0:05.
Control Fructose-fed pvalue
Heart weight (mg) 1726 ± 79 1527 ± 71 0.083
Liver weight (mg) 13292 ± 538 12262 ± 467 0.170
Pancreas weight (mg) 1093 ± 111 1101 ± 467 0.951
Heart (mg)/body weight (g) 3:22 ± 0:14 3:36 ± 0:09 0:422
Liver (mg)/body weight (g) 22:7 ± 0:2 27:0 ± 0:4∗ ≤0.001
Pancreas (mg)/body weight (g) 2:04 ± 0:19 2:43 ± 0:11 0.095
Table2: Parameters measured in serum collected at week 24 in both control and fructose-fed rats. Values aremean ± SEM(n= 8),∗p< 0:05.
Control Fructose-fed pvalue
Serum triglyceride (mmol/L) 0:96 ± 0:12 0:94 ± 0:20 0.938
Serum cholesterol (mmol/L) 1:78 ± 0:14 1:61 ± 0:11 0.359
LDL (mmol/L) 0:45 ± 0:05 0:43 ± 0:08 0.830
HDL (mmol/L) 0:86 ± 0:08 0:76 ± 0:07 0.335
ALAT (U/L) 38:63 ± 3:35 35:00 ± 4:08 0.500
ASAT (U/L) 77:88 ± 4:05 73:29 ± 5:74 0.517
CK (U/L) 263 ± 46 245 ± 45 0.776
CKMB (U/L) 352 ± 75 256 ± 33 0.264
LDH (U/L) 334:86 ± 63:77 272:50 ± 37:36 0.437
Cl (mmol/L) 102:50 ± 0:78 102:63 ± 0:82 0.914
K (mmol/L) 6:33 ± 0:36 5:95 ± 0:57 0.588
Na (mmol/L) 141:63 ± 0:60 141:38 ± 0:78 0.802
0 0,3 0,6 0,9 1,2
MLXIPL / HPRT
Control Fructose-fed
(a)
0 0,6 0,9 1,2 1,5
SREBF1 / HPRT
0,3
Control Fructose-fed
(b)
0 0,3 0,6 0,9 1,2 1,5
ACACA / HPRT
⁎
Control Fructose-fed
(c)
0 0,3 0,6 0,9 1,2 1,5
FASN / HPRT
Control Fructose-fed
(d)
0 1 2 3 4
SCD1 / HPRT
Control Fructose-fed
(e)
0 0,4 0,8 1,2 1,6
FADS1 / HPRT
Control Fructose-fed
(f)
0 0,4 0,8 1,2 1,6 2
FADS2 / HPRT
Control Fructose-fed
(g)
0 0,3 0,6 0,9 1,2 1,5
ELOVL6 / HPRT
⁎
Control Fructose-fed
(h)
Figure4: qRT-PCR results at week 24. Liver (a) Mlxipl expression, (b) Srebf1 expression, (c) Acaca expression, (d) Fasn expression, (e) SCD1 expression, (f) Fads1 expression, (g) Fads2 expression, and (h) ELOVL6 expression. Values aremean ± SEM(n= 6‐7),∗p< 0:05.
sodium, and chloride) and enzyme markers of myocardial injury (creatine kinase (CK), creatine kinase-MB (CK-MB), and lactate dehydrogenase (LDH)). Neither serum ion parameters nor markers of myocardial injury were changed significantly in fructose-fed rats compared to controls (Table 2).
3.3. Lipidomics.To characterize and elucidate the metabolic changes in the prediabetic heart induced by chronically applied fructose-rich diet, we performed high-performance, comprehensive shotgun MS-based lipidomic analyses from left ventricular whole membrane extracts. We have identified and quantified approximately 200 lipid molecular species encompassing 20 lipid classes (lipidomic data are summa-
rized in Supplementary Lipid Table expressed either as lipid/protein or as mol% of membrane lipids or mol% of a given lipid class). Because the optimal physical state of the membrane is a prerequisite for proper functioning, in the fol- lowing, we focus on membrane lipid compositional data. To obtain an overview, mol% of membrane lipid values was sub- jected to the nonsupervised multivariate statistics principal component analysis (PCA). The clear separation of the sam- ple sets into two nonoverlapping clusters (Figure 7) indicates complex reshaping and metabolic rewiring of the whole lipi- dome due to fructose feeding. Examining these alterations in more detail and comparing the molecular species patterns for the control and fructose groups revealed 100 statistically sig- nificant differences (Supplementary Lipid Table).
Table3: Left ventricular morphological and functional parameters examined by echocardiography at week 24 in both control and fructose- fed rats. Values aremean ± SEM(n= 8),∗p< 0:05.
Parameter (unit) View/mode Control Fructose-fed pvalue
Left ventricle morphology
Anterior wall thickness in systole (mm) Short axis/MM 3:59 ± 0:14 3:47 ± 0:12 0.506 Anterior wall thickness in diastole (mm) Short axis/MM 2:35 ± 0:04 2:00 ± 0:10∗ 0.012 Inferior wall thickness in systole (mm) Short axis/MM 3:38 ± 0:18 3:41 ± 0:07 0.871 Inferior wall thickness in diastole (mm) Short axis/MM 2:20 ± 0:11 2:01 ± 0:08 0.167 Posterior wall thickness in systole (mm) Long axis/MM 3:33 ± 0:30 3:13 ± 0:19 0.596 Posterior wall thickness in diastole (mm) Long axis/MM 2:22 ± 0:14 1:96 ± 0:11 0.155
Septal wall thickness in systole (mm) Long axis/MM 3:88 ± 0:18 3:55 ± 0:20 0.239
Septal wall thickness in diastole (mm) Long axis/MM 2:33 ± 0:10 2:05 ± 0:17 0.169 Left ventricular end-diastolic diameter (mm) Long axis/MM 6:85 ± 0:24 6:85 ± 0:21 0.996 Left ventricular end-systolic diameter (mm) Long axis/MM 3:07 ± 0:16 3:37 ± 0:20 0.270
Left ventricular end-diastolic volume (μL) 4CH 100:3 ± 20:6 90:3 ± 11:7 0.681
Left ventricular end-systolic volume (μL) 4CH 39:23 ± 9:04 36:23 ± 6:03 0.787 Left ventricular morphology/heart weight
Anterior wall thickness in systole (mm/g) Short axis/MM 1:96 ± 0:11 2:28 ± 0:06∗ 0.021 Anterior wall thickness in diastole (mm/g) Short axis/MM 1:27 ± 0:07 1:32 ± 0:06 0.596 Inferior wall thickness in systole (mm/g) Short axis/MM 1:96 ± 0:06 2:20 ± 0:11 0.079 Inferior wall thickness in diastole (mm/g) Short axis/MM 1:38 ± 0:10 1:34 ± 0:10 0.795 Posterior wall thickness in systole (mm/g) Long axis/MM 1:96 ± 0:20 2:05 ± 0:09 0.665 Posterior wall thickness in diastole (mm/g) Long axis/MM 1:21 ± 0:12 1:29 ± 0:06 0.559 Septal wall thickness in systole (mm/g) Long axis/MM 2:28 ± 0:14 2:34 ± 0:11 0.735 Septal wall thickness in diastole (mm/g) Long axis/MM 1:36 ± 0:06 1:73 ± 0:37 0.348 Left ventricular end-diastolic diameter (mm/g) Long axis/MM 3:86 ± 0:23 4:56 ± 0:27 0.067 Left ventricular end-systolic diameter (mm/g) Long axis/MM 1:81 ± 0:10 2:26 ± 0:20 0.082 Left ventricle function
E/A 4CH 1:21 ± 0:07 1:03 ± 0:02∗ 0.015
Ejection fraction (%) 4CH 60:96 ± 3:38 62:83 ± 2:32 0.666
Fractional shortening (%) Short axis/MM 49:57 ± 3:82 54:00 ± 3:60 0.414
MV E velocity (m/s) 4CH 0:81 ± 0:05 0:73 ± 0:06 0.358
MV A velocity (m/s) 4CH 0:71 ± 0:07 0:82 ± 0:06 0.260
Heart rate (1/min) 4CH 346:0 ± 12:9 349:6 ± 6:8 0.819
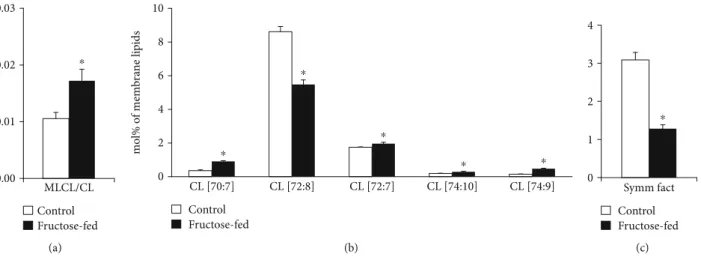
One of the most noteworthy changes can be connected to the CL remodeling system. It is known that under normal conditions, the levels of LPLs are kept low in general, and CL remodeling requires only trace amounts of MLCL [14].
Therefore, the significantly lowered level of matured CL in parallel with the significantly increased amount of MLCL (Supplementary Lipid Table), and consequently their markedly increased ratio in the membrane (MLCL/CL, Figure 8(a)), obviously report about an aberrant remodeling
process in the fructose-fed group as compared to the con- trols. The ratio of MLCL/CL was found to be a more sensitive indicator than the level changes of CL and MLCL in Barth patients [58]. Furthermore, at the molecular species level, we detected pronounced loss of the most abundant homo- symmetric tetra18:2 species CL(72:8) (Figure 8(b)).
This was the most prominent change not only in the context of membrane composition but also when considering absolute values, i.e., the protein-normalized data displayed
0 3 6 9 12 15 18
LVEDP (mmHg)
⁎
Control Fructose-fed
(a)
⁎
0 20 40 60 80
Cardiac output (mL/min)
Control Fructose-fed
(b)
Figure5: Cardiac function in isolated perfused hearts: (a) left ventricular end-diastolic pressure (LVEDP) and (b) cardiac output. Values are mean ± SEM(n= 7‐8),∗p< 0:05.
Table4: Parameters measured by working heart perfusion at week 24 in both control and fructose-fed rats. Values aremean ± SEM(n= 7‐8).
Control Fructose-fed pvalue
Aorticflow (mL) 46:6 ± 3:7 37:4 ± 2:4 0.065
Coronaryflow (mL) 24:6 ± 1:1 21:9 ± 1:2 0.121
Max dp/dt (mmHg/s) 5975 ± 330 6063 ± 212 0.832
Min dp/dt (mmHg/s) −3577 ± 222 −4090 ± 237 0.138
Aortic diastolic pressure (mmHg) 45:7 ± 1:7 42:1 ± 1:3 0.120
Aortic systolic pressure (mmHg) 110:3 ± 2:6 116:2 ± 1:5 0.121
LVDP (mmHg) 137:5 ± 6:0 139:5 ± 4:3 0.803
Heart rate (1/min) 279 ± 14 263 ± 24 0.554
Table5: Alteration of selected cardiac proteins in fructose-fed rats by proteomic analysis. Values are expressed as fold change andpvalue.
Protein names Gene names Fold change pvalue
Alpha B crystallin Cryab 5.56 0.047
3-ketoacyl-CoA thiolase (mitochondrial) Acaa2 4.56 0.005
Alpha-aminoadipic semialdehyde dehydrogenase Aldh7a1 4.34 ≤0.001
60 kDa heat shock protein (mitochondrial) Hspd1 3.37 0.010
Myosin 6 MYH6 3.06 0.003
Peroxiredoxin-6 Prdx6 2.87 0.001
Superoxide dismutase [Mn] (mitochondrial) Sod2 -1.82 0.033
Protein disulfide-isomerase P4hb -3.40 0.001
dramatic 45% decrease for CL(72:8) (from 28.5 to 15.7 nmol/protein mg;p< 0:05; Supplementary Lipid Table).
This observation is in full agreement with other literature data obtained for either more severe diabetic and obesity models [59, 60] or recorded in a more similar early-stage fructose-induced type 2 diabetes study [61]. The loss in CL(72:8) was paralleled by elevations in practically all other asymmetric species independently on chain length and satu- ration for the fructose-fed animals as opposed to the normal chow diet (sum elevation from 2.82 to 4.35 mol% of mem- brane lipids,p< 0:05) (Figure 8(b)). This altogether resulted
in a dramatic drop of the CL“symmetry”factor in the fruc- tose group calculated as the ratio of symmetric/asymmetric species (Figure 8(c)). The major contributions to the increase in asymmetry derived from species which contain one non- 18:2 acyl chain, i.e., from the 16:1 FA-containing CL(70:7;
16:1_18:2_18:2_18:2) species, from the CL(74:9) species whose major component is the CL(18:2_18:2_18:2_20:3) isobar, and from the CL(72:7) species corresponding to CL(18:1_18:2_18:2_18:2). This is in correspondence with the result observed in a fructose-induced early type 2 diabetic rat model [61] but differs from more severe mouse models of diabetes and insulin resistance/obesity. In the latter cases, defective cardiac CL remodeling resulted in depletion of 16:1 and enrichment of the highly unsaturated docosahexae- noic acid (DHA, 22:6 n-3) [17, 60], thereby essentially increasing the propensity of CL to peroxidation. In our study, the double bond index (DBI) of CL, a measure of unsatura- tion, did not change significantly (Supplementary Lipid Table). It can be partially due to the prediabetic nature of the model but also due to the sizeable difference in cardiac CL species composition between mouse and rat. Mouse cardiac CL contains essentially more DHA [61–63]. There- fore, it is more prone to ROS attack and peroxidation than that of the rat CL. Nevertheless, we have to mention that regarding fold increases of the individual CL species in the fructose-fed animals compared to the controls, the highest, ca. 10-fold elevations, was registered for DHA- containing CL species (78:12, 18:0_18:2-20:4_22:6 (major)) and (78:13, 18:1_18:2_20:4_22:6), although their levels barely reached the 0.1 mol% of total CL value even in the fructose group (Supplementary Lipid Table). It is important to note here that we could not detect oxidized lipid species either in CL or in other highly unsaturated and gener- ally oxidation-prone lipid classes, such as plasmalogen phos- phatidylethanolamine and phosphatidylserine. However, we could detect“asymmetry”defects already in the MLCL spe- cies profile; the major MLCL(54:6, tri18:2) species was found to be significantly reduced whereas the not only 18:2-containing precursors were markedly elevated (Supple- mentary Lipid Figure 2).
0 0,2 0,4 0,6
MYH6 / HPRT ratio
0,8 1
1,2 ⁎
Control Fructose-fed
(a)
MYH7 / HPRT ratio
0 0,2 0,4 0,6 0,8 1 1,2
Control Fructose-fed
(b)
0 0,4 0,8 1,2 1,6 2
MYH6 / MYH7 ratio
Control Fructose-fed
(c)
Figure6: qRT-PCR results at week 24. Heart (a) MYH6 expression, (b) MYH7 expression, and (c) MYH6/MYH7 ratio. Values are means ± SEM(n = 8),∗p< 0:05.
5 0
PC1 -5
–5 0
PC2
5
Fructose-fed Control
Figure7: Principal component analysis (PCA) score plot. MS data expressed as mol% of membrane lipids were centered and normalized. Values for 8 independent experiments are shown for control and fructose-fed samples. Dashed lines display 95%
confidence regions.
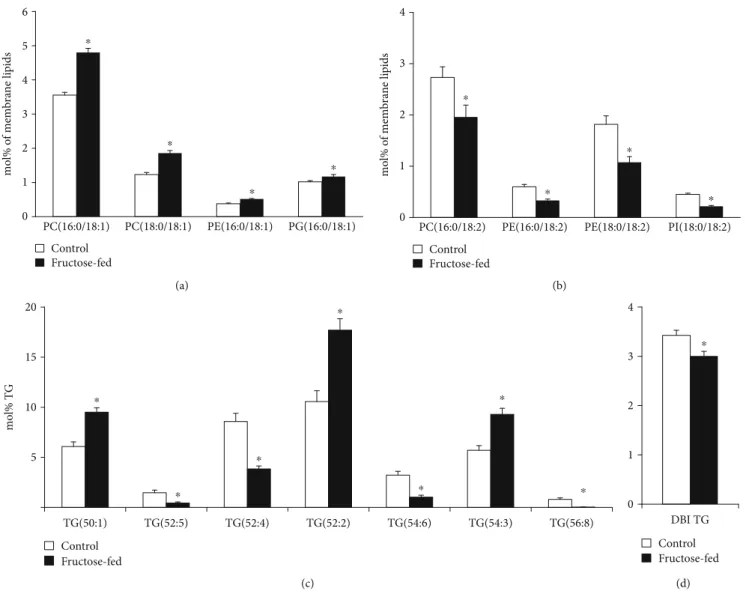
Another important feature of the lipidome alterations was the general increase in lipid species with sum double bondðdbÞ= 1that could be detected in all major membrane PL classes in the fructose group as opposed the control animals (sum ofdb = 1 9:3vs. 6.9 mol% of membrane lipids, p< 0:05; Supplementary Lipid Table). The main contribu- tors, which contain a saturated and a monounsaturated FA leg, were collected in Figure 9(a). PL species withdb = 2pre- dominantly contained a saturated FA insn1and a linoleoyl (18:2) group insn2position of the glycerol backbone; these can serve as potential acyl donors for the formation of tetra18:2 CL for the tafazzin-catalyzed transacylation. In par- allel with the elevation of species withdb = 1, we detected sig- nificant depletion in species with db = 2 in fructose-fed animals (sum ofdb = 2 7:1vs. 9.7 mol% of membrane lipids, p< 0:05; Supplementary Lipid Table); selected species are demonstrated in Figure 9(b).
Changes in PL molecular species with highly unsaturated acyl chains (db≥4) showed fairly complex picture with sev- eral significant alterations including both elevations and decreases (Supplementary Lipid Table). It was reported that the loss of tafazzin enzymatic activity in a Barth syndrome mouse model also resulted in complex alterations of polyun- saturated PL species [64]. Therefore, it is conceivable to sug- gest that the intricate imbalance in polyunsaturated PL species alters the biophysical and signaling properties of the cardiac membrane.
Since we could not detect the elevation in serum triglyc- eride levels due to fructose feeding, it is not surprising that neither the total cardiac TG content changed significantly (Supplementary Lipid Table). However, the prominent spe- cies profile change of the TG pool is worth mentioning.
The robust relative increase in species containing saturated and monounsaturated FAs, such as TG(50:1, 52:2, and 54:3), in parallel with significant reductions in more unsatu- rated species, e.g., TG(52:4, 54:6, and 56:8) (Figure 9(c)) alto- gether led to the decrease of the double bond index (DBI), i.e., increase in saturation for cardiac TG (Figure 9(d)). Car- diac TG saturation together with the monoene increase and
18:2 decrease in membrane PLs may indicate the upregula- tion of DNL leading to a shift in FA profile towards the aug- mentation of monounsaturated 18:1 (and 16:1) FAs.
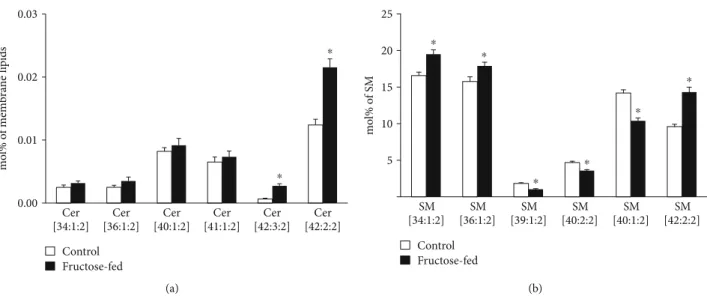
A further interesting aspect of the complex lipidome remodeling was the reshaping of the analyzed sphingolipid (SL) pool, ceramide (Cer) and sphingomyelin (SM). Cer has a central role in SL metabolism as well as it is known as a lipid mediator of the eukaryotic stress response. Its role is mostly associated with growth inhibition; the most studied being its function as a proapoptotic molecule [65]. Serum Cers have emerged as potential biomarkers of insulin resistance, diabe- tes, and heart disease, but also, muscle, liver, or adipose tissue Cers were shown to be associated with insulin resistance [66].
In our study, we measured small but significant elevation in total cardiac Cer at membrane lipid compositional level (approximately 30%;p< 0:05, Supplementary Lipid Table), which could be attributed almost exclusively to the increases in very-long-chain Cer-24 species Cer(42:2:2, d18:1/24:1 and 42:3:2, d18:2/24:1) (Figure 10(a)). It was reported that the nature of the acyl chain in Cers influences their contribution to the disease. Long-chain Cer-16 and Cer-18 often showed stronger associations with disease pathologies than very- long-chain Cer-24 [66]. Marchesini et al. reported that in confluent MCF-7 cells cell cycle arrest but not apoptosis was mediated by C24-Cer species [67]. It seems, therefore, that the alterations in Cer in our model might contribute to the observed cardiac dysfunction through changing the membrane biophysical properties rather than inducing size- able apoptotic signaling. SM is the major structural mamma- lian SL which accumulates in liquid-ordered microdomains.
Its total level showed only an increasing tendency in the membrane (p= 0:058), but its species compositions changed completely (Figure 10(b) and Supplementary Lipid Table).
This may point to microdomain reorganization and hence, again, to the modulation of the membrane physical state and signaling properties due to fructose-rich diet.
Schlame et al. proposed that the acyl specificity of tafaz- zin arises from the physical properties of the lipid environ- ment and is born out of a transacylation equilibrium in
0.00 0.01 0.02 0.03
MLCL/CL
⁎
Control Fructose-fed
(a)
0 2 4 6 8 10
CL [70:7] CL [72:8] CL [72:7] CL [74:10] CL [74:9]
mol% of membrane lipids
⁎
⁎
⁎ ⁎ ⁎
Control Fructose-fed
(b)
0 1 2 3 4
Symm fact
⁎
Control Fructose-fed
(c)
Figure8: Defects in cardiolipin remodeling. (a) Monolysocardiolipin to cardiolipin ratio (MLCL/CL). (b) Changes in CL species due to fructose feeding. (c) CL symmetry factor calculated as the ratio of symmetric/asymmetric CL species. ESI-MS data are expressed as mol%
of membrane lipids or calculated from the corresponding values and presented asmeans ± SEM(n= 8),∗p< 0:05.
which the tissue-specific availability of FAs and the specific packing conditions of lipids are manifested [18]. In line with this proposal, our lipidomic data fully support the distur- bance in tafazzin action in the prediabetic state as the very first event leading to defective CL structural uniformity and molecular symmetry. Nevertheless, several other options may contribute to the observed changes. These include the induction of phospholipase A2, which should increase the level of LPLs. It is known to happen in the diabetic state [68], and the registered increases in the relative levels of car- diac MLCL and LPE (Supplementary Lipid Table) in our pre- diabetic model might also reflect such an upregulation. In addition, the upregulation of the acyl-CoA:lyso-CL-acyl- transferase that lacks preference for the linoleoyl group [69]
as well as the downregulation of MLCL acyltransferase that specifically catalyzes the synthesis of tetra18:2 CL [70] also might play a role. However, these possibilities were reported for harsher conditions of later stage diabetes or well- developed oxidative stress induced by hyperthyroidism.
3.4. Proteomics.The complex changes in the heart detected by lipidomics at the metabolite level in the prediabetic state induced by chronic fructose feeding can be further mapped and complemented by alterations that occur at the protein level. Therefore, we performed comprehensive LC-MS- based proteomic analysis from left ventricular extracts.
Altogether, 1406 proteins were identified with at least two validate peptides from 1D-GE bands of pooled left ventricu- lar samples. Using a spectral library built from those identifi- cations, 802 proteins could be repeatedly quantified in individual samples. Seventy-five different proteins were sig- nificantly changed (p≤0:05 and a minimum of 1.5-fold change) in fructose-fed rats compared to control animals.
Out of these proteins, 49 were upregulated and 26 were downregulated. Gene ontology analysis based on subcellular localization revealed enrichments of proteins with significant changes in different cell compartments including mitochon- dria (n= 27), cytoplasm (n= 32), nucleus (n= 10), extracel- lular space (n= 8), lysosome (n= 3), and Golgi apparatus
0 1 2 3 4 5 6
PC(16:0/18:1) PC(18:0/18:1) PE(16:0/18:1) PG(16:0/18:1)
mol% of membrane lipids
⁎
⁎
⁎
⁎
Control Fructose-fed
(a)
0 1 2 3 4
PC(16:0/18:2) PE(16:0/18:2) PE(18:0/18:2) PI(18:0/18:2)
mol% of membrane lipids
⁎
⁎
⁎
⁎
Control Fructose-fed
(b)
5 10 15 20
TG(50:1) TG(52:5) TG(52:4) TG(52:2) TG(54:6) TG(54:3) TG(56:8)
mol% TG
⁎
⁎
⁎
⁎
⁎
⁎ ⁎
Control Fructose-fed
(c)
0 1 2 3 4
DBI TG
⁎
Control Fructose-fed
(d)
Figure9: Early signs of de novo lipogenesis induction. (a) Changes in phospholipid species with 1 double bond. (b) Changes in phospholipid species with 2 double bonds. (c) Alterations in cardiac triglyceride (TG) species profile due to fructose feeding. (d) The double bond index calculated for TG. PC: phosphatidylcholine; PE: phosphatidylethanolamine; PG: phosphatidylglycerol; PI: phosphatidylinositol. ESI-MS data are expressed as mol% of membrane lipids or mol% of the specified lipid class and presented asmeans ± SEM(n= 8),∗p< 0:05.