Spectral Phase Shift and Residual Angular Dispersion of an Acousto-Optic
Programmable Dispersive Filter
K. Osvay1,*, M. Mero2, Á. Börzsönyi1, A.P. Kovács1, M.P. Kalashnikov3
1 Dept. of Optics and Quantum Electronics, University of Szeged, P. O. Box 406, Szeged 6701, Hungary
2 Research Group on Laser Physics, University of Szeged, Dom ter 9, H-6720 Szeged, Hungary
3 Max Born Institute, Max-Born-Str. 2A, D 12489 Berlin, Germany
Phone: +36 62 54423 Fax: +36 62 544658
E-mail: osvay@physx.u-szeged.hu
Abstract: Spectral phase shift and both types of spectral angular deviation introduced by an acousto-optic programmable dispersive filter (AOPDF) into a femtosecond laser beam at 800 nm have been measured with high precision. With the use of spectrally and spatially resolved interferometry, we have proved experimentally that the AOPDF controls the group delay
dispersion (GDD) and third-order dispersion (TOD) with an accuracy of better than 1% and 3% of the preset values within the range of 10 fs2 – 1000 fs2 and 1000 fs3 – 40000 fs3, respectively. The values of angular deviation and angular dispersion are primarily dependent on the set absolute value of GDD of the AOPDF when it is operating in continuous mode. Besides of a small offset value, there is no added angular dispersion at 0 fs2, while it can increase up to 0.2 µrad/nm at 10000 fs2.
Keywords: acousto-optical devices, laser beams, pulse compression, dispersion (wave), optical filters
1 Introduction
There is an increasing demand for active and precise dispersion control of ultrashort laser pulses. In case of high power femtosecond pulse laser systems based on chirped pulse amplification (CPA), the dispersion introduced by the optical elements has to be compensated at least to the fourth order to obtain high temporal contrast and perfect phase front of the compressed pulses. Active dispersion control is required in such small scale systems, where few cycle energetic pulses are generated for pump-probe measurements, especially quantum control experiments, as well as for efficient generation of cross polarized waves, broadband continuum and high harmonics. Numerous methods and devices have been developed for this purpose. Some are needed to be inserted to the Fourier plane of a pulse stretcher or compressor such as liquid crystal modulators [1, 2], light-induced pulse shapers [3, 4], a thermal slab [5] and deformable mirrors [6, 7].
The most convenient and widespread devices for active control of spectral phase and amplitude of broadband laser pulses are based on diffraction of light on refractive index modulations caused by transverse or longitudinal acoustic waves [8, 9]. Presently available acousto-optic programmable filters (AOPDF) [10] are claimed to be able to adjust the spectral phase up to the fourth or fifth order in the VIS and also in the UV [11, 12]. Although it has been widely used not only for dispersion compensation but also for CEP stabilization [13, 14], and most recently, few-cycle pulse characterization [15], surprisingly enough there has been only one single measurement reported on the accuracy of the induced spectral phase shift of the device. In this measurement, however, the second and third- order dispersion coefficients have been measured with an accuracy of 3% and 10%, respectively [16]. An AOPDF device inherently introduces spectral angular deviation and spatial chirp into the beam, as it has been showed with UV pulses recently [17]. However, it has never been tested systematically whether the diffracted beam is free from residual angular dispersion, although preliminary results were already presented [18].
In this paper we report on the first systematic experiment aiming at the precise dispersion characterization of an AOPDF device. We prove experimentally that an AOPDF device is capable to control the second and third order spectral phase with high accuracy. We also show that the residual angular dispersion depends linearly on the introduced second order dispersion.
2 Angular Dispersion and AOPDF
Angular dispersion can be defined in two different ways, which have been proved theoretically to be equivalent for plane waves [19]. According to the first interpretation [20], angular dispersion describes the wavelength dependence of the angle of propagation direction. Another definition refers to the angle between the phase fronts of different spectral components [21]. Although the phase front description of angular dispersion of real laser (usually Gaussian) beams is more appropriate than the description based on wavelength dependent propagation
directions, the former requires phase retrieval and in general is more difficult to measure.
Upon propagation through an angularly dispersive optical element, the propagation direction of different spectral components of a broadband pulse will depend on wavelength. As is known, this affects the temporal shape and spatial profile in three ways. First, the beam profile may become elongated along the axis of angular dispersion. Second, the spectral content of the beam would also vary along this axis causing spatial chirp. Finally, since the propagation direction of the spectral phase fronts would also differ from each other, the pulse becomes chirped [22].
In a typical AOPDF based on TeO2 or a similar crystal, the acoustic wave propagates slowly compared to light, hence it is assumed to be stationary (Fig. 1) and it acts as a transient grating. The interaction between the incident light and the acoustic wave is described by
kIN+kAO=kDIFF, (1)
where kIN, kAO, and kDIFF are the wave vectors of the incident beam, the acoustic wave, and the diffracted beam, respectively. Upon interaction in the most commonly used TeO2 crystal, the polarization of the diffracted light is rotated from ordinary to extraordinary. On the one hand, since the diffraction angle is a function of the wavelength dependent ordinary and extraordinary refractive indices, the direction of the output beam α is expected to be spectrally deviated, that is
2 2
0 2
dα 1 d α
α(λ) α λ λ ...
dλ 2 dλ
= + ∆ + ∆ + , (2)
where α0, dα/dλ and d2α/dλ2 are the angle deviation, first and second order angular dispersion around the central wavelength λ0, respectively. Note that the spectral deviation can be similarly defined with the use of the angle between the phase fronts. With the use of a broadband acoustic wave, one can match closely the inherent angular dispersion of the first order around the central wavelength of the optical wave. On the other hand, the spatial extension, i.e. the momentary length of the acoustic wave in the crystal depends also on the preset GDD, and by that, the location of the diffraction point of each spectral component. The optical paths of opposing ends of the spectrum are very different, when a high absolute value of GDD is set, but nearly identical (aside from the difference due to material dispersion) for the case of zero GDD. This fact can make one wonder if there is, in addition, a preset GDD dependence in the output angular dispersion.
On the basis of the available public data of an AOPDF (DAZZLER from Fastlite [23]), a TeO2 crystal diffracts the incident beam by approximately 1°
while the non-diffracted beam leaves the device at around 3.6° with respect to the direction of the input beam (see Fig. 1). The rear side angle and the orientation of the optical axis have been chosen to fulfill these requirements for the output angles.
Based on this presumed geometry, the operation of the AOPDF has been modelled with the assumption of Gaussian light waves. The acoustic wave has been considered as a plane wave with its phase fronts parallel to the front side of the crystal. The ray tracing algorithm accounts for linear refractive indices exclusively. Calculations revealed that aside from extreme initial divergence
parameters, the above design compensates for the wedge effect satisfactorily. If the incoming beam is free of angular dispersion, then the diffracted beam exhibits an offset value of -0.3 µrad/nm due to extraordinary propagation, which is negligible in the everyday laboratory practice.
The non-diffracted beam, however, has an angular dispersion around 6.8 µrad/nm. If the incoming beam is not properly set to the designed angle of incidence, the angular dispersion of the diffracted beam increases by 13 µrad/nm per every degree of incident angle misalignment. This can be eliminated by adjusting the angles of the AOPDF through its calibration process.
3 Experimental
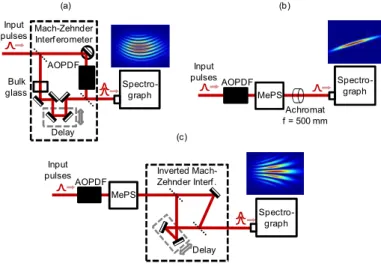
In the course of the experiment three independent measurements have been carried out (Fig. 2). In addition to spectral phase dispersion, we have measured angular deviation and both types of angular dispersion separately.
The spectral phase shift of the AOPDF device has been measured by spectrally and spatially resolved interferometer (SSRI), which is an especially powerful tool to determine small dispersion values with high accuracy [24]. The SSRI setup (Fig. 2.a) consists of a Mach-Zehnder interferometer with the AOPDF in the sample arm and an imaging spectrograph (CEO-2D-800 from CE Optics [25]).
Since the polarization of the diffracted beam emerging from the AOPDF is perpendicular to that of the input beam, a twisted periscope has been inserted to rotate the polarization prior to the AOPDF. In order to compensate for the dispersion of the long TeO2 crystal of the AOPDF device, bulk glasses have been introduced into the reference arm of the Mach-Zehnder interferometer. The interfering pulses have been then directed to the slit of the spectrograph. From the captured interferograms, the relative spectral phase between the arms can be obtained directly [24].
For both the angular deviation and angular dispersion measurements, a Mechanical Polarization Switch (MePS) [25] has been used to flip the beam very fast and easily between vertical and horizontal polarization planes without changing the optical pathlength (Fig. 2b and 2c). For determination of the propagation direction angular dispersion, an achromat (f = 500 mm) has been inserted into the beam (Fig. 2b). The beam is focused onto the slit of the imaging spectrograph. Once the beam is angularly dispersed, different spectral components are focused at different positions along the axis of the slit. Consequently, the imaging spectrograph shows a tilted spectrum where the angle of tilt is linearly proportional to the angular dispersion [26]. The angular deviation α0 has been obtained along the other direction from the horizontal displacement of the entire tilted spectrum.
In the last experiment, the setup has been modified to determine the phase front angular dispersion: the achromat has been replaced by an Inverted Mach-Zehnder Interferometer (PhADIM) [25]. The interferometer creates an interference pattern from the beam and its replica having exactly the inverse angular dispersion [27, 28]. The interference pattern is resolved spectrally and captured by the imaging spectrograph. The spectral dependence of the angular deviation can be derived from the modulation of the frequency of the SSRI fringes.
In the experiments, two Dazzler devices have been tested. One was manufactured in 2003, while the other in 2008.
4 Results
4.1 Spectral phase shift
The spectral phase shift of the AOPDF has been measured with the use of femtosecond pulses from the front end [29] of a high power laser system based on negatively and positively stretched pulse amplification (NPCPA [30]) operating at 50-Hz repetition rate. The bandwidth of the negatively stretched, 10-ps, sub-mJ pulses at the 10% intensity level was almost 100 nm, which enabled high precision measurement for us [24]. At a constant GD set at 2000 fs, the values of GDD and TOD were set independently of each other, keeping only one of the dispersion orders different from zero. GDD values were set from 2 fs2 to 1000 fs2, while TOD was varied between 1000 fs3 and 40000 fs3. The permanent spectral phase shift of the sample pulses introduced by the materials, especially the TeO2
crystal and the beamsplitters, has been fully compensated by inserting series of bulk fused silica and glass plates into the reference arm, so that we obtained the spectral phase shift related to the acoustic interaction exclusively. The measured dispersion values were within 1% and 3% for GDD and TOD, respectively (Fig. 3). It is important to emphasize that this error is actually within the accuracy of the SSRI method [24], so one can conclude that the AOPDF device controls the dispersion values with high precision.
4.2 Angular deviation and angular dispersion
The measurement of the angular deviation relative to the input direction as well as the angular dispersion have been performed using three different kinds of beam as a function of various set parameter values of the AOPDF. The first one was the direct beam from the oscillator of the system, which has a repetition rate of 70.5 MHz and the 10% bandwidth is 140 nm. The second one is still the oscillator beam but after a negative dispersion stretcher, while the third one is the beam propagating from the amplifier described above. Each beam has been examined along both their vertical and horizontal planes.
All of the possible variables of the AOPDF have been changed, including the bandwidth and the central wavelength of the opto-acoustic interaction, and of course, the spectral phase shift via its coefficients (like GD, GDD, TOD, …) to be printed to the optical wave. As a thumb of rule, prior to data collection we found necessary to allow about 30 minutes for thermalization of the AOPDF head. In agreement with the results shown by McCabe et al. [17], we find no change in spectral angular deviation upon tuning GD, as it effects only the position of the diffraction within the crystal, but not the angle of diffraction of the spectral components.
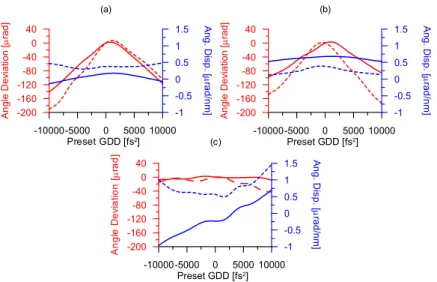
The modification of GDD, however, resulted in a consistent change in the angular properties of the beam (Fig. 4). Here, the horizontal axis corresponds to the diffraction plane of the crystal, while no diffraction effect is assumed along the vertical axis. The sign of the angular deviation and angular dispersion values is defined by the setup and the evaluation procedure [24], that is, the negative and positive signs are to be meant relative. The magnitude of the absolute value of the angular dispersion is in the expected range, which is determined by the accuracy
of the angles between crystal surfaces and the actual design of the wedge.
However, both the angular deviation and the angular dispersion values show a V shaped dependence on GDD between -10000 fs2 and 10000 fs2, when the oscillator beam has been used. For the amplified beam, the beam suffers no angular deviation, while the angular dispersion becomes linearly dependent on the set value of GDD in the plane of diffraction. The angular dispersion along the other plane starts correlating to the set dispersion values towards the positive GDD values, that is, where the duration of the negatively stretched pulses is shortened. Meanwhile, both the phase front and propagation direction angular dispersion measurements have provided practically the same results. Similar results have been obtained when we studied the other AOPDF.
5 Discussion
As it has been pointed out above, diffraction of collimated beams cannot explain the experimental results in Fig. 4. Regarding the behaviour of the oscillator beams, it can be ultimately attributed to thermal effects. Namely, the AOPDF operates in such a way that the extent of the acoustic wave inside the crystal depends on primarily the measure of GDD: the larger the set GDD, the longer the acoustic wave. The diffraction efficiency is also a function of the interaction length of the acoustic and the optical waves, as well as the amplitude of the acoustic wave, i.e. the acoustic power. In the so-called triggered mode, the level of acoustic power and the set GDD (i.e. the length of the acoustic wave) can be freely chosen. In contrast, in the so-called continuous mode, (when acoustic waves are generated continuously), the highest acoustic power set automatically by the AOPDF controller depends also on the set GDD (Fig. 5) in order to prevent damage to the acoustic crystal and the transducer. Therefore, the measurement data have been effected by the acoustic power and the crystal volume it is dissipated.
In the oscillator measurements, the AOPDF has been used in continuous mode, so that the higher the preset GDD, the more acoustic power is dissipated in the smallest volume in crystal. The emerging thermal gradient then results in both angular deviation and angular dispersion (Fig. 4). It is worth noting that the angular dispersion might seem to depend on the acoustic power (Fig. 6), but the rate wich is certainly within the accuracy of the measurement .
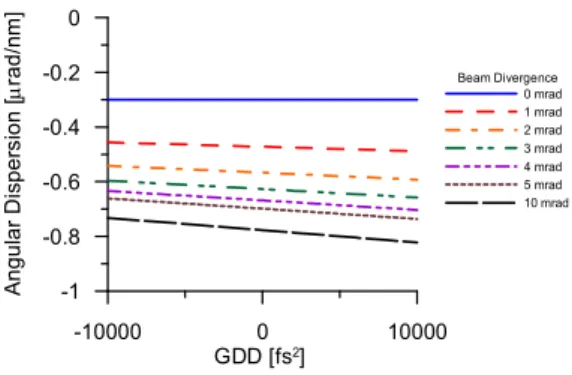
In the case of the amplified beam, the AOPDF has been used in a triggered mode at 50 Hz, so the dissipated power is negligible. The angular deviation hence flattens out around zero µrad (Fig. 4.c). A possible reason for the high values of angular dispersion is that for Gaussian waves the beam divergence may become an issue. A ray with an inappropriate incident angle will have a deflected diffraction angle compared to the designed one. Figure 7 shows the model results for the GDD dependence of the angular dispersion of beams with extreme divergences. As it can be seen, the linear slope increases with the beam divergence as well as with GDD. Since the plotted divergence values are rather high for practical beams, especially when treated with AOPDF device; it is safe to say that this effect can be neglected. Hence, the considerable angular dispersion in the case of amplified beam may be attributed to the nonlinear effects (such as self- phase modulation) caused by the intense laser beam (∼0.5 GW/cm2) in the TeO2
crystal.
The possible reason of the fact that the amplified beam suffers from angular dispersion also in the perpendicular direction towards the higher positive values of the set GDD may be due to inhomogeneity of the nonlinear interaction across the beam. That is, since the beam diameter was as large as it completely filled the aperture of the AOPDF device, any tiny inhomogeneity in the crystal or in the intensity distribution of the beam would result in a gradient of the induced nonlinear refractive index, which in turn behaves like a small but intensity – i.e.
set GDD – dependent tiny optical wedge.
6 Summary
We have measured the spectral phase shift and angular dispersion of an acousto- optic programmable dispersive filter. The measured values of the spectral phase shift are in excellent agreement with the preset ones. When operating at high average acoustic power, the angular deviation and angular dispersion were found to vary with GDD, possibly due to thermal gradient effects caused by the dissipated acoustic power. In low repetition rate triggered mode, however, this effect does not play any role. In all cases, the angular dispersion has a non-zero offset value, but it is barely measurable and practically negligible in almost every case of use.
Acknowledgements
This work was supported by the Hungarian Scientific Research Found (OTKA) under grant No OTKA K75149, the European Union and co-funded by the European Social Fund through the TÁMOP 4.2.2/B-10/1-2010-0012 grant.
Support from the Access to Research Infrastructures activity of EU FP6 (contract RII3-CT- 2003-506350, Laserlab Europe) for conducting the research is also acknowledged gratefully.
References
[1] A.M. Weiner, Rev. Sci. Instrum. 71, 1929-1960 (2000).
[2] J.C. Vaughan, T. Feurer, K.W. Stone, K.A. Nelson, Opt. Express 14, 1314-1328 (2006).
[3] C. Dorrer, F. Salin, F. Verluise, J.P. Huignard, Opt. Lett. 23, 709-711 (1998).
[4] F.M. Reinert, M. Nick, W. Lüthy, T. Feurer, Opt. Express 15, 4372-4377 (2007).
[5] K.Osvay, K. Varju, G. Kurdi, Appl.Phys.B 89, 565-572 (2007).
[6] F. Druon, G. Cheriaux, J. Faure, J. Nees, M. Nantel, A. Maksimchuk, G. Mourou, J.C.
Chanteloup, G. Vdovin, Opt. Lett. 23, 1043-1045 (1998).
[7] E. Zeek, K. Maginnis, S. Backus, U. Russek, M. Murname, G. Mourou, H. Kapteyn, G.
Vdovin, Opt. Lett. 24, 493-495 (1999).
[8] F. Verluise, V. Laude, Z. Cheng, C. Spielmann, P. Tournois, Opt. Lett. 25, 575-577 (2000).
[9] P.Maak, G. Kurdi, A. Barócsi, K. Osvay, A.P. Kovács, L. Jakab, P. Richter, Appl.Phys.B 82, 283-287 (2006).
[10] P. Tournois, “Device for Controlling Light Pulses by a Programmable Acoustooptic Device,” US Patent 6072813 (2000).
[11] N. Krebs, R.A. Probst, E. Riedle, Opt. Express 18, 6164-6171 (2010).
[12] S. Weber, M. Barthélemy, B. Chatel, Appl. Phys. B 98, 323-326 (2010).
[13] S. Koke, C. Grebing, H. Frei, A. Anderson, A. Assion, G. Steinmeyer, Nature Photonics 4, 462-465 (2010).
[14] L. Canova, X. Chen, A. Trisorio, A. Jullien, A. Assion, G. Tempea, N. Forget, T.
Oksenhendler, R. Lopez-Martens, Optics Lett. 34, 1333-1335 (2009).
[15] S. L. Cousin, N. Forget, A. Grün, P. K. Bates, D. R. Austin, J. Biegert, Opt. Lett. 36, 2803-2805 (2011).
[16] T. Oksenhendler, P. Rosseau, R. Herzog, O. Gobert, M. Pendrix, P. Meynadier, “20 Hz Femtosecond Laser Amplifier Optimization Using an AOPDF Pulse Shaper and a SPIDER,” CLEO 2003, Baltimore, MD, USA, 2003, paper CWE1.
[17] 17. D. J. McCabe, D. R. Austin, A. Tajalli, S. Weber, I. A. Walmsley, B. Chatel, J. Opt.
Soc. Am. B 28, 58-64 (2011).
[18] A. Börzsönyi, M. Mero, A. P. Kovács, M. P. Kalashnikov, K. Osvay, “Measurement Of The Spectral Phase Shift And The Residual Angular Dispersion Of An AOPDF,” AIP Conference series, Light at Extreme Intensities 2009, D. Dumitras, ed. (Brasov, 2010), Vol. 1228, pp. 138–143.
[19] K. Varjú, A.P. Kovács, K. Osvay, G. Kurdi: Opt. Lett. 27, 2034-2036 (2002).
[20] F. A. Jenkins and H. A. White, “Fundamentals of Optics”, 4th ed. (McGraw-Hill, New York, 1976)
[21] M. Born and E. Wolf, “Principles of Optics”, 6th ed. (Pergamon,Oxford, 1980).
[22] J.C. Diels, W. Rudolph, “Ultrashort Laser Pulse Phenomena,” 2nd ed. (Springer, 2005).
[23] http://www.fastlite.com/en/
[24] A.Börzsönyi, A.P.Kovács, M.Görbe, K.Osvay, Optics Communications 281, 3051-3061 (2008).
[25] http://www.ceoptics.hu/
[26] K. Osvay, A.P. Kovács, Z. Heiner, G. Kurdi, J. Klebniczki, M. Csatári, IEEE J.Sel.Top.Quant.Electr. 10 213 (2004).
[27] J. Pretzler, A. Kasper, K.J. Witte, Appl. Phys. B 70, 1-9 (2000).
[28] K. Varjú, A.P. Kovács, G. Kurdi, K. Osvay, Appl. Phys. B 74, S259-S263 (2002).
[29] M.P.Kalashnikov, K. Osvay, H.Schönnagel, R.Volkov, W. Sandner, “High Temporal Contrast Front End with a multipass Ti:Sa amplifier and a CaF2-based XPW temporal filter,” CLEO 2011, Baltimore, MD, USA, 2011, paper CWG3.
[30] M.P. Kalashnikov, K. Osvay, I.M. Lachko, H. Schönnagel, W.Sandner, Appl.Phys.B 81 (2005) 1059-1062
Figures
Broadband input beam
Diffracted rays
Ordinary rays
3.6˚
1˚
2.92˚
ω1
ω3
Chirped acoustic wave
ω2
Diffraction planes for different frequencies:ω1,ω2, ω3
(Positions depend on preset GDD of acoustic wave.)
Fig. 1. Stipulated geometrical model of an AOPDF device. (The angles are exaggerated for ease of illustration.)
Input pulses
Achromat f = 500 mm
Spectro- graph
(a) (b)
(c)
AOPDF
Delay Input
pulses
MePS
Spectro- graph Inverted Mach-
Zehnder Interf . Spectro-
graph AOPDF
Delay Input
pulses Mach-Zehnder Interf erometer
Bulk glass
AOPDF MePS
Fig. 2. Experimental setups for measuring spectral phase shift (a), angular dispersion by propagation direction approach (b) and phase front approach (c) caused by an AOPDF.
1 10 100 1000
Preset GDD [fs2] 1
10 100 1000
Measured GDD [fs2]
1x10³ 1x10⁴ 1x10⁵
Preset TOD [fs3] 1x10³
1x10⁴ 1x10⁵
Measured TOD [fs3]
(a) (b)
Fig. 3. Results of the spectral phase measurement compared to the preset GDD and TOD values.
-10000-5000 0 5000 10000 Preset GDD [fs2] -200
-160 -120 -80 -40 0 40
Angle Deviation [µrad]
-1 -0.5 0 0.5 1 1.5 Ang. Disp. [µrad/nm]
-10000-5000 0 5000 10000 Preset GDD [fs2] -200
-160 -120 -80 -40 0 40
Angle Deviation [µrad]
-1 -0.5 0 0.5 1 1.5 Ang. Disp. [µrad/nm]
-10000-5000 0 5000 10000 Preset GDD [fs2] -200
-160 -120 -80 -40 0 40
Angle Deviation [µrad]
-1 -0.5 0 0.5 1 1.5 Ang. Disp. [µrad/nm]
(a) (b)
(c)
Fig. 4. Measured angular deviation (red lines) and angular dispersion (blue lines) at 800 nm as a function of the preset GDD of the AOPDF device for unstretched (a), for negatively stretched laser pulses from the oscillator (b) and for negatively stretched, amplified pulses (c). Solid line: in the plane of diffraction. Dashed line: perpendicular direction to the plane of diffraction.
-20000 -10000 0 10000 20000 GDD [fs2]
0 20 40 60 80 100
Max. Relative Power [%]
Fig. 5. Dependence of the highest allowed acoustic power on the set GDD.
0 20 40 60 80 100
Relative Power [%]
0.84 0.86 0.88 0.9 0.92
Angular Dispersion [µrad/nm]
Fig. 6. Dependence of angular dispersion on the acoustic power in continous mode operation. The preset value of GDD is -2000 fs2.
-10000 0 10000 GDD [fs2]
-1 -0.8 -0.6 -0.4 -0.2 0
Angular Dispersion [µrad/nm]
Beam Divergence 0 mrad 1 mrad 2 mrad 3 mrad 4 mrad 5 mrad 10 mrad
Fig. 7. Calculated angular dispersion versus the preset GDD at different beam divergences.