Generation of high-order harmonics with tunable photon energy and spectral width using double pulses
Lénárd Gulyás Oldal ,1,*Tamás Csizmadia,1Peng Ye,1Nandiga Gopalakrishna Harshitha ,1,†Amelle Zaïr,1,2 Subhendu Kahaly ,1Katalin Varjú,1Miklós Füle,1and Balázs Major 1
1ELI-ALPS, ELI-HU Non-Profit Ltd., Wolfgang Sandner utca 3., H-6728 Szeged, Hungary
2King’s College London, Attosecond Physics Group, Department of Physics WC2R 2LS London, United Kingdom
(Received 27 March 2020; accepted 12 June 2020; published 6 July 2020)
This work theoretically investigates high-order harmonic generation in rare-gas atoms driven by two tem- porally delayed ultrashort laser pulses. Apart from their temporal delay, the two pulses are identical. Using a single-atom model of the laser-matter interaction it is shown that the photon energy of the generated harmonics is controllable within the range of one eV—a bandwidth comparable to the photon energy of the fundamental field—by varying the time delay between the generating laser pulses. It is also demonstrated that high-order harmonics generated by double pulses have advantageous characteristics, which mimick certain properties of an extreme ultraviolet monochromator. With the proposed method, a simpler setup at a much lower cost and comparatively higher spectral yield can be implemented in contrast to other approaches.
DOI:10.1103/PhysRevA.102.013504
I. INTRODUCTION
High harmonic generation (HHG) in gaseous medium is one of the most widely employed methods to generate coher- ent radiation in the extreme ultraviolet (XUV) and soft-x-ray regions [1–4]. The process occurring in the interaction of a short laser pulse and a single atom can be described by the semiclassical three-step model [5]. First, an electron becomes free by tunneling through the Coulomb potential barrier of the atomic core, which is distorted by the driving laser field.
Secondly, the electron wave packet gains energy from the strong laser field during its motion in the continuum. Finally, it recombines with its parent ion and gets rid of the excess energy by releasing an energetic XUV photon. This process can take place in every half cycle of the laser field, if the electric field is strong enough to free the electron. Nowadays, HHG is usually driven by state-of-the-art laser systems [6]
in order to reach a higher flux of the emitted photons [7], a broader photon energy range of the generated harmonics [8], or to obtain an unprecedented time resolution of a few tens of attoseconds [9]; achievements which have already enabled numerous applications [10,11]. These characteristics are strongly influenced by the driving electric field, because strong-field electron dynamics is intricately linked with the time evolution of the driving laser.
Several theoretical and experimental studies have been carried out using temporally modulated laser fields as seeding sources of HHG to analyze the effect of the temporal evolution of the laser electric field on the HHG process [12–14]. One possible advantage of using a modulated driving field is to
*lenard.gulyas@eli-alps.hu
†Present address: Friedrich Schiller Universität, Institut für Optik und Quantenelektronik, Jena, Germany.
extend the cutoff on the single-atom level [14]. Furthermore, by varying the spectral chirp of the laser pulses, the photon energy of the generated high-order harmonics is finely con- trollable in a specific spectral range [15–17]. There were also successful attempts to generate harmonics by using laser field in combination with a static field, which results in the breaking of the inversion symmetry [18–20]. Application of such a combined field leads to a multiplateau harmonic structure [19,20]. The main goal of the above-mentioned techniques is to shape the harmonic spectrum by controlling the electron quantum paths during the HHG process via the manipulation of the driving electric field [21]. Although special pulse shapes (trapezoidal, squarelike, etc.) could provide ways to shape or tune the generated harmonics [12], nevertheless these pulse shapes are difficult to produce experimentally.
In addition to the methods that vary the time evolution of the driving field, another experimentally feasible technique to produce laser pulses with unconventional time evolution involves the use of broadband pulses and time delay between the short- and long-wavelength region of their spectrum [22].
In this way, double pulses can be generated with slightly different central wavelengths. Furthermore, a double-pulse structure can be achieved by interfering two ultrashort laser pulses of the same color. The HHG cutoff can be significantly extended if a carrier envelope phase (CEP) difference ofπ is introduced between the constituting pulses and one of them is shifted by a half cycle [23]. Moreover, if the time delay is changed between the pulses, a variety of time evolutions can be introduced when the composing pulses of the produced structure have the same CEP. Although experimental imple- mentation of double-pulse structures is relatively easier, their characterization has inherent issues with most of the well- known pulse characterization techniques, such as spectral phase interferometry for direct electric-field reconstruction (SPIDER) [24] or frequency-resolved optical gating (FROG)
[25]. However, procedures have already been developed to measure the temporal shape of double pulses, like the very advanced method for phase and intensity retrieval of e-fields (VAMPIRE) method [26] or the recently demonstrated im- proved self-referenced spectral interferometry (SRSI) algo- rithm [27].
This work presents theoretical investigations of high har- monic generation in gaseous medium driven by a double-pulse structure. The composing pulses have the same spectrum, spectral phase, and absolute CEP, while the control over the temporal evolution of the electric field is reached by changing the delay between them. Holzneret al.[28] proposed and realized a protocol to employ double pulses for HHG attosecond control. In our work we focus on exploring how the double-pulse structure can be successfully employed to tune the harmonics central frequency.
The manuscript is structured as follows. Section II de- scribes the theoretical model and the calculation methods used in this work. The results obtained are summarized in Sec.III, where the impact of the modulated electric field of double pulses on HHG is discussed. Section IV presents the main conclusions.
II. THEORETICAL BACKGROUND A. Theoretical model
The interaction of a hydrogenlike atom and a strong elec- tric field can be described by the time-dependent Schrödinger equation (TDSE) [29–32]. With the introduction of the atomic units and the use of the length gauge, the TDSE has the following form:
i∂ψ(r,t)
∂t =
−1
2∇2+V(r)+rE(t)
ψ(r,t), (1) where E(t) andV(r) represent the time-dependent linearly polarized electric field and the atomic potential, respectively.
ψ(r,t) denotes the electron wave function, where r is the position vector. To determine the solutions of Eq. (1) the following assumptions can be made: (i) the contribution of all excited states can be neglected, (ii) the population depletion of the ground state is negligible, and (iii) the electron in the continuum can move like a free particle. By applying these approximations [collectively called strong field approxima- tion (SFA) [31]], the time-dependent dipole moment can be calculated as
x(t)=i t
−∞dt
d3pd∗[ ¯p+A(t)]e−iS(p,t,t)
×E(t)d[p+A(t)]+c.c., (2) where p represents the canonical momentum. The notation c.c. indicates the complex conjugate of the preceding expres- sion. The expressiond(p) is the atomic dipole matrix element, which can be expressed as
d(p)=i
1
πα (3/4)
p
αe(−p2/2α), (3) withα=Ip, whereIpis the ionization potential of the target atom. A(t) denotes the vector potential of the driving laser pulse. S(p,t,t) is the quasiclassical action, which has the
following form:
S(p,t,t)= t
t
dt
[p+A(t)]2
2 +Ip
. (4) The dipole spectrumx(ωh) can be calculated by the Fourier transform of Eq. (2), giving
x(ωh)=
∞
−∞dt t
−∞dt
d3pd∗[p+A(t)]
×e[iωht−iS(p,t,t)]E(t)d[p+A(t)]+c.c. (5) The expression above is called Lewenstein integral [29], which can be used to obtain the spectrum of the generated harmonic field. This is a standard for calculating the nonlinear response of single atoms. The solution of TDSE includes internal transitions and electronic structure contribution [33]
that are not included in SFA and usually contribute to lower- order harmonics, below the ionization threshold. SFA has been proven to be an accurate tool for the description of complex field interacting with matter [34]. In the scope of our results SFA can accurately demonstrate our findings.
B. Investigation of the double-pulse structure
The total electric field, whose influence on the HHG pro- cess is investigated, is expressed as
E(t)=E0e−2 ln2t
2
τ2ei[ω0t+ϕcep]
+R·E0e−2 ln2(t−τdτ2)2ei[ω0(t−τd)+ϕcep]+c.c., (6) where E0 is the amplitude andτ andω0 are the transform limited full width at half maximum (FWHM) duration and the central angular frequency of the laser pulses, respectively.R andτd represent the amplitude ratio and the time separation of the composing pulses.ϕcepis the absolute carrier envelope phase for each pulse. Time separationτd appears as a linear spectral phase term in the frequency domain, which arises from the Fourier shift theorem. In the spectral domain it appears as a phase term of the forme−iτd(ω−ω0), which causes the interference effect in the spectral domain.
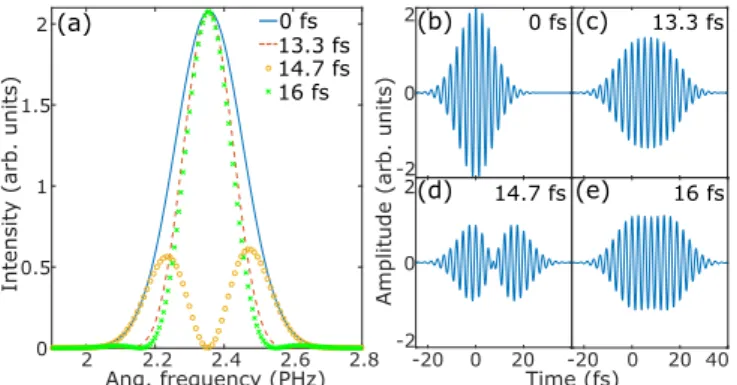
Figure1(a)depicts the spectra and Figs.1(b)–1(e)show the temporal profiles of the double-pulse structure for different time delay (τd) values. The FWHM duration of both pulses is 12 fs and their central frequency is 2.36 PHz (800 nm central wavelength). The amplitude ratio between them is 1. The different curves in Fig.1(a)show how the spectrum changes when the time delay between the two pulses is varied. It reveals that at larger delays spectral valleys appear as a result of the spectral interference. The distance between the spectral minima (ωd) is directly related to the temporal separation by ωd =2π/τd. If the temporal amplitude ratio R is 1, the spectral minima reach zero. As the ratio becomes smaller, the spectral amplitude will not reach zero and the contrast of the interference drops [35].
In fact, the position of the spectral peaks under the enve- lope in the frequency domain is strongly influenced by the relativeϕcepdifference between the composing pulses. If the delay between the pulses is changed, it also affects the relative ϕcepbetween them because they have the same absoluteϕcep. The spectrum and the time evolution of the electric field with
2 2.2 2.4 2.6 2.8 Ang. frequency (PHz) 0
0.5 1 1.5 2
Intensity (arb. units)
-2 0 2
-20 0 20 -2
0 2
-20 0 20 40 Time (fs)
Amplitude (arb. units)
(a) (b) (c)
(d) (e)
0 fs 13.3 fs
14.7 fs 16 fs
0 fs 13.3 fs 14.7 fs 16 fs
FIG. 1. (a) Spectra and (b)–(e) the corresponding temporal am- plitude of the double pulses for different time delays: (b) 0 fs (solid blue), (c) 13.3 fs (dashed orange), (d) 14.7 fs (yellow open circles), and (e) 16 fs (green crosses) between the pulses. Their amplitude ratio is chosen to be 1. At delays of 0 fs, 13.3 fs, and 16 fs the two pulses interfere constructively, while at a delay of 14.7 fs they interfere destructively.
different relative CEPs and a fixed time delay between the pulses can be seen in Fig. 2. A similar spectral intensity change is observed as in the case of delay variation [Fig.1(a)].
This is a purely linear optical effect caused by the interference of the double pulses. While it is important to consider the effect ofϕcepin the experimental implementations of double- pulse generation, its influence on harmonic generation is not studied here, because it is analogous to the effect of delay (cf.
Fig.1and Fig.2).
In the case of gas HHG (GHHG), on the single atom level, the spectrum of the driving laser is imprinted in the high-order harmonics [36,37]; thus by modulating the spectrum of the seeding source of the GHHG process, the generated high harmonics are also altered. To simplify and emphasize the main observations and still be experimentally relevant, the propagation effects (such as plasma generation, self-focusing, absorption, and dispersion effects) are not included in the simulations. One way to produce similar conditions experi- mentally is to choose a very thin target, such as a supersonic
2 2.2 2.4 2.6 2.8 Ang. frequency (PHz) 0
0.5 1 1.5 2
Intensity (arb. units)
-1 0 1
-20 0 20 -1
0 1
-20 0 20 40 Time (fs)
Amplitude (arb. units)
(a) (b) (c)
(d) (e)
0 rad
π rad 32π rad
32 0 rad π rad π rad
π rad 12 π rad
12
FIG. 2. (a) Spectral intensity and (b)–(e) the corresponding tem- poral evolution at a fixed delay, but (b) at 0, (c)π/2, (d) π, and (e) 3π/2 rad relative ϕcep between the composing pulses of the double-pulse structure. The chosen delay isτd =16 fs, where the two pulses constructively interfere in the case of 0 radϕcep. The other parameters are the same as those in Fig.1.
gas jet [38,39], and to set up a loose focusing condition, so the gas cell thickness is negligible compared to the Rayleigh length of the laser beam.
III. RESULTS
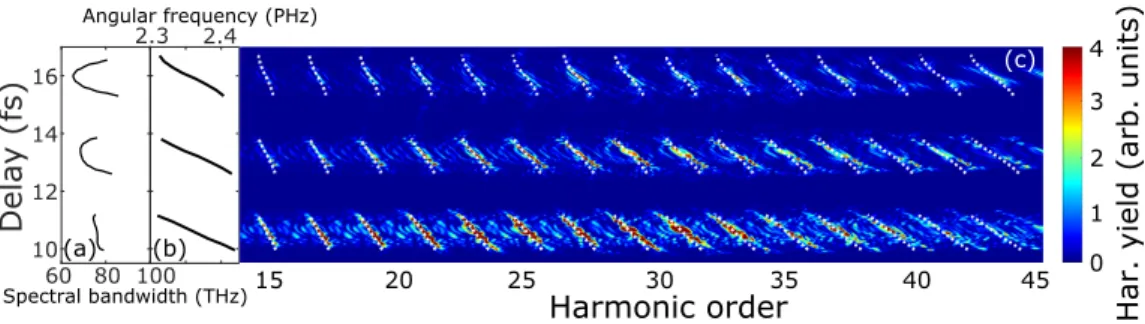
In the simulations, temporal double pulses have been applied as a driving field of the GHHG. The variation of the spectral bandwidth of the driving field with the time separation of the double pulses [ ω2=∞
−∞(ω− ω0)2|E(ω)|2dω/∞
−∞|E(ω)|2dω] is presented in Fig. 3(a).
The variance of the central angular frequency [ω0=
∞
−∞ω|E(ω)|2dω/∞
−∞|E(ω)|2dω] as the delay changes is represented in Fig.3(b). The dotted white curves in Fig.3(c) show where each generated harmonic should appear with the central frequency of the generation field at that certain delay (q·ω0, where q is the harmonic order). The impact of the time separation of the double-pulse structure on the generated high harmonic spectrum is presented in the colored map in Fig.3(c). The delay is varied from 9.5 to 17 fs. Both pulses have a Gaussian envelope, while the central wavelength and the FWHM duration are 800 nm and 12 fs, respectively. Both pulses have the same 0 rad absolute ϕcep. The target gas is argon, which has an ionization potential (Ip) of 15.76 eV. As the delay between the pulses is varied, the harmonics at certain delays disappear, while at other delays they show a maximum, which results in distinct bunches in the harmonic structure.
This can be explained by the interference of the composing pulses, which interfere constructively at certain delays, and destructively at other delays [cf. the spectral intensity varia- tion in Figs. 1(a) and2(a)]. The appearance of the bunches is determined by the peak-to-peak distance of the driving laser electric field (T0=2π/ω0), which in these simulations equals 2.67 fs. The pulses have the same 2.3×10¹⁴ cmW2
peak intensity. This means that when the pulses significantly overlap (around 0 fs, 2.67 fs, 5.34 fs, and 8 fs delay times), the peak intensity is well above the saturation intensity and it is not shown in Fig.3. The plot starts from the fourth de- structive interference region (∼9.5 fs delay). At higher delay values a shift of the individual harmonics can be observed, which results from the variation of the central frequency [cf.
Fig. 3(b)]. This allows us to tune the photon energy of the generated harmonics by simply changing the delay between the pulses. The features presented in Fig. 3(c) have been confirmed by one-dimensional soft-core TDSE calculations.
It must be mentioned that in the present simulation the applied amplitude ratio was 1, but the method is robust for dissimilar amplitude ratios too, because the spectral interference contrast is not very sensitive to the amplitude ratio (the contrast change is only 6% in the case ofR=0.7 compared toR=1). The dominant effect is just a slight blurring of the harmonics, so the method is robust against imperfections in the amplitude ratio.
The harmonic bunch around 13 fs time separation can be a more interesting position because the tilting phe- nomenon is clearly visible. It is important to mention that Fig. 3(c) presents the plateau harmonics only; the cutoff harmonics are not shown. The entire HHG spectra are de- picted in Fig. 4 for a shorter delay range. The white curve shows the position of the cutoff (Ec), which is calculated
2.3 2.4 Angular frequency (PHz)
60 80 100 10
12 14 16
Delay (fs)
Spectral bandwidth (THz)15 20 25 30 35 40 45
Harmonic order
0 1 3 4
Har. yield (arb. units)
(a) (b)
(c) (c)
2
FIG. 3. (a) Variation of the spectral bandwidth and (b) the central angular frequency, of the driving double pulses changing the time delay between the constituting pulses. The colored map (c) shows the dependence of the high-order harmonic spectrum on the time separation of the two pulses, applying 50 as time resolution. The composing pulses have 12 fs FWHM duration and 800 nm central wavelength. Their amplitude ratio is 1. The target gas is argon. Harmonic order is defined as the higher orders of the central frequency of a single pulse. The harmonic yield (color bar) is in linear scale.
by the Ec=Ip+3.17Up formula. In the expression, Up= 9.4×10⁻¹⁴I[W/cm2](λ[μm])2 is the ponderomotive poten- tial, where I and λ are the peak intensity and the central wavelength of the driving field [30], respectively.
To demonstrate the energy tunability range of the individ- ual harmonics, the delay dependence of the spectral position of the 15th, 25th, and 39th harmonic peaks are presented in Fig. 5. These harmonics are marked with correspondingly colored rectangles in Fig. 4. It is clearly indicated that, as the harmonic order increases, the tilt of the harmonics also increases, so the energy of the higher harmonics can be varied on a wider range. This is a direct consequence of the central frequency change of the generating field [see Fig. 3(b)]. In Fig.5, the open circles represent the position of the harmonics obtained from the peak positions in Fig. 4. The solid lines are linear fits to the harmonic peak positions as a function of delay. For better comparison, the harmonics are shifted by their nominal energy value.
Another profitable physical phenomenon that can be ob- served in Figs. 3(a) and 3(c) is the alteration of the width of the generated high-order harmonics. As is known, the harmonics inherit the shape of the original laser spectrum [36,37]; thus the spectrum of the double-pulse structure ap- pears in the shape of high harmonics. As can be seen in Fig.3(a), the spectral width of the driving field slightly de- creases as the time separation between the constituting pulses of the double-pulse structure increases. For this reason, mod- erately thinner harmonics can be generated if double pulses with higher time delays are applied to drive the HHG process.
Har. yield (arb. units)
14 13
12 20 30 40 50 60 70 80
Harmonic order
Delay (fs) 10-1
101 100
10-2
FIG. 4. Harmonic spectra generated by double pulses. The time separation varies around the 6th constructive interference region (∼13.3 fs). The other simulation conditions are the same as in Fig.3.
The white curve represents the calculated cutoff positionsEc. The harmonic yield (color bar) is in logarithmic scale.
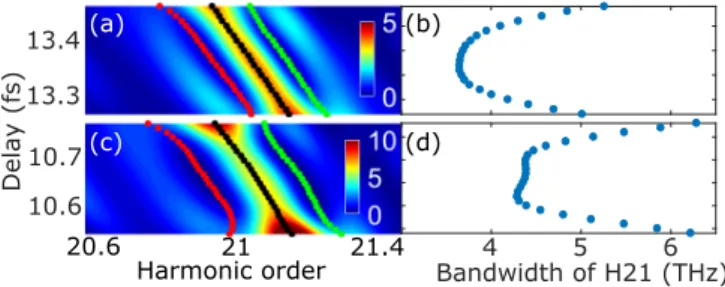
Figure6displays the spectral bandwidth variation of the 21st harmonic as a function of the time separation of double pulses.
The spectral region between the red and green dots was used to calculate the bandwidth by the same formula that was used to obtain the bandwidth of the double pulse structure, that is, ω2=∞
−∞(ω−ω0)2|E(ω)|2dω/∞
−∞|E(ω)|2dω, with ω0
being the central frequency of the harmonic peak. As a com- parison, the bandwidth of the 21st harmonic that is generated by a single Gaussian pulse—applying the same parameters as used for the composing pulses of the double-pulse structure—
is 9.4 THz, approximately two times the values achievable at the delays presented in Fig.6. It must be also mentioned that the harmonics in the plateau region have the presented spectral evolution, but as they move towards the position of the cutoff the harmonics become more and more blurred, as can be seen in Fig.4, due to the fewer generated trajectories.
Moreover, the harmonics close to the cutoff region are clearly distinguishable (see Fig. 4). This is closely related to the fact that at bigger time separations (comparable to the pulse duration) the envelope of the driving field begins to resemble a super-Gaussian temporal evolution. For this reason, the total electric field has more half cycles, which have the same temporal amplitude, as can be seen in Figs.2(b),2(c) and2(e). This results in the emission of attosecond pulses with comparable strength and spectral bandwidth. For this reason, both in the plateau and around the cutoff region the harmonics are sharper compared to the harmonics that are produced by a single Gaussian pulse.
12.8 13 13.2 13.4 13.6
Delay (fs) -1
-0.5 0 0.5 1
1.5 15th harmonic
25th harmonic 39th harmonic Fit to 15th harmonic Fit to 25th harmonic Fit to 39th harmonic
Relative photon energy ω-qω(800 nm) (eV)
FIG. 5. Photon energy variation of the 15th, 25th, and 39th har- monics as the time separation of the double pulses changes. In Fig.4, these harmonics are marked with appropriately colored rectangles.
13.3 13.4
Delay (fs)
10.6 10.7
21 21.4
20.6
Harmonic order 4 5 6
Bandwidth of H21 (THz)
(a) (b)
(c) (d)
FIG. 6. Variation of spectral bandwidth of the 21st harmonic at two distinct delay regions. Panels (a) and (c) show how the spectrum changes in the vicinity of this harmonic by the delay: the black dots represent the spectral position of the harmonic peak; the red and green dots show the first spectral valley on the low and high photon energy sides of the harmonic peak, respectively. To determine the bandwidth, the region between the red and green dots was used.
Panels (b) and (d) demonstrate the spectral bandwidth dependence on the delay.
IV. CONCLUSIONS
This paper demonstrates the generation of high-order har- monics with tunable photon energy and spectral width driven by a temporal double-pulse structure. The constituting pulses have a Gaussian temporal profile, having the same spectrum, spectral phase, and absolute CEP. Varying the time separation between the composing pulses, the photon energy of the gen- erated harmonics can be varied in an energy range within one eV, which is a bandwidth comparable to the photon energy of the fundamental field. Furthermore, the harmonics are slightly thinner compared to the harmonics that can be produced by a single Gaussian shape electric field. Moreover, when the delayed pulses create a super-Gaussian-like temporal profile, there are multiple, almost identical half cycles contributing to the emission; thus the cutoff harmonics are as narrow as those in the plateau. For the investigation, SFA is applied to calculate the dipole spectrum. The obtained results are also verified by the numerical solution of the one-dimensional soft- core TDSE. This showed the same effects, which highlights the accuracy of the application of SFA for the present cases.
Harmonics having the presented characteristics can be beneficial for experiments that require a spectrally tuned single harmonic. Such experiments include angle-resolved
photoemission spectroscopy [40,41] or lifetime measurements of atomic or molecular excited states [42,43], which require a narrow wavelength range excitation. Furthermore, pho- ton energy-tunable XUV radiation with a narrow spectral bandwidth is extremely important in many fields such as nanolithograpy [44], XUV holography [45], or spectroscopy [46]. Moreover, by combining an XUV multilayer mirror and the photon-energy tunable harmonic generation technique presented here, one can achieve a similar tunability as with a single-stage XUV monochromator. The advantages of the technique described here over an XUV monochromator in- clude the much lower instrumentation costs, simpler arrange- ment, and consequently easier alignment.
In comparison to the methods that use chirped pulses and are detailed in Refs. [15–17], our procedure gives the possibility to tune the central wavelength of the driving source itself. In contrast to the method presented here, the application of chirped pulses for HHG merely varies the position of the generated harmonics compared to the position of the harmonics produced by transform limited pulses. As another alternative, spectral tuning of the laser field is also possible with wavelength-tunable lasers. Nevertheless, such lasers are relatively rare, and with our method the tuning of the central wavelength can be achieved with any laser source, however, only in a narrower range. Moreover, the production of a temporal double-pulse structure can be easily implemented experimentally, for example, with a commercially available acousto-optic pulse modulator. Furthermore, our technique can produce a super-Gaussian-like temporal evolution. This quasi-top-hat temporal envelope can provide more control over quantum trajectories by controlling other pulse param- eters (such as the peak intensity or duration of the pulse);
therefore, it offers more control over the HHG process in general.
ACKNOWLEDGMENTS
This research was financially supported by the ELI- ALPS project (No. GINOP-2.3.6-15-2015-00001), which was funded by the European Union and co-financed by the Eu- ropean Regional Development Fund. S.K. would like to ac- knowledge work from European Cooperation in Science and Technology (COST) Action CA17126 (TUMIEE), supported by COST.
[1] Y. Akiyama, K. Midorikawa, Y. Matsunawa, Y. Nagata, M. Obara, H. Tashiro, and K. Toyoda,Phys. Rev. Lett.69, 2176 (1992).
[2] C.-G. Wahlström, J. Larsson, A. Persson, T. Starczewski, S. Svanberg, P. Salières, P. Balcou, and A. L’Huillier,Phys. Rev.
A48, 4709 (1993).
[3] P. Agostini and L. F DiMauro, Rep. Prog. Phys. 67, 1563 (2004).
[4] S. Chatziathanasiou, S. Kahaly, E. Skantzakis, G. Sansone, R. Lopez-Martens, S. Haessler, K. Varju, G. D. Tsakiris, D. Charalambidis, and P. Tzallas,Photonics4, 26 (2017).
[5] P. B. Corkum,Phys. Rev. Lett.71, 1994 (1993).
[6] S. Kühn, M. Dumergue, S. Kahaly, S. Mondal, T. Csizmadia, M. Füle, B. Farkas, B. Major, Z. Várallyay, E. Cormieret al.,J.
Phys. B: At., Mol., Opt. Phys.50, 132002 (2017).
[7] R. Klas, A. Kirsche, M. Tschernajew, J. Rothhardt, and J. Limpert,Opt. Express26, 19318 (2018).
[8] G. Sansone, L. Poletto, and M. Nisoli, Nat. Photon. 5, 655 (2011).
[9] P.-C. Li, C. Laughlin, and S.-I Chu,Phys. Rev. A89, 023431 (2014).
[10] A. L’Huillier, D. Descamps, A. Johansson, J. Norin, J. Mauritsson, and C.-G. Wahlström, Eur. Phys. J. D26, 91 (2003).
[11] M. Reduzzi, P. Carpeggiani, S. Kühn, F. Calegari, M. Nisoli, S. Stagira, C. Vozzi, P. Dombi, S. Kahaly, P. Tzallas et al., J. Electron Spectrosc. Relat. Phenom. 204, 257 (2015).
[12] M. F. Ciappina, J. Biegert, R. Quidant, and M. Lewenstein, Phys. Rev. A85, 033828 (2012).
[13] I. Yavuz, E. A. Bleda, Z. Altun, and T. Topcu,Phys. Rev. A85, 013416 (2012).
[14] Y. Chou, P.-C. Li, T.-S. Ho, and S.-I Chu, Phys. Rev. A92, 023423 (2015).
[15] D. G. Lee, J.-H. Kim, K.-H. Hong, and C. H. Nam,Phys. Rev.
Lett.87, 243902 (2001).
[16] H. T. Kim, D. G. Lee, K.-H. Hong, J.-H. Kim, I. W. Choi, and C. H. Nam,Phys. Rev. A67, 051801(R) (2003).
[17] Z. Chang, A. Rundquist, H. Wang, I. Christov, H. C. Kapteyn, and M. M. Murnane,Phys. Rev. A58, R30 (1998).
[18] B. Wang, X. Li, and P. Fu,J. Phys. B: At., Mol., Opt. Phys.31, 1961 (1998).
[19] S. Odžak and D. B. Miloševi´c, Phys. Rev. A 72, 033407 (2005).
[20] Y. Xiang, Y. Niu, and S. Gong,Phys. Rev. A79, 053419 (2009).
[21] H. Merdji, M. Kovaˇcev, W. Boutu, P. Salières, F. Vernay, and B.
Carré,Phys. Rev. A74, 043804 (2006).
[22] P. Raith, C. Ott, C. P. Anderson, A. Kaldun, K. Meyer, M. Laux, Y. Zhang, and T. Pfeifer,Appl. Phys. Lett.100, 121104 (2012).
[23] J. A. Pérez-Hernández, D. J. Hoffmann, A. Zäir, L. E.
Chipperfield, L. Plaja, C. Ruiz, J. P. Marangos, and L. Roso, J. Phys. B: At., Mol., Opt. Phys.42, 134004 (2009).
[24] C. Iaconis and I. A. Walmsley,Opt. Lett.23, 792 (1998).
[25] R. Trebino and D. J. Kane,J. Opt. Soc. Am. A10, 1101 (1993).
[26] B. Seifert and H. Stolz,Meas. Sci. Technol.20, 015303 (2009).
[27] L. Gulyás Oldal, T. Csizmadia, P. Ye, N. G. Harshitha, M. Füle, and A. Zaïr,Appl. Phys. Lett.115, 051106 (2019).
[28] K. B. Holzner, Ph.D. thesis, Imperial College London, 2017.
[29] M. Lewenstein, P. Balcou, M. Y. Ivanov, A. L’Huillier, and P. B.
Corkum,Phys. Rev. A49, 2117 (1994).
[30] K. L. Ishikawa, inAdvances in Solid State Lasers Development and Applications, edited by M. Grishin (IntechOpen, 2010), Chap. 19, pp. 439–464.
[31] A. Nayak, M. Dumergue, S. Kühn, S. Mondal, T. Csizmadia, N. Harshitha, M. Füle, M. U. Kahaly, B. Farkas, B. Major et al.,Phys. Rep.833, 1 (2019).
[32] G. Sansone, C. Vozzi, S. Stagira, and M. Nisoli,Phys. Rev. A 70, 013411 (2004).
[33] M. B. Gaarde, J. L. Tate, and K. J. Schafer,J. Phys. B: At., Mol., Opt. Phys.41, 132001 (2008).
[34] A.-T. Le, H. Wei, C. Jin, and C. D. Lin,J. Phys. B: At., Mol., Opt. Phys.49, 053001 (2016).
[35] R. Paschotta,Encycloped. Laser Phys. Technol.1, 856 (2008).
[36] P. Salières, A. L’Huillier, and M. Lewenstein,Phys. Rev. Lett.
74, 3776 (1995).
[37] A. L’Huillier, K. J. Schafer, and K. C. Kulander,J. Phys. B: At., Mol., Opt. Phys.24, 3315 (1991).
[38] J. Itatani, J. Levesque, D. Zeidler, H. Pépin, N. Hiromichi, J. C.
Kieffer, P. B. Corkum, and D. M. Villeneuve,Nature (London) 432, 867 (2004).
[39] J. Itatani, D. Zeidler, J. Levesque, M. Spanner, D. M.
Villeneuve, and P. B. Corkum, Phys. Rev. Lett. 94, 123902 (2005).
[40] S. Mathias, L. Miaja-Avila, M. M. Murnane, H. Kapteyn, M. Aeschlimann, and M. Bauer,Rev. Sci. Instrum.78, 083105 (2007).
[41] H. Bromberger, A. Ermolov, F. Belli, H. Liu, F. Calegari, M. Chávez-Cervantes, C. T. Li, M. T. Lin, A. Abdolvand, P. S. J.
Russellet al.,Appl. Phys. Lett.107, 091101 (2015).
[42] M. Matejska-Minda, P. Bednarczyk, B. Fornal, F. R. Xu, W. Y.
Liang, G. de Angelis, S. Aydin, S. Brambilla, M. Ciemała, E. Farneaet al.,Phys. Rev. C100, 054330 (2019).
[43] K. Kolos, D. Miller, R. Grzywacz, H. Iwasaki, M. Al-Shudifat, D. Bazin, C. R. Bingham, T. Braunroth, G. Cerizza, A. Gade et al.,Phys. Rev. Lett.116, 122502 (2016).
[44] H. H. Solak,J. Phys. D: Appl. Phys.39, R171 (2006).
[45] R. A. Bartels, A. Paul, H. Green, H. C. Kapteyn, M. M.
Murnane, S. Backus, I. P. Christov, Y. Liu, D. Attwood, and C. Jacobsen,Science297, 376 (2002).
[46] A. Cingöz, D. C. Yost, A. Allison, T. K. Ruehl, M. E. Fermann, I. Hartl, and J. Ye,Nature (London)482, 68 (2012).