Theses of the Ph.D. dissertation Béla Weiss
Supervisor:
Tamás Roska, D.Sc.
ordinary member of the Hungarian Academy of Sciences
Scientific advisers:
György Karmos, M.D., Ph.D.
emeritus professor and
Zsuzsanna Vágó, Ph.D.
associate professor
Pázmány Péter Catholic University Faculty of Information Technology
Interdisciplinary Technical Sciences Doctoral School
Budapest, 2010
1. Introduction and aims
Despite of the broad spectrum of electrophysiological and imaging methods available in the field of neurobiology still little is known about how exactly complex neural dynamics emerge. Hopefully, application of novel theoretical approaches and computational methods aimed for analysis and modeling of complex systems might provide a deeper insight into physiological and pathological mechanisms of the brain. Such a framework could be the theory of self-organized criticality (SOC) that allows for describing the high- dimensional character of the dynamics and the presence of stochastic effects in complex systems [15]. SOC is a phenomenon characterizing systems that might arrive at a critical state (phase transition) without any tuning of a specific parameter [16]. SOC is indicated by a spatio-temporal scale-free (also called self-similar or fractal) property of a system [17]. Scale-free behavior means that no characteristic scales dominate the dynamics of the underlying processes. It also reflects a tendency of complex systems to develop correlations that decay more slowly and extend over larger distances in time and space than the mechanisms of the underlying processes would suggest [17-19]. The long-range correlations build up through local interactions until they extend throughout the entire system and then the dynamics of the system exhibit power-law scaling behavior and the underlying process operates in a critical state [16, 20].
Several features of neural networks are consistent with SOC, such as a large number of elements (neurons) interacting with each other in a
nonlinear way (e.g. presence of threshold for spiking), a possibility to change and save connectivity between the elements (e.g. via synaptic plasticity), absence of any special parameter tuning, and spatio-temporal dynamics obeying power-law statistics [15, 21]. A critical state is a regime of a system where opposing forces are balanced. In the nervous system such a balance might be represented by the relationship between excitation and inhibition, which is known to be important for the transfer of information [22] and for the sustained neuronal activity [23]. Neural network simulations demonstrated that the presence of long-range spatio-temporal correlations is beneficial for the optimal transfer of information since these correlations represent an optimal compromise between high susceptibility to perturbations and stability in the system [24, 25]. All these properties of the brain suggest that the SOC paradigm might be an appropriate tool to investigate and model neural activities.
Generally, the motivation of my research is two-fold. From the theoretical point of view I am interested in how complex neural dynamics emerge across different scales and how are these dynamics related to different physiological and pathological mechanisms that thoroughly affect the information sensation, processing, storage and retrieval of the brain. On the other hand, I am interested in practical aspects of brain research as well. Namely, as an engineer I am also motivated to reveal how biologically-inspired information processing models can be transferred into technical applications, including the control of the brain itself. At the confluence of my general research interests I found the investigation of vigilance level and epilepsy to
be of a crucial importance given the well-known influence of these basic mechanisms on the information processing properties of the brain. Thus, I devoted my PhD student years to explore the capability of the SOC paradigm to describe the information processing properties of the brain by fractal analyses of physiological sleep and epileptic neural activities. However, due to the size limitations of the dissertation and the difficulties related to the analyses of epileptic activities I will here concentrate on presentation of my results related to fractal analysis of the human sleep EEG only.
During the last decade a series of human studies revealed differences in the fractal measures between specific vigilance conditions. For example a study by Linkenkaer et al. [15] showed that µ and α oscillations scale similarly, but β oscillations have a significantly smaller scaling exponent compared to these two latter oscillations during eyes-closed state. Another study showed that long-range temporal correlations are stronger in the eyes-closed condition as compared with the eyes-open condition [26]. In [21] largest exponent values for α and β oscillations were found in the occipital and parietal areas during the eyes-closed condition. Fractal dimension was found to be significantly higher for drowsy EEG compared to the wake state [27]. Increased sensory input [28] or high level of alertness [29] was shown to disrupt long-range temporal correlations.
Several studies also addressed self-similarity of the sleep EEG [30- 36]. Generally, most of these studies reported higher scaling exponents and thus stronger long-range temporal correlations for
deeper sleep stages. However, these studies were limited by a low sampling rate (100Hz in [31-33, 36]; 128Hz in [35]) or a low number of EEG channels (Fpz-Cz and Pz-Cz in [33, 36]; Cz in [31, 32]; C3 in [34, 35]; C4 in [30]). Furthermore, in contrast to the general opinion that the EEG is more regular and synchronized during deeper sleep stages, the only study that assessed multifractality of the sleep EEG found that the EEG is most multifractal during NREM3 and NREM4 [33]. It is to be noted that none of the abovementioned studies related to sleep analyses assessed topographic aspects of the temporal fractal properties. Moreover, as far as I know, no previous study carried out a joint analysis of monofractal and multifractal properties, neither the relationship between fractal and power spectral measures was assessed yet. Therefore, during my research I attempted to address these theoretical controversies and shortcomings by estimation of spatial and sleep stage-wise distributions of temporal monofractal and multifractal properties of the human EEG and by assessing the relation of these measures with power spectral features. With a more practical motivation in the background and by organizing my analyses around the steps presented in Figure 1, I also assessed whether a combination of fractal and power spectral EEG features might improve the classification of sleep stages.
Figure 1. A process diagram of a sleep staging method development.
2. Methods of investigation
I performed all the analyses using whole-night EEG recordings of twenty-two healthy subjects with no sleep disturbances, free of drugs and medications as assessed by an interview and questionnaires on sleeping habits and health (age: 17–55 years, mean±S.D.: 31±9 years, 11 males and 11 females). I assessed monofractal and multifractal properties of the sleep EEG recordings by estimation of the Hurst exponent (H) and the range of multifractal spectra (∆D), respectively. When 0<H<0.5, an increase in the process is more probably followed by a decrease (anti-persistence) and vice-versa, the process is considered to have short-range dependence. If H=0.5, observations of the process are uncorrelated. When 0.5<H<1, an increase in the process is more probably followed by an increase and a decrease is more probably followed by a decrease (persistence), the process is considered to have long-range dependence. Measure ∆D indicates deviation from monofractal.
Larger ∆D indicates multifractality, while smaller ∆D indicates that the analyzed system tends to possess the monofractal property. For multifractal processes monofractal analysis can only give a measure of the largest of their fractal dimensions. To estimate H, I applied the rescaled adjusted range based approach, while ∆D was approximated by estimation of the generalized dimensions spectra. To reveal the relationship between fractal and power spectral properties of EEG signals I calculated relative band powers (PBr) of SO (0.5-1] Hz, δ (1-4] Hz, θ (4-8] Hz, α (8-11] Hz, σ (11-16] Hz, β (16-30] Hz, γ (30- 70] Hz frequency bands and the spectral edge frequency. I assessed
sleep stage discrimination capabilities of fractal and power spectral EEG features and their combinations both at individual and group levels by applying nine different classification paradigms: linear discriminant analysis (LD), quadratic discriminant analysis (QD), naïve Bayes classifier (NB), feedforward neural network (FF), radial basis function neural network (RB), probabilistic neural network (PN), adaptive neuro-fuzzy inference system (AN), support vector machine with a linear kernel function (LS) and support vector machine with a radial basis kernel function (RS). For the combination of features I used the sequential forward feature selection algorithm in three ways: combining different measures in single channels (MS), combining different channels for single measures (CS) and combining channel x measure features (CMS). I evaluated the performance of particular classifications by Kappa analysis of the obtained confusion matrices.
For visualization, pre-processing and estimation of EEG measures I used a self-developed toolbox under different versions of Matlab (The MathWorks Inc., Natick, MA, USA). The statistical analyses I carried out by applying STATISTICA (StatSoft, Inc., Tulsa, OK, USA) and Matlab.
3. New scientific results
Thesis I: Fractal properties of the human sleep EEG and their relation to power spectral measures
(Related publications: [1-3], [5].)
I.1. I have revealed that EEG signals tend to be more persistent and less multifractal with the deepening of sleep. In addition, both monofractal and multifractal EEG measures exhibit topographic distributions that are sleep stage-specific.
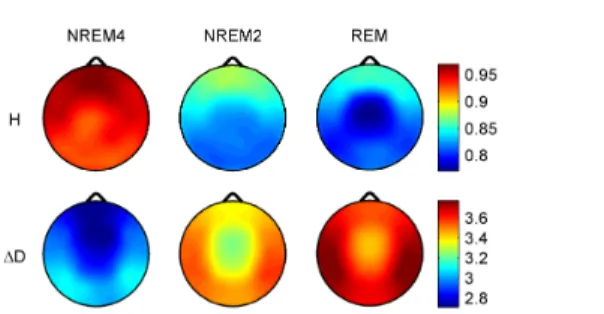
Topographic distributions of the fractal measures for the analyzed sleep stages are shown in Figure 2. Highest values of the monofractal measure H emerged frontally during all sleep stages, while the overall minimum was found during REM in the central zone. A HNREM4 > HNREM2 > HREM trend was present across the whole head surface. The multifractal measure ∆D showed an opposite trend: ∆DREM > ∆DNREM2 > ∆DNREM4. Minima of ∆D could be found in the fronto-central region during all sleep stages, while higher values were observed in the posterior circumferential channels. Based on the observed spatio-temporal trends I speculate that the brain modulates its information processing capability and susceptibility to outer and inner stimuli via re- organization of spatio-temporal correlations. By building up longer spatio-temporal correlations and by shrinking the fractal spectrum the localized processing elements of the brain (e.g.
columns of the neocortex) become less reactive to stimuli and their selective information processing capability decreases as the sleep deepens because of the activities that spread over longer distances.
I.2. I have found that the topography of inter-site correlations of H is more variable than that of ∆D across sleep stages.
Furthermore, I have shown that the cross-correlation between H and ∆D exhibits sleep stage-specific topography.
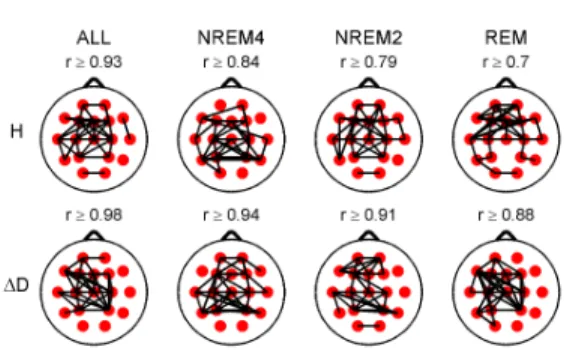
As it can be seen in Figure 3 (column ALL) both fractal measures exhibited strongest inter-site correlations in the central region when all sleep stages were considered together. However, H exhibited higher posterior inter-site correlations during NREM4 and higher anterior correlations during NREM2 and REM. At the same time ∆D did not reveal such differences between sleep stages. Measure ∆D showed higher inter-site correlations as compared to H.
Figure 2. Topographic distributions of group-level medians of the fractal measures.
By combining all sleep stages I found a strong negative correlation between H and ∆D with a nadir in the posterior channels (Figure 4). As revealed by the sleep stage-wise analysis NREM2 and NREM4 contributed most to this occipital nadir. As compared to NREM4 weaker and less significant correlations emerged during NREM2. During REM there was a further weakening of correlations with a non-significant positive peak in the F3, Fz, F4 channels.
These results suggest that despite of the general opposite tendency of the two fractal properties there might be different mechanisms in the brain that control multifractality and monofractality of the spatio-temporal dynamics in a more complex way.
Figure 3. Highest 35 inter-site correlations of the fractal measures denoted by black lines drawn between the appropriate locations.
Spearman’s correlation coefficients were calculated considering all sleep stages together (column ALL) as well as separately. Only significant (p<0.05) correlations are depicted. Lowest presented correlation values can be found above the topographic maps.
I.3. I have assessed the relationship between fractal and power spectral EEG measures as well as the contribution of individual frequency band activities to the fractal measures.
Overall, I found stronger correlations between the fractal and the power spectral measures during deeper sleep stages than in lighter stages. Additionally, I also revealed that the monofractal measure H is positively correlated with relative powers of slow activities (especially PSOr) and negatively correlated with faster activities (above 4 Hz) exhibiting strongest negative correlations with Pθr. By contrast, ∆D is negatively correlated with slow activities and positively correlated with relative powers of higher frequency Figure 4. Spearman cross-correlations between H and ∆D considering all sleep stages together as well as separately. Significant values (p<0.05) are denoted on the left side of the color bars using the following notations: no sign (none of the values are significant); only + (all values are significant); + with a dash (only values below the dashes are significant).
bands achieving strongest correlations with Pθr, Pαr and Pσr in temporal channels during NREM4. However, despite of the strong correlations revealed between the fractal and the power spectral measures, using a multiple linear regression analysis I found that fractal measures (especially ∆D) carry additional information about EEG signals compared to the power spectral features.
I.4. I have revealed gender-related differences of monofractal and multifractal EEG measures at specific topographic locations and during different sleep stages.
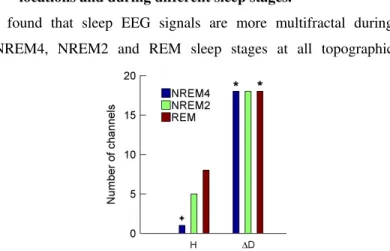
I found that sleep EEG signals are more multifractal during NREM4, NREM2 and REM sleep stages at all topographic
Figure 5. Number of channels in which group-level medians were higher in males (case M>F) are presented for both fractal measures and sleep stages separately. Number of channels in which group-level measure medians are higher in females (case F>M) can be obtained by subtracting these values from 18 (total number of channels). The * (+) sign denotes measure and sleep stage combinations exhibiting significant differences for the case M>F (F>M).
locations in males than in females (see Figure 5). Most significant differences occurred during sleep stage NREM4 exhibiting a minimal p=0.0025 value in channel F7. By contrast, the monofractal measure H was higher in females in most of the channels, however, a significant difference (p=0.0464) appeared during NREM4 in channel T4 only.
Given that the F7 recording site lies over or near the Broca’s area I hypothesize that differences at this specific region reflect gender differences in verbal functions.
Thesis II: Classification of sleep stages by combining fractal and power spectral EEG features
(Related publications: [2], [4].)
II.1. I have assessed sleep stage discrimination capability of fractal and power spectral measures of EEG signals at specific topographic locations by applying different classification paradigms at both individual and group levels.
Considering both averaged individual- and group-level results, I obtained best sleep stage classification performance in most of the EEG channels and for most of the classification methods by applying the multifractal measure ∆D. Moreover, I found best classifications for ∆D in temporal channel T4 for most of the classifiers at both levels. Using conditional Kappa analysis I revealed that overall high performance of ∆D emerged due to the
high classification accuracy of the NREM4 stage. Using the ∆D x T4 single feature at the group level highest overall accuracy (OA=81.92 %) was achieved by a support vector machine with a linear kernel function, while individual-level analysis revealed best average classification result (OA=90.02 %) for a naïve Bayes classifier.
II.2. I have shown that a combination of fractal and power spectral measures of EEG signals recorded at different topographic locations significantly improves the discrimination of sleep stages.
I found that supplementation of the best single feature with an appropriate second one may significantly improve the sleep stage classification performance. Addition of a second measure for the same channel and addition of another channel x measure feature enhances the performance in more classifiers as compared to addition of a second channel for the same measure. Using conditional Kappa analysis I revealed that the overall classification accuracy improves due to the higher classification accuracy of NREM2 and REM sleep stages. Addition of a third channel considering the same measure does not improve significantly the classification. However, a combination of up to three measures of single channels and a combination of up to four channel x measure features may result in further significant improvements. Combinations of measures in single channels provide significantly better classifications when compared to
combinations of channels using single measures. Furthermore, combinations of channel x measure features perform significantly better as compared to combinations of measures in single channels. Considering feature combinations at the group level I obtained the best classification results using feedforward neural network and support vector machine classifiers that performed in most of the cases significantly better that the traditional methods such as the linear discriminant analysis, the quadratic discriminant analysis and the naïve Bayes classifier. This tendency was not true at the individual level, where due to the lower number of training
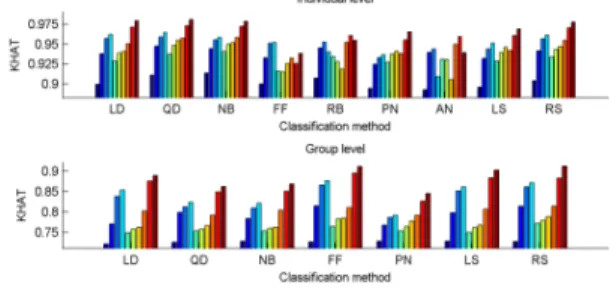
Figure 6. Averages of individual maximal Kˆ values and group-level maximal Kˆ values. First bars stand for classifications based on the best single input features, 2nd-4th bars denote classifications with 2-4 measures of single channels, 5th-7th bars present results for classifications with 2-4 channels of single measures, 8th-10th bars stand for classifications using 2-4 channel x measure feature combinations. RB and AN classifiers were excluded from group-level analyses due to their high computational demand.
samples the traditional methods performed even better, especially in those cases where the number of features was higher (see Figure 6).
When comparing the maximal classification performances of individual and group levels it can be observed that as expected better discrimination of sleep stages can be obtained at the individual level achieving even 100 % overall accuracy for several subjects.
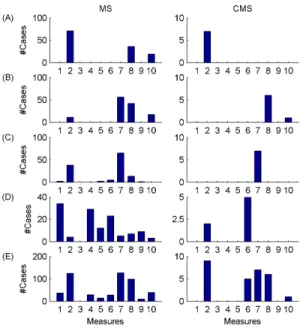
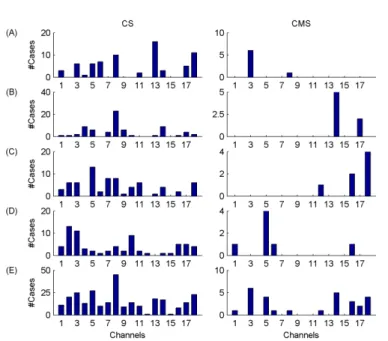
At the group level I achieved the best classification performance (OA=94.18 %) using the combination of ∆D x T3, Pβr x F3, Pσr x Cz and Pαr x O2 features and by applying a support vector machine classifier with a radial basis kernel function. As it can be seen in Figures 7 and 8, selection of these measures and channels was very similar across classification paradigms when feature selection was carried out on channel x measure pairs (CMS).
Selections of the best measures in single channels (MS) and selections of channels for specific measures resulted in slightly different distributions of selected features as compared to the CMS approach. In addition, individual-level results were comparable to those found at the group level. Measures ∆D, Pβr,
Pσr and channels T3-T4, O2, Cz proved to be the most appropriate features in all cases. Thus, I conclude that when combining fractal and power spectral measures the most appropriate features generally are: multifractality in temporal T3 and T4 channels, relative band powers of β and σ frequency bands over the fronto-
centro-parietal region and relative band power of α activity in the occipital region.
Figure 7. Group-level results. Number of cases (paradigms x channels) when particular measures were selected within the best four features. MS denotes the selection of measures in single channels, while CMS stands for the selection of channel x measure features. (A)-(D) denote cases when particular measures were found to be within the 1st, 2nd, 3rd and 4th best features, respectively. Row (E) stands for sums of cases presented in rows (A)-(D). The order of the measures is as follows: H, ∆D, PSOr, Pδr, Pθr, Pαr, Pσr, Pβr, Pγr, fse.
Figure 8. Group-level results. Number of cases (paradigms x measures) when particular channels were selected within the best four features. CS denotes the selection of channels considering single measures, while CMS stands for the selection of channel x measure features. (A)-(D) denote cases when particular channels were found to be within the 1st, 2nd, 3rd and 4th best features, respectively. Row (E) stands for sums of cases presented in rows (A)-(D). The order of the channels is as follows:
Fp2, F8, T4, T6, O2, Fp1, F7, T3, T5, O1, F4, C4, P4, F3, C3, P3, Fz, Cz.
4. Possible applications
The more theoretical results presented in Thesis I might contribute to reveal how the brain re-organizes itself across different vigilance states to modulate its information processing and reactivity to stimuli. However, more refined analyses are needed to assess fractal properties of the sleep EEG during cyclic alternating pattern (CAP) and non-CAP sequences since CAP translates a condition of sustained arousal instability between greater and lesser arousal levels, while non-CAP denotes a condition of arousal stability [37- 39]. In addition, to reveal the origin of self-similarity properties of macro EEG signals fractal analysis of brain activities at different scales is required. Application possibilities of the more practical results summarized in Thesis II are straightforward. E.g. automatic classification of the vigilance state would be beneficial for clinicians when assessing long-term recordings. Other applications might be the real-time monitoring of the depth of anesthesia during surgery [40] or drowsiness detection [41] for people working under monotonic and at the same time dangerous circumstances. Going even further, based on the current state of neural engineering it is evident that the widespread usage of brain computer interfaces for clinical and entertaining purposes will be among future trends. One of the clinical applications might be the real-time modulation of the brain activity for control of epileptic seizures by local drug delivery or electrical stimulation [42]. During recent years several seizure
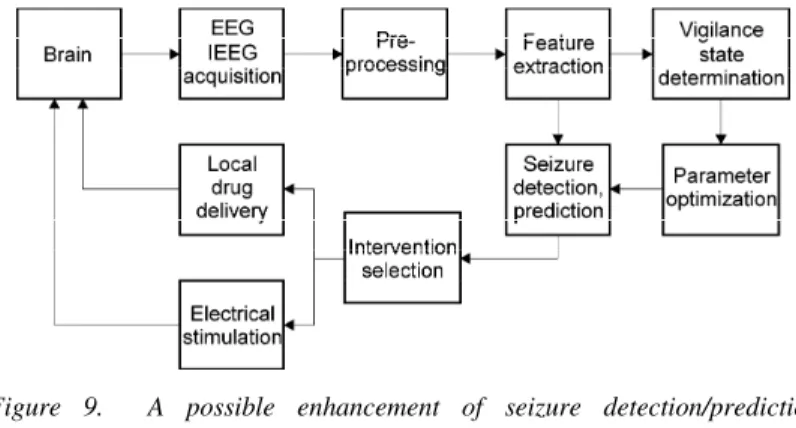
measures of brain activities [43]. However, background of false event recognitions, the reason of relatively low performance of algorithms remained unclear since generally not even the systematic assessment of possible effects of the vigilance state variation was carried out. My investigations (not presented in the dissertation) of fractal properties of epileptic brain activities [7-14] disclosed that both monofractal and multifractal measures exhibit sudden drops during the seizures and show slower trends during preictal and postictal states. Combining these findings with the results presented in the dissertation it becomes evident that the variation of the vigilance state might modulate epileptic events and hereby it might also affect their detections/predictions by applying these measures.
Since probably all measures are affected by the vigilance state I suggest a novel approach for detection/prediction of seizures that is enhanced by the determination of the vigilance state (Figure 9).
Figure 9. A possible enhancement of seizure detection/prediction capabilities by determination of the vigilance state for control of epileptic seizures.
5. Acknowledgement
First and foremost, I would like to thank the consistent support of my supervisor and head of the doctoral school, Prof. Tamás Roska. The interdisciplinary environment that he provided turned out to be of a crucial importance for my research.
I would also like to express my gratitude to my advisers, Prof.
György Karmos and Zsuzsanna Vágó for sharing their concerns and suggestions related to physiological and mathematical aspects of my work. I am indebted to Prof. Ronald Tetzlaff for his tutoring during my stay at the Institute of Applied Physics, Johann Wolfgang Goethe University in Frankfurt, Germany (IAP). During all these years my research was helped by Prof. Péter Halász and I appreciate this really much.
I am also thankful to my closest collaborators who contributed to my work. I am very grateful to Zsófia Clemens for all those discussions and her useful advices. I also acknowledge the contribution of Róbert Bódizs. Without the recordings acquired in his laboratory this research would not be possible. Although my work related to epilepsy did not become a part of the dissertation I thank the whole epilepsy monitoring and surgery team at the National Institute of Neuroscience. Special thanks go to István Ulbert, Lóránd Erőss, László Entz, Rita Jakus and Dániel Fabó.
I am also very grateful to my fellow PhD students, especially to Éva Bankó, Csaba Benedek, Mária Ercsey-Ravasz, Gergely Feldhoffer,
Tamás Pilissy, Gergely Soós, Ákos Tar, Róbert Tibold, Dávid Tisza, Gergely Treplán, József Veres and Péter Vizi for all their help, fruitful discussions and the time we spent together. I especially thank György Cserey, Zoltán Fodróczi, Viktor Gál, Kristóf Iván, Kristóf Karacs, Attila Kis, András Oláh and Róbert Wagner for their help at the beginning of my PhD studies.
I also say thank to all my colleagues at the IAP, but especially to Denis Dzafic, Martin Eichler, Gunter Geis, Frank Gollas, Leonardo Nicolosi, Christian Niederhöfer and Hermine Reichau for their friendship and help during my stay in Germany.
I acknowledge the kind help of Anna Csókási, Lívia Adorján, Judit Tihanyi, Vida Tivadarné Katinka and the personnel of the Students’
Office, the Dean’s Office, the Warden’s Office, the Financial Department, the IT Department, the Library, the Reception and the cleaning personnel.
I thank all my friends for being so patient during my busy days.
I am tremendously grateful to my Parents and Grandparents for all their love and support. Special thanks go to Ómama for her fostering and endless love and to my sister Ági and her family for their help during the toughest years.
Finally, I would like to thank my wife Nóra for her love, support, patient and understanding.
6. Publications
The author’s journal publications related to the dissertation [1] B. Weiss, Z. Clemens, R. Bódizs, Z. Vágó, and P. Halász, “Spatio-
temporal analysis of monofractal and multifractal properties of the human sleep EEG,” Journal of Neuroscience Methods, vol. 185, no. 1, pp. 116-24, Dec 2009.
[2] B. Weiss, Z. Clemens, R. Bódizs, and P. Halász, “Comparison of fractal and power spectral EEG features: effects of topography and sleep stages,” submitted.
[3] B. Weiss, Z. Clemens, R. Bódizs, and P. Halász, “Gender-related differences of fractal and power spectral EEG features in young adults:
effects of topography and sleep stages,” submitted.
[4] B. Weiss, Z. Clemens, R. Bódizs, and P. Halász, “A comparison of classification methods for sleep staging by combination of fractal and power spectral features of EEG signals recorded at different topographic locations,” submitted.
The author’s conference publications related to the dissertation [5] B. Weiss, Z. Clemens, R. Bódizs, P. Halász, and T. Roska,
“Topographic distribution of temporal self-similarity properties of human sleep EEG recordings,” in Frontiers in Systems Neuroscience.
Conference Abstract: 12th Meeting of the Hungarian Neuroscience Society, Budapest, Hungary, 2009.
The author’s other journal and conference publications [6] Z. Clemens, B. Weiss, A. Szucs, L. Eross, G. Rásonyi, and P. Halász,
“Phase coupling between rhythmic slow activity and gamma characterizes mesiotemporal rapid-eye-movement sleep in humans.,”
Neuroscience, vol. 163, pp. 388-96, Sep 2009.
[7] B. Weiss, Y. C. Tang, and F. R. Tang, “Fractal properties of epileptic field potentials recorded from the CA1 area of the hippocampus in the mouse model of temporal lobe epilepsy,” presented at 28th International Epilepsy Congress, Budapest, Hungary, 2009.
[8] B. Weiss, I. Ulbert, and L. Erőss, “Fractal properties of epileptic local field potentials recorded from different layers of the frontal cortex using a chronically implanted laminar microelectrode in humans,” in 4th International IEEE EMBS Conference on Neural Engineering, Antalya, Turkey, 2009, pp. 498-501.
[9] B. Weiss, Z. Vágó, R. Tetzlaff, and T. Roska, “Long-range dependence of long-term continuous intracranial electroencephalograms for detection and prediction of epileptic seizures,” in International Symposium on Nonlinear Theory and its Applications, Budapest, Hungary, 2008, pp. 704-707.
[10]B. Weiss, Z. Vágó, R. Tetzlaff, P. Halász, and T. Roska, “Comparison of self-similar properties of epileptic seizures of mesiotemporal/hippocampal and neocortical origin,” in 8th European Congress on Epileptology, Berlin, Germany, 2008, p. 203.
[11]B. Weiss, B. Hegedűs, Z. Vágó, and T. Roska, “Fractal spectra of intracranial electroencephalograms in different types of epilepsy,” in 19th International EURASIP Conference Biosignal, Brno, Czech Republic, 2008, pp. ID 115, 1-5.
[12]L. Gerencsér, C. Matias, Z. Vágó, B. Torma, and B. Weiss, “Self- exciting point processes with applications in finance and medicine,” in 18th International Symposium on Mathematical Theory of Networks and Systems, Blacksburg, Virginia, 2008.
[13]B. Weiss, Z. Vágó, and T. Roska, “Epileptic seizure prediction and detection based on Hurst parameter estimation,” presented at IX Workshop on Neurobiology of Epilepsy, Langkawi, Malaysia, 2007.
[14]B. Weiss, Z. Vágó, and T. Roska, “Long-range dependence of epileptic seizures,” in 3rd International Workshop on Seizure Prediction in Epilepsy, Freiburg, Germany, 2007, p. 36.
Selected publications cited in the dissertation
[15] K. Linkenkaer-Hansen, V. Nikouline, J. Palva, and R. Ilmoniemi,
“Long-range temporal correlations and scaling behavior in human brain oscillations,” J Neurosci, vol. 21, no. 4, pp. 1370-7, Feb 2001.
[16] P. Bak, C. Tang, and K. Wiesenfeld, “Self-organized criticality,” Phys Rev A, vol. 38, no. 1, pp. 364-374, Jul 1988.
[17] P. Bak, How nature works: the science of self-organized criticality.
Oxford: Oxford University Press, 1997.
[18] J. B. Bassingthwaighte, L. S. Liebovitch, and B. J. West, Fractal physiology. New York: Oxford University Press, 1994.
[19] A. L. Barabási and H. E. Stanley, Fractal concepts in surface growth.
Cambridge: Cambridge University Press, 1994.
[20] P. Bak, C. Tang, and K. Wiesenfeld, “Self-organized criticality: An explanation of the 1/f noise,” Phys Rev Lett, vol. 59, no. 4, pp. 381-384, Jul 1987.
[21] V. Nikulin and T. Brismar, “Long-range temporal correlations in electroencephalographic oscillations: Relation to topography, frequency band, age and gender,” Neuroscience, vol. 130, no. 2, pp. 549-58, 2005.
[22] M. Shadlen and W. Newsome, “The variable discharge of cortical neurons: implications for connectivity, computation, and information coding,” J Neurosci, vol. 18, no. 10, pp. 3870-96, May 1998.
[23] Y. Shu, A. Hasenstaub, and D. McCormick, “Turning on and off recurrent balanced cortical activity,” Nature, vol. 423, no. 6937, pp.
288-93, May 2003.
[24] D. Chialvo and P. Bak, “Learning from mistakes,”Neuroscience, vol.
90, no. 4, pp. 1137-48, 1999.
[25] J. Beggs and D. Plenz, “Neuronal avalanches in neocortical circuits,” J Neurosci, vol. 23, no. 35, pp. 11167-77, Dec 2003.
[26] V. Nikulin and T. Brismar, “Long-range temporal correlations in alpha and beta oscillations: effect of arousal level and test-retest reliability,” Clin Neurophysiol, vol. 115, no. 8, pp. 1896-908, Aug 2004.
[27] T. Bojić, A. Vuckovic, and A. Kalauzi, “Modeling EEG fractal dimension changes in wake and drowsy states in humans--a preliminary study,” J Theor Biol, vol. 262, no. 2, pp. 214-22, Jan 2010.
[28] K. Linkenkaer-Hansen, V. Nikulin, J. Palva, K. Kaila, and R.
Ilmoniemi, “Stimulus-induced change in long-range temporal correlations and scaling behaviour of sensorimotor oscillations,” Eur J Neurosci, vol. 19, no. 1, pp. 203-11, Jan 2004.
[29] L. Poupard, R. Sartène, and J. Wallet, “Scaling behavior in beta-wave amplitude modulation and its relationship to alertness," Biol Cybern, vol. 85, no. 1, pp. 19-26, Jul 2001.
[30] J. M. Lee, D. J. Kim, I. Y. Kim, K. S. Park, and S. I. Kim, “Nonlinear- analysis of human sleep EEG using detrended fluctuation analysis,” Med. Eng. Phys., vol. 26, no. 9, pp. 773-776, Nov 2004.
[31] S. Leistedt, M. Dumont, N. Coumans, J. Lanquart, F. Jurysta, and P.
Linkowski, “The modifications of the long-range temporal correlations of the sleep EEG due to major depressive episode disappear with the status of remission,” Neuroscience, vol. 148, no. 3, pp. 782-93, Sep 2007.
[32] S. Leistedt, M. Dumont, J. P. Lanquart, F. Jurysta, and P. Linkowski,
detrended fluctuation analysis,” Clinical Neurophysiology, vol. 118, no.
4, pp. 940-50, Apr 2007.
[33] Q. L. Ma, X. B. Ning, J. Wang, and C. H. Bian, “A new measure to characterize multifractality of sleep electroencephalogram,”Chin. Sci.
Bull., vol. 51, no. 24, pp. 3059-3064, Dec 2006.
[34] E. Pereda, A. Gamundi, R. Rial, and J. González, “Non-linear behaviour of human EEG: fractal exponent versus correlation dimension in awake and sleep stages,”Neurosci Lett, vol. 250, no. 2, pp. 91-4, Jul 1998.
[35] Y. Shen, E. Olbrich, P. Achermann, and P. F. Meier, “Dimensional complexity and spectral properties of the human sleep EEG,”Clinical Neurophysiology, vol. 114, no. 2, pp. 199-209, Feb 2003.
[36] R. Acharya, O. Faust, N. Kannathal, T. Chua, and S. Laxminarayan,
“Non-linear analysis of EEG signals at various sleep stages,” Computer Methods and Programs in Biomedicine, vol. 80, no. 1, pp. 37-45, Oct 2005.
[37] L. Parrino, M. Boselli, M. Spaggiari, A. Smerieri, and M. Terzano,
“Cyclic alternating pattern (CAP) in normal sleep: polysomnographic parameters in different age groups,” Electroencephalogr. Clin.
Neurophysiol., vol. 107, no. 6, pp. 439-50, Dec 1998.
[38] M. Terzano, L. Parrino, and M. Spaggiari, “The cyclic alternating pattern sequences in the dynamic organization of sleep,” Electroencephalogr. Clin. Neurophysiol., vol. 69, no. 5, pp. 437-47, May 1988.
[39] M. Terzano, D. Mancia, M. Salati, G. Costani, A. Decembrino, and L.
Parrino, “The cyclic alternating pattern as a physiologic component of normal NREM sleep,” Sleep, vol. 8, no. 2, pp. 137-45, 1985.
[40] T. Nguyen-Ky, P. Wen, and Y. Li, “Theoretical basis for identification of different anesthetic states based on routinely recorded EEG during operation," Comput Biol Med, vol. 39, no. 1, pp. 40-5, Jan 2009.
[41] C. Lin, et al., “Development of wireless brain computer interface with embedded multitask scheduling and its application on real-time driver's drowsiness detection and warning,” IEEE Trans Biomed Eng, vol. 55, no. 5, pp. 1582-91, May 2008.
[42] C. E. Elger, “Future trends in epileptology,” Curr Opin Neurol, vol. 14, no. 2, pp. 185-6, Apr 2001.
[43] F. Mormann, R. Andrzejak, C. Elger, and K. Lehnertz, “Seizure prediction: the long and winding road,”Brain, vol. 130, no. Pt 2, pp.
314-33, Feb 2007.