Additive Manufacturing 46 (2021) 102030
Available online 2 June 2021
2214-8604/© 2021 The Author(s). Published by Elsevier B.V. This is an open access article under the CC BY-NC-ND license
(http://creativecommons.org/licenses/by-nc-nd/4.0/).
Fabrication of 3D printed nanocomposites with electrospun nanofiber interleaves
Haijun He
a, Kolos Moln ´ ar
a,b,*aDepartment of Polymer Engineering, Faculty of Mechanical Engineering, Budapest University of Technology and Economics, M˝uegyetem rkp. 3, H-1111 Budapest, Hungary
bMTA-BME Research Group for Composite Science and Technology, M˝uegyetem rkp. 3, H-1111 Budapest, Hungary
A R T I C L E I N F O Keywords:
PLA Electrospun nanofibers 3D printing Interleaves Mechanical properties
A B S T R A C T
The incorporation of nanomaterials into polymer melts has been widely studied in recent years with the aim of improving the mechanical properties of 3D printed products. But it is still challenging, due to the poor dispersion of additives and the difficult processability of the resulting high-viscosity material. Here, we propose a novel fabrication process to enhance the mechanical properties of the 3D printed structure, and to overcome the above- mentioned issues. It is a method based on fused filament fabrication 3D printing with the application of nanofiber interleaves. We used poly (lactide acid) (PLA) both for producing nanofibers by electrospinning and for preparing 3D printing filaments by extrusion. The nanofiber mat (interleave) was placed between two printed layers during the printing process. We systematically studied the morphology of nanofibers at the interlaminar interface and found that nozzle temperature was the essential parameter that affected the adhesion between the nanofiber interleaves and the printed layers. We varied nanofiber content to study its effect on the mechanical properties of nanocomposites. With the integration of nanofibers, nanocomposites obtained improvements in storage modulus and tensile strength.
1. Introduction
3D printing has been attracting a great deal of attention in recent years because it can create objects layer by layer with satisfactory geometric accuracy [1]. One of the commonly used methods is fused filament fabrication (FFF) because of its easy operation and high ma- terial utilization. FFF 3D printed objects can be used in many application fields, e.g. in the aerospace [2] and construction industries [3], art and education [4], and medical fields [5].
However, most 3D printed polymer products have limited mechan- ical strength, which restricts their industrial application [6]. During 3D printing, the melt solidifies at a high cooling rate, which results in less crystallinity in polymer materials, and this leads to lower strength of the printed objects. In the cooling process, the random polymer chains do not have enough time to arrange themselves into an ordered structure within a short time [7]. Besides, the presence of voids and structural weakness between the printed struts are the limiting factors in practical applications. Instead of modifying the printing parameters to reduce the structural weakness and decrease anisotropy, incorporating additives is
an alternative approach to improve the mechanical properties of the printed objects. For instance, crosslinkers can be swabbed between the printed layers to form interlayer covalent bonds, increasing interlayer adhesion [8].
A large number of studies have been published on adding re- inforcements to the polymer melt to fabricate 3D printed composites.
Particles [9], nanomaterials [10,11], and fibers [12] are commonly used as reinforcements in printing composites. Carbon nanotubes [13], gra- phene [14], graphite [15] and ceramic nanoparticles [16] are most often used for this purpose. Weng et al. printed acrylonitrile butadiene styrene (ABS) nanocomposites with organically modified montmorillonite (OMMT), and the addition of 5 wt% OMMT improved the tensile strength of 3D printed ABS samples by 43% [10]. However, the addition of nanoparticles can result in the low flowability or high viscosity of the printing melt, which leads to poor interfacial adhesion between the printed struts and makes printing difficult. Fiber-reinforced composites can achieve significant improvement in mechanical properties. FFF is also a widespread 3D printing technique for printing fiber-reinforced composites. Tekinalp et al. [17] reported that the tensile strength and
* Corresponding author at: Department of Polymer Engineering, Faculty of Mechanical Engineering, Budapest University of Technology and Economics, M˝uegyetem rkp. 3, H-1111 Budapest, Hungary.
E-mail address: molnar@pt.bme.hu (K. Moln´ar).
Contents lists available at ScienceDirect
Additive Manufacturing
journal homepage: www.elsevier.com/locate/addma
https://doi.org/10.1016/j.addma.2021.102030
Received 11 January 2021; Received in revised form 9 March 2021; Accepted 1 May 2021
modulus of FFF printed ABS/carbon composites increased by 115% and 700% (with addition of 40 wt% fiber), respectively. However, they are vulnerable to fracture during the printing process. Thus, extra additives have to be used to help produce continuous filaments [18]. Although fiber content is a crucial factor in affecting the mechanical properties of printed parts, higher fiber content can also clog the nozzle. Generally, all the approaches mentioned above for FFF are facing a common challenge
—to ensure the homogenous dispersion of fibers and additives in the printing polymer melt, which is essential for printing high-performance products. To prevent aggregation of short fibers in the polymer matrix, continuous fibers were employed for printing [19]. Matsuzaki et al. [20]
3D printed fiber-reinforced PLA composites with continuous carbon fi- bers. The tensile modulus and strength of printed composites increased by 6 times and 4.4 times, respectively, compared with pure PLA speci- mens. However, irregularity and discontinuity still existed in the printed samples [21].
Nanofibers have been widely used as reinforcements/interleaves to improve the mechanical properties of composites and prevent delami- nation in composites due to their special properties, e.g., large aspect ratio, high specific surface area, and high porosity [22–26]. In addition, the electrospun nanofiber mat can be easily placed between reinforce- ment plies during the production of composites, resulting in a fine dis- tribution of nano-scale fillers [27, 28]. It is a major advantage of making composite reinforced with nanofillers. Subagia et al. [29] interleaved electrospun polyurethane (PU) nanofibers loaded with carbon nano- tubes (CNT) between layers of basalts fibers (BFs) laminated with epoxy resin. The results showed that the composites containing PU nanofibers with 3% CNT has the highest enhancement (13%) in tensile strength compared with the neat BF/epoxy composite. Aljarrah et al. [30] re- ported that the combination of nylon nanofibers can lead to a 25%
improvement in interlaminar fracture toughness of carbon fiber/epoxy laminates when a nanofiber mat is inserted as an interlayer between the carbon fabric plies. Sharifi et al. [31] also concluded that the incorpo- ration of electrospun polyacrylonitrile (PAN) nanofibers between car- bon fiber fabric layers is an effective approach to enhancing the mechanical properties of laminated polymer matrix composites. Tian et al. [32] integrated nanofibers into three-dimensional (3D) textile structure-reinforced composites to enhance the properties of compos- ites. They prepared nanofiber-sheathed BF (SBF) yarns that can increase the interfacial shear stress of the BF composites by 33%. However, there are few studies on nanofiber mats as interleaves between 3D printed layers to increase the mechanical performance of 3D printed materials.
Polylactide acid (PLA) is one of the most common materials for FFF due to its easy processability [33]. It is also a desirable material because it is an agricultural-based plastic, and mainly composed of vicinal and regularly distributed polar ester groups [34]. Not only can it be naturally produced from corn starch, but it can also be easily biodegraded in soil [35,36]. The good adhesion between the nanofibers and the printed melt are prerequisites for making composites with sufficient mechanical performance. They are not only influenced by the printing parameters but also governed by material compatibility. An alternative approach to improve adhesion is to make self-reinforced composites in which the polymer matrix is reinforced with fibers of the same polymer as the matrix material [37–39]. It has been reported that good adhesion can be achieved when the PLA struts are deposited onto a PLA fabric. It can be explained with high-efficiency diffusion of the extruded filament into the fabric due to their similar functional groups, which are favorable for the polymer-polymer interaction at the interface boundary [40].
In literature, it has been demonstrated that the composite structures fabricated by combination of 3D printing and electrospinning have great potential to be used in applications, such us filtration [41–43] and tissue engineering [44]. However, there are few studies to investigate how the nanofibers can be used as reinforcements in the 3D printed structures. In this study, we developed 3D printed PLA composites with PLA nanofiber interleaves to improve the mechanical properties of 3D printed prod- ucts. We systematically investigated the effects of the process
parameters (i.e., nozzle temperature, bed temperature, infill density) by interlaminar shear tests, SEM and FTIR. We also prepared different nanocomposites with different nanofiber contents. The thermal and mechanical properties of the PLA nanocomposites were studied with DSC, DMA, and tensile tests.
2. Materials and methods 2.1. Materials
Poly (lactic acid) (PLA) with 5% of D-lactic acid monomer was ob- tained from NatureWorks LLC (USA) with the trade name of Ingeo 3100 HP (Mw =140,000 g/mol). We dissolved PLA pellets in a mixture of chloroform and N, N-dimethyl formamide (DMF) (9:1 wt) to prepare a 10 wt% solution for electrospinning. The solution was stirred at 250 rpm at 50 ◦C for 10 h by a magnetic stirrer. Then the solution was rested for 24 h. DMF and chloroform were purchased from Azur Chemicals (Hungary).
2.2. Sample preparation 2.2.1. Nanofiber mat preparation
For electrospinning, we used a single-needle electrospinning unit that we designed and built. Electrospinning was carried out with the following parameters: voltage was 25 kV, nozzle diameter was 0.51 mm, and the collecting distance between the needle and the collector was 20 cm. A 20 ml syringe was full of the 10 wt% PLA solution, and it was controlled with a pump (Aitecs SEP-10S plus, Lithuania) to supply the solution at a constant feeding rate of 0.3 ml/h during the electrospinning process. The high voltage was provided with a high voltage supply (MA2000 NT 75/P, Hungary). Nanofiber mats were collected on an aluminum foil covering a rotating drum (diameter: 70 mm, rotation speed: 200 rpm). The amount of nanofibers to be interleaved was controlled with electrospinning time. We collected electrospun nano- fibers for 5 min, 10 min, and 15 min accordingly. When nanofibers are collected more than for 15 min, the nanofiber interleave is too thick to be penetrated by the printed polymer melt, which leads to delamination.
2.2.2. Preparation of filaments
Filaments were produced by extrusion from the same PLA as was used in electrospinning. We dried the PLA pellets at 80 ◦C for 12 h before the extrusion process. After drying, the PLA pellets were fed into a lab- scale twin-screw extruder (LTE 26-44, Labtech Engineering, Thailand), with a screw diameter of 26 mm, and a length/diameter ratio of 44.
During the extrusion process, the feed temperature (the first zone of the ten zones of the extruder) and die temperature were set to 165 ◦C and 185 ◦C, respectively. Screw rotation speed was set to 16 rpm, to match the traction system to produce filaments with a standard diameter of 1.75 mm for the printing process.
2.2.3. Nanocomposite fabrication by FFF
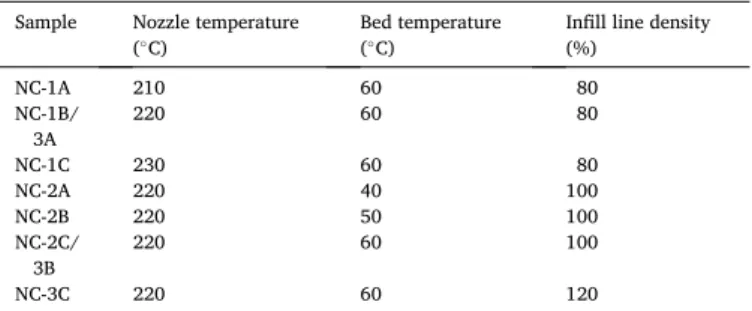
In the 3D printing process, nozzle temperature, bed temperature, infill density, and printing distance are the significant factors that in- fluence the properties of FFF 3D printed parts. In the present study, we chose three parameters (nozzle temperature (210 ◦C, 220 ◦C, 230 ◦C), bed temperature (40 ◦C, 50 ◦C, 60 ◦C), infill line density (80%, 100%, 120%)) to examine their effects on interfacial adhesion. Printing dis- tance was not included because it is difficult to adjust precisely.
Therefore, we used a constant nozzle (printing) distance (~ 0.2 mm) in all the printing processes. In all the cases, the filament was processed with a CraftBot Plus (CraftUnique, Hungary) 3D printer with a nozzle diameter of 0.4 mm. Layer height and the printing speed were kept 0.2 mm and 50 mm/s, respectively, for all the experiments. The detailed preparation process of the 3D printed nanocomposite is shown in Fig. 1a.
To interleave the nanofiber mat between printed layers properly with strong bonding, we adopted a three-step process for nanocomposite
Additive Manufacturing 46 (2021) 102030
preparation as shown in Fig. 1b: (1) the first layer of the matrix was printed on a nanofiber mat covering the aluminum foil which was glued on the printing bed; (2) when the first layer was printed entirely, the nanofiber mat was bonded with this first printed layer, and then it was peeled off the foil easily; (3) the specimen was turned upside down, and put back at the same position, then the second layer of the matrix was printed and identically overlapped onto the other side of the nanofiber layer. In this way, a 3D printed composite with nanofiber interleaves is fabricated.
2.3. Characterization 2.3.1. Morphological analysis
A scanning electron microscope (SEM, JEOL 6380 LA, Japan) was used to show the morphology of the nanofibers and the cross-sections of the composites. Each sample was covered with a gold-palladium (Au/
Pd) alloy before the examination to enable conductivity. 100 random fibers were measured with the Image J software in each sample, for the calculation of the diameter distributions.
2.3.2. In-plane shear strength test
There are no standard test methods for measuring interfacial adhe- sion between layers printed by FFF. Here, we conducted an interlaminar shear test to measure the in-plane shear strength of the nanocomposite fabricated by FFF, according to the ASTM D3846-08 standard. Fig. 2a depicts the dimensions of the double-notched specimen for the inter- laminar shear test. The two notches (with a depth of 1.4 mm each) were
cut on the printed nanocomposite, which has a sandwich structure, as shown in Fig. 2c. We performed tests slightly differently from the ASTM D3846-08 standard, to measure the shear strength of the 3D printed specimens—we used the tensile stretching force instead of a compressive Fig. 1.(a) The preparation process of the 3D printed nanocomposite from raw material; (b) the detailed procedure to combine the nanofiber mat with the prin- ted matrix.
Fig. 2.(a) Specimen geometry for the double notch shear test, (b) the half matrix and nanofiber mat, (c) the double notch specimen.
H. He and K. Moln´ar
force. The tests were carried out with a Zwick Z005 (Zwick Roell, Ger- many) machine with a 5 kN load cell. The crosshead speed and the gauge length were set to 1.3 mm/min and 50 mm, respectively. Five specimens from each group were tested.
2.3.3. Thermal camera measurements
A thermal camera (A325sc, FLIR Systems Inc., Wilsonville, OR) was mounted over the 3D printer to record the temperature of the melt deposited onto the nanofiber mat. We chose a depositing spot in the printing area. The temperature at the desired spot was recorded continuously with the thermal camera until the temperature of the melt dropped to the bed temperature.
2.3.4. Fourier-Transform Infrared spectra
We performed Fourier-Transform infrared spectroscopy (FTIR) measurements to examine the presence of hydrogen bonding between the nanofibers and printed layers. An FTIR spectrometer (Tensor II, Bruker, Germany) in ATR mode equipped with a diamond crystal was used for the tests. All the spectra were recorded in absorbance mode with 4 cm-1 resolution in the range of 4000 cm-1 - 400 cm-1.
2.3.5. Differential scanning calorimetry
A DSC-Q200 (TA Instruments, USA) Differential scanning calorim- etry (DSC) was used to measure the thermal properties of the nano- composites. All the samples were in a sealed aluminum pan and weighed around 5 mg. The samples were subjected to heating/cooling/heating cycles in the temperature range of 25◦C–200◦C. The heating/cooling rate was set to 5◦C/min. The crystallinity of nanocomposites (χc) was calculated by (1)
χc(%) = (ΔHmΔHc)/ΔHm0 ×100 (1) Where ∆Hm0 is the melting enthalpy for 100% crystalline PLA (93 J/g) [45]. ∆Hm and ∆Hc are the melting enthalpy and cold crystallization enthalpy for the printed matrix, respectively.
The theoretical degree of crystallinity of the nanocomposites (χt) was calculated with the rule of mixtures. In general, for the crystallinity of nanofiber-reinforced composites, the rule of mixtures states that the overall crystallinity of the nanocomposite may be calculated as (2):
χt=wf×χf+ (1− wf) ×χp (2)
where wf is the nanofiber mass content of the nanocomposite, χp is the crystallinity of the printed matrix, and χf is the crystallinity of the nanofibers.
2.3.6. Dynamic thermomechanical analysis
Dynamic thermomechanical analysis (DMA) was performed with a DMA-Q800 (TA Instruments, USA) in tensile mode with a heating rate of 2◦C/min. The rectangular specimens with the dimension of 30 mm×10 mm×0.4 mm were mounted with a gripping distance of 10 mm, and the test temperature was between room temperature and 150◦C.
2.3.7. Tensile testing
A Zwick Z005 (Zwick Roell, Germany) tensile tester with a 5 kN load cell was used to examine the tensile properties of the nanocomposites with different nanofiber contents (2.4%, 6.5% and 10.1%). All the nanocomposite specimens had a rectangular shape (30 mm×10 mm×0.4 mm). The crosshead speed and the gauge length were set to 10 mm/min and 10 mm, respectively. Three speci- mens from each nanofiber content were tested. Young’s modulus was calculated by linear regression of the stress-strain curve in a small strain range (1.5%~2.5%).
3. Results and discussion
3.1. Morphology of nanofibers after printing
The effects of the printing parameters on their morphology were investigated by SEM according to the experimental design presented in Table 1.
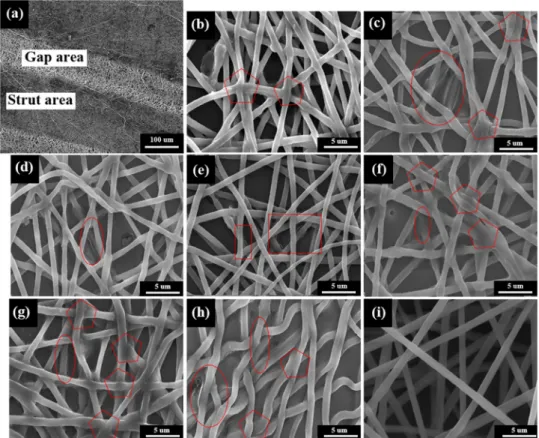
Fig. 3a shows the structure of the nanofibers after the printing on the back of the structure. There are two different stripes. The dark area is the place where the printed struts were located, i.e., the strut area. The lighter area is the gap between the adjacent printed struts. Fig. 3b-h mainly shows nanofiber morphology in the strut area with different printing parameters. The results indicate that the nanofibers were not melted and kept their original fiber morphology through the printing process. When nozzle temperature was adjusted, the nanofiber mat structure in the strut area underwent some changes (Fig. 3b-d). There were fused junctions at the inter-fiber contact points indicated with pentagons due to intense heat dissipation from the printed struts and the printing bed. Interfacial bonding between the nanofibers and the printed struts was found when the nozzle temperature was more than 220◦C (Fig. 3c-d), which were indicated with ellipses. However, we cannot find evidence of interfacial bonding caused by the melt in the samples printed at 210◦C, showing that high nozzle temperature can facilitate interfacial adhesion due to the low viscosity of the polymer melt at high temperatures during the printing process.
NC-2A, NC-2B and NC-2C samples were processed at different bed temperatures. Nanofiber morphology is shown in Fig. 3e-g. When bed temperature was higher than 40◦C, we observed fused junctions and interfacial bonding as shown in Fig. 3f-g. In contrast, it is visible in Fig. 3e that there existed voids between the nanofibers and the printed struts, marked with rectangles, suggesting poor adhesion. Therefore, an increase in bed temperature can help adhesion. As bed temperature in- creases, the printed struts have lower viscosity and more time to fuse with the nanofiber mat.
We also investigated the effect of infill density between 80% and 120%. According to the manual, the software takes the distance between the adjacent filler lines when calculating density. The 100% density setting means that the distance of the lines equals the diameter of the nozzle. Therefore, 100% density means an infill of approximately 78.5 vol%, while 120% density indicates an infill of 94 vol%. In Fig. 3c, g and h, fused junctions and interfacial bonding can also be observed for all the samples. We found that at 120% infill density, the nanofibers became coiled, and had even better interfacial bonding and greater penetration of the strut into the mat (Fig. 3f). As infill density increases, which means more filament consumption and closer distance between adjacent struts, more heat is dissipated between the nanofibers and the printed struts, which improves bonding.
3.2. Fracture morphology analysis of the de-bonded specimen
We prepared the specimens with different printing parameters for the interlaminar shear test to quantitatively evaluate the effects of the Table 1
Experimental design for the investigation of parameters.
Sample Nozzle temperature
(◦C) Bed temperature
(◦C) Infill line density (%)
NC-1A 210 60 80
NC-1B/
3A 220 60 80
NC-1C 230 60 80
NC-2A 220 40 100
NC-2B 220 50 100
NC-2C/
3B 220 60 100
NC-3C 220 60 120
Additive Manufacturing 46 (2021) 102030
printing parameters on bonding strength. However, the results showed that there were only three NC-1A specimens (210◦C) de-bonded at the overlapping section between the two notches where the nanofiber mat was interleaved (Fig. 4a). The specimens from other groups did not suffer shear failure at the interleaving surface. Therefore, we could not directly compare the shear strength (bonding strength) of
nanocomposites printed with different parameters. But we can conclude that bonding strength was the worst when the printing temperature was 210◦C. It is also in agreement with the nanofiber morphology shown in Fig. 3b, where there was no observable interfacial bonding due to the low nozzle temperature. As shown in Fig. 4a, the de-bonded surface of NC-1A was relatively smooth, and Fig. 4b shows the microstructure of Fig. 3. (a) Microstructure of a 3D printed nanocomposite; Morphology of nanofibers on the strut area from different samples: (b) NC-1A (210◦C), (c) NC-1B/3 A (220◦C), (d) NC-1C (230◦C), (e) NC-2A (40◦C), (f) NC-2B (50◦C), (g) NC-2C/3B (60◦C), (h) NC-3C (120%); (i) morphology of nanofibers at the gap area of NC-1A.
Pentagons indicate fiber fusion, Ellipses show nanofiber–strut fusion, Rectangles indicate voids.
Fig. 4. The optical image of the failure surface of NC1 (a) and SEM images of local failure with different magnifications (b) 30, (c) 2000, (d) 1000.
H. He and K. Moln´ar
the nanofiber mat on the printed layers. Nanofiber morphology can still be observed in the enlarged SEM image (Fig. 4d), which also shows that some nanofibers got suspended between the gap of the adjacent printed struts keeping their original structure. However, the nanofibers on the struts were completely broken, and there were lots of broken fiber ends indicated with circles, as shown in Fig. 4c. Furthermore, there was not even apparent melt penetration around the broken nanofibers. On the one hand, it is because the bonding of the fibers within the nanofiber mat was not strong enough to bear the load force; on the other hand, it can confirm the strong adhesion between the nanofiber mat and the printed layer because there were not any pulled-out nanofibers or interfacial slippage. The results indicate that the printed polymer melt could not penetrate the nanofiber mat when nozzle temperature was 210◦C, which deteriorated the bonding between the printed layers. Still, interface bonding between the nanofiber mat and printed struts was strong enough.
3.3. The effect of nozzle temperature
After the investigation of the effect of printing parameters on nanofiber morphology and bonding adhesion, we concluded that low nozzle temperature was not beneficial for strong physical bonding adhesion due to poor melt penetration, and bed temperature and infill rate did not have major effects. Therefore, we analyzed the samples fabricated with variable nozzle temperatures by FTIR and DSC to examine the effects of nozzle temperature on hydrogen bonding and the thermal properties of nanocomposites.
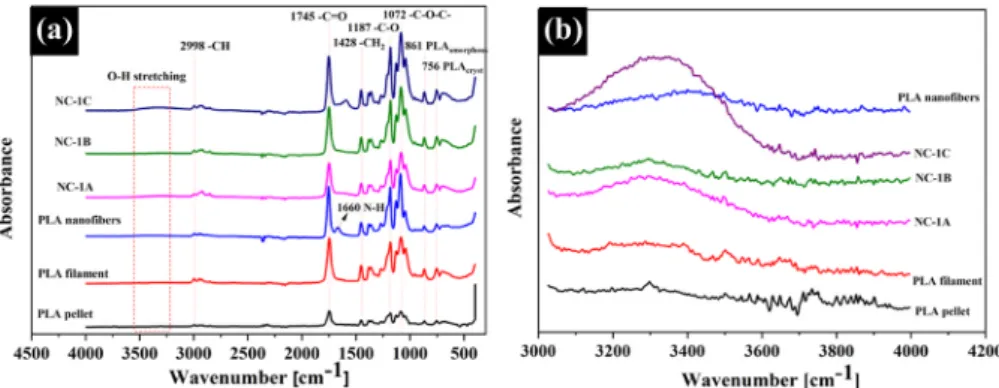
In the FTIR test, we compared the neat PLA pellets, the filament, and the nanofibers with the specimens printed with different nozzle tem- peratures, as shown in Fig. 5. Fig. 5a shows that the spectra of all the samples had similar characteristic peaks, including the –C–H stretch- ing modes between 2998-2847 cm-1, the –C=O stretching band at 1745 cm-1, the ester –C–O– symmetric stretching at 1187 cm-1, and –C–O–C– asymmetric stretching at ~1072 cm-1 [46]. The peak at 1428 cm-1 is related to the CH2 bending vibrations. The peak at 861 cm-1 and 756 cm-1 was identified as the amorphous and crystalline part of PLA, respectively [47]. The peak at 1660 cm-1 corresponding to –NH bending was only found in the case of the PLA nanofibers, which is attributed to the residual DMF. When the nanofiber mat was incorpo- rated with 3D printed layers during the printing process, the residual DMF evaporated because of heat dissipation. It is the reason why there was no N–H peak at the same wavelength in the spectra of printed nanocomposites. Fig. 5b is the enlarged spectra in the region of 3000–4000 cm-1 where O–H stretching was located. It is noticeable that the peak at 3300 cm-1 becomes stronger and broader with increasing nozzle temperature, indicating the formation of more and more hydrogen bonds between the nanofibers and the printed layers. The same band associated with the hydrogen bonding of PLA spectra was also reported in the literature [48,49].
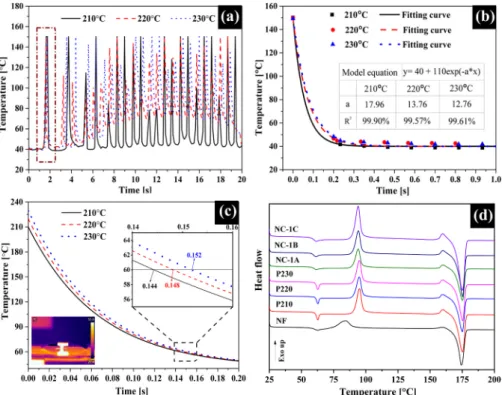
Fig. 6d shows the DSC results of nanofibers (NF), as-printed PLA (P),
and printed nanocomposites (NC) with different nozzle temperatures.
The effect of nozzle temperature on the thermal properties of the sam- ples was characterized by the glass transition temperature (Tg), the cold crystallization temperature (Tcc), the melting temperature (Tm), and the degree of crystallinity (χ). In all the DSC curves, there was a Tg step/peak (endothermic peak), an exothermic Tcc peak, and an endothermic Tm
peak. The endothermic peak at Tg is related to chain relaxation, named as “enthalpic recovery” [50].
Table 2 shows that nanofibers have a lower Tg and Tcc, but higher χc, compared with the as-printed PLA. The explanation of the difference between Tg and Tcc is that the solidification of the polymer melt from the extrusion process is considerably faster than solvent evaporation in the electrospinning process. When the cooling rate is high, PLA does not have enough time for complete crystallization since it has very slow crystallization kinetics. The rapid solidification rate might result in less oriented polymer chains, suggesting higher Tg and Tcc, and lower χc. There are no significant changes in the thermal properties of the as- printed PLA samples (P210, P220, P230) printed with different nozzle temperatures. They have similar Tg (~ 61.7◦C), Tcc (~ 94.9◦C), and χc (~ 36.3%). What is more, nozzle temperature did not show a significant influence on the thermal properties of the nanocomposites interleaved with nanofibers, either. Therefore, we conclude that nozzle temperature did not have substantial effects on the thermal properties of the printed samples.
To further verify the conclusion, we recorded the cooling of the struts during the printing in-situ with a thermal camera. Fig. 6a shows the temperature profile of the selected spot during the entire printing pro- cess (each peak means the nozzle passed over the selected spot once). We only evaluated the first cooling peak because the temperature of the first printed strut is not influenced by any neighboring struts. Because of the limitations of the thermal camera (the maximum recorded temperature was only 150◦C), we needed to extrapolate the cooling process to the printing temperature (210◦C, 220◦C, 230◦C) with Newton’s law of cooling. Fig. 6b shows the model fitting results. We obtained the “a”
constant of the formula, which determines the cooling rate and is only related to the printing environment. Because all the printing processes were performed in the same lab with the same printer, we assumed that the value of a should be the same for all the printing processes. There- fore, we took the average value of “a”, which was calculated from three printing processes with different temperatures (210◦C, 220◦C, 230◦C), and used it in the model for extrapolation. Fig. 6c shows the extrapolated cooling curve from various printing temperatures down to 60◦C. We found that the cooling time from the different nozzle temperatures to Tg
(60◦C) was very close to each other—the difference was less than 5 ms, which might not influence the crystallization process significantly, especially for PLA, which has a very slow crystallization speed [51].
However, compared with the as-printed PLA, the Tg and Tcc peak of the nanocomposites were both shifted a bit towards lower temperatures, as shown in Fig. 6d. Besides, we observed that the χc values of the nanocomposites were higher than that of the as-printed PLA specimens.
Fig. 5.FTIR spectra of PLA pellets, filaments, nanofibers, and printed nanocomposites: (a) whole spectra; (b) details of the 3000–4000 cm-1 region.
Additive Manufacturing 46 (2021) 102030
The nanofibers, with their substantial specific surface, can act as excellent nucleating agents leading to a higher degree of crystallinity via heterogeneous nucleation. It has been reported that nanofillers or nanodomains have high nucleating efficiency [52]. Furthermore, the Tcc
peak of the nanofibers disappeared in the nanocomposites, and it is attributed to the heat dissipation from the printer bed and the deposition of the printed melt, which annealed the nanofibers and facilitated crystallization. In the following section, we analyzed this more in detail.
3.4. The effect of nanofiber content
Based on the investigation of nozzle temperature, we found that the addition of nanofibers to the printed PLA can enhance the degree of crystallinity of the printed matrix via heterogeneous nucleation.
Therefore, we investigated the effects of nanofiber content in the nanocomposites on the degree of crystallinity, the tensile mechanical properties, and thermal mechanical properties. The printed nano- composites with different nanofiber contents are shown in Fig. 7.
The DSC curves of PLA nanocomposite and neat PLA specimens are shown in Fig. 8a. All the curves distinctly present cold crystallization and melting peaks at 94–95◦C and at 175–176◦C, respectively. The χc of nanocomposites was higher than the χc of the neat PLA (Fig. 8b). The nanocomposite with 6.5% NF has the highest χc value of 41.35%. χc is
around 5% higher than that of neat PLA. Also, theoretical χt was calculated with the rule of mixtures—they were less than the values of χc. These results indicate that the nanofibers can act as a nucleating agent and facilitate the crystallization of the printed PLA melt. However, when nanofiber content was further increased to 10.1%, the crystallinity of nanocomposite decreased to 40.35%. The result implies that when the nanofiber content was increased to a certain extent, it restricted the polymer chain motion of printed melt, which slowed down the crystal- lization rate in the printing process.
Fig. 9 shows the storage modulus (E’) versus temperature curves for the nanocomposites with different nanofiber contents. It is noted that the nanocomposite with 10.1% nanofiber has 10.3% higher E’ compared with that of the neat PLA at 30◦C. It is because the nanofibers can take a certain load from the matrix at a lower temperature with strong bonding adhesion, which improves the mechanical strength of the nanocomposite.
Fig. 10 presents the typical tensile curves of the nanocomposites with different nanofiber contents. The detailed results of their mechanical properties are summarized in Table 3. Young’s modulus of the nano- composites increased as nanofiber content was increased from 2.4% to 10.1%. The results show that a nanofiber content of 10.1 wt% results in the highest Young’s modulus (34.3% higher than that of the neat spec- imen). The enhancement of the Young’s modulus is even greater, than it was reported in the literature for 12% CNT reinforced PLA filament for 3D printing (only 21.2%) [53]. The tensile strength also increased from 55.6 MPa (neat PLA) to 64.8 MPa (10.1% nanofiber content). The re- sults can be explained with the SEM analysis. Fig. 3 shows that nano- fibers were located uniformly without any aggregation and not melted after one-layer printing. Fig. 4c indicated that nanofibers adhered well to the printed layer without fiber pull-outs. Furthermore, elongation increased with the addition of 6.5% and 10.1% NF compared with neat PLA. It is related to the reduced void when nanofibers were incorpo- rated. Though the voids between printed struts cannot be fully filled with nanofibers, nanofibers can be tuned into “bridges” to connect adjacent printed struts and toughen the printed composites. This results Fig. 6. (a)Temperature versus time in the entire sample printing process; (b) the fitting curves with Newton’s law of cooling; (c) the extrapolated cooling curves after printing from nozzle temperatures to the Tg of PLA (60◦C). The inset shows the IR image of the printing process; (d) DSC curves of samples fabricated with different nozzle temperatures.
Table 2
Thermal properties of nanofibers mats, as-printed samples, and printed nanocomposites.
Sample Tg Tcc ∆Hc (J/g) Tm ∆Hm (J/g) χc (%)
NF 60.5 84.6 19.1 174.3 58.1 41.6
P210 61.7 95.0 34.1 175.1 67.9 36.1
P220 61.8 94.9 32.6 175.0 67.7 37.5
P230 61.7 94.9 34.2 175.3 68.8 36.9
NC-1A 59.7 94.0 31.3 175.1 67.6 40.7
NC-1B 59.7 94.2 32.0 175.3 68.2 40.5
NC-1C 59.9 94.1 32.1 175.0 68.5 40.8
H. He and K. Moln´ar
Fig. 7. Photographs of the printed nanocomposites with different nanofibers contents.
Fig. 8. (a) DSC curves of nanocomposites with different nanofiber content; (b) crystallinity of the nanocomposites as a function of nanofiber content.
Fig. 9. Storage modulus curves of nanocomposites with different nano- fiber contents.
Fig. 10. Typical stress-strain curves of the printed nanocomposites with different nanofiber contents.
Additive Manufacturing 46 (2021) 102030
in an increase of the elongation of the printed composites compared with neat specimens.
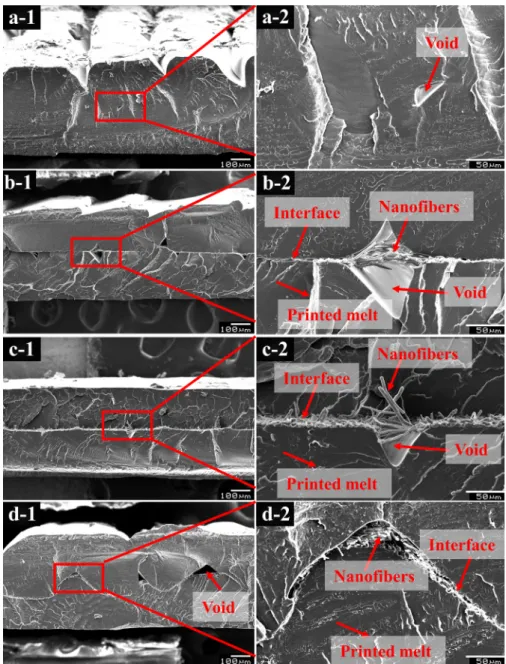
Fig. 11 shows SEM images of the fracture cross-section of the printed nanocomposites at two magnifications. It can be observed that the nanofibers were embedded tightly between two printed layers without any delamination at the interface. Furthermore, the void was filled with nanofibers, leading to different fracture surface morphologies. For example, the surface at the interface was relatively smooth, suggesting sufficient interface adhesion between the nanofibers and the printed layers; however, the surface at the void was fluffy because of breaking
nanofiber ends, which can provide more toughness for the nano- composites. The two breaking phenomena are responsible for the im- provements in tensile strength and elongation at break, which is in agreement with the tensile test results. Additionally, it is evident from the fracture surfaces that the nanofibers interleaved in the 3D printed structure can serve as reinforcement because of the good adhesion at the interface and the nanofiber “bridge” in the void.
4. Conclusion
In summary, we successfully fabricated PLA nanocomposites through electrospinning and FFF 3D printing with the same grade of PLA used both as matrix and reinforcement. The nanofiber mat was interleaved between two printed layers in the 3D printing process, to enhance the mechanical properties of the printed products. Nozzle temperature is a critical printing parameter of the investigated parameters, and it was analyzed by SEM and interlaminar shear tests. There were some voids between the nanofibers and the printed layer in the sample printed at the nozzle temperature of 210◦C, leading to weaker interfacial adhesion.
Therefore, debonding only happed in the samples fabricated at a nozzle Table 3
Tensile mechanical properties of pure PLA and PLA nanocomposites.
Sample Young’s modulus
(GPa) Tensile strength
(MPa) Elongation at break
(%) Neat PLA 0.99 ±0.21 55.6 ±0.1 7.1 ±0.7 2.4% NF 1.20 ±0.08 58.3 ±0.3 6.4 ±0.3 6.5% NF 1.31 ±0.07 61.2 ±5.1 7.2 ±1.6 10.1%
NF 1.33 ±0.09 64.8 ±2.5 7.8 ±0.2
Fig. 11.SEM images of fracture cross-sections of the nanocomposites with different nanofiber contents: (a) neat PLA, (b) 2.4% NF, (c) 6.5% NF, (d) 10.1% NF.
H. He and K. Moln´ar
temperature of 210◦C. Moreover, the FTIR analysis revealed that there was a shoulder peak in the spectrum of all the nanocomposites, sug- gesting that a hydrogen bond was formed at the interface of the PLA nanofibers and the printed matrix. With the incorporation of 6.5%
nanofibers, the degree of crystallinity of the nanocomposites improved to 41%. The test results showed that the nanocomposites had more robust mechanical properties than the neat PLA without nanofibers. The storage modulus of nanocomposites improved by 10.3% at 30◦C when nanofiber content was 10.1%. Meanwhile, the tensile strength also increased from 55.6 MPa (neat PLA) to 64.8 MPa (with nanofiber con- tent of 10.1%). In sum, the PLA 3D printed nanocomposites will have potential in medical applications and tissue engineering because of their biodegradability, good mechanical properties, and satisfactory geo- metric accuracy.
CRediT authorship contribution statement
Haijun He: Conceptualization, Methodology, Investigation, Data curation, Writing - original draft, Funding acquisition. Kolos Moln´ar:
Data curation, Supervision, Writing - review & editing, Funding acquisition.
Declaration of Competing Interest
The authors declare that they have no known competing financial interests or personal relationships that could have appeared to influence the work reported in this paper.
Acknowledgments
The research reported in this paper was supported by the “TKP2020, Institutional Excellence Program” of the National Research Develop- ment and Innovation Office in the field of Nanotechnology and Materials Science (BME IE-NAT TKP2020). It was also supported by the National Research Development and Innovation Office (OTKA FK 131882), the ÚNKP-20-5 New National Excellence Program of the Ministry for Inno- vation and Technology and BME-KKP. This paper was also supported by the J´anos Bolyai Research Scholarship of the Hungarian Academy of Sciences (K. Moln´ar), Stipendium Hungaricum Scholarship of Tempus Public Foundation (SHE-15651-001/2017) (Haijun He), and China Scholarship Council (201700500073) (Haijun He).
References
[1] R. Boros, P. Kannan Rajamani, J.G. Kovacs, Combination of 3D printing and injection molding: overmolding and overprinting, Express Polym. Lett. 13 (10) (2019) 889–897, https://doi.org/10.3144/expresspolymlett.2019.77.
[2] E. Kroll, D. Artzi, Enhancing aerospace engineering students’ learning with 3D printing wind-tunnel models, Rapid Prototyp. J. 17 (5) (2011) 393–402, https://
doi.org/10.1108/13552541111156522.
[3] K.V. Wong, P.A. Paddon, Nanotechnology impact on the automotive industry, Recent Pat. Nanotechnol. 8 (3) (2014) 181–199, https://doi.org/10.2174/
187221050803141027101058.
[4] D.B. Short, Use of 3D printing by museums: educational exhibits, artifact education, and artifact restoration, 3D Print. Addit. Manuf. 2 (4) (2015) 209–215, https://doi.org/10.1089/3dp.2015.0030.
[5] S.V. Murphy, A. Atala, 3D bioprinting of tissues and organs, Nature Biotechnol. 32 (8) (2014) 773–785, https://doi.org/10.1038/nbt.2958.
[6] Y. Chen, X. Wen, M. Nie, Q. Wang, Preparation of polypropylene/glass fiber composite with high performance through interfacial crystallization, J. Vinyl Addit. Technol. 23 (4) (2017) 284–289, https://doi.org/10.1002/vnl.21514.
[7] V. Viswanath, S. Maity, J.R. Bochinski, L.I. Clarke, R.E. Gorga, Thermal annealing of polymer nanocomposites via photothermal heating: effects on crystallinity and spherulite morphology, Macromolecules 46 (21) (2013) 8596–8607, https://doi.
org/10.1021/ma401855v.
[8] S.C. Perryman, M.D. Dadmun, Incorporating crosslinks in fused filament fabrication: molecular insight into post deposition reactions, Addit. Manuf. (2020), https://doi.org/10.1016/j.addma.2020.101746.
[9] S. Christ, M. Schnabel, E. Vorndran, J. Groll, U. Gbureck, Fiber reinforcement during 3D printing, Mater. Lett. 139 (2015) 165–168, https://doi.org/10.1016/j.
matlet.2014.10.065.
[10] Z. Weng, J. Wang, T. Senthil, L. Wu, Mechanical and thermal properties of ABS/
montmorillonite nanocomposites for fused deposition modeling 3D printing, Mater. Des. 102 (2016) 276–283, https://doi.org/10.1016/j.matdes.2016.04.045.
[11] W. Zhang, C. Cotton, J. Sun, D. Heider, B. Gu, B. Sun, T.-W. Chou, Interfacial bonding strength of short carbon fiber/acrylonitrile-butadiene-styrene composites fabricated by fused deposition modeling, Compos. Part B Eng. 137 (2018) 51–59, https://doi.org/10.1016/j.compositesb.2017.11.018.
[12] N. Li, Y. Li, S. Liu, Rapid prototyping of continuous carbon fiber reinforced polylactic acid composites by 3D printing, J. Mater. Process. Technol. 238 (2016) 218–225, https://doi.org/10.1016/j.jmatprotec.2016.07.025.
[13] X. Yan, J. Gu, G. Zheng, J. Guo, A.M. Galaska, J. Yu, M.A. Khan, L. Sun, D.P. Young, Q. Zhang, S. Wei, Z. Guo, Lowly loaded carbon nanotubes induced high electrical conductivity and giant magnetoresistance in ethylene/1-octene copolymers, Polymer 103 (2016) 315–327, https://doi.org/10.1016/j.polymer.2016.09.056.
[14] H. Chen, M.B. Müller, K.J. Gilmore, G.G. Wallace, D. Li, Mechanically strong, electrically conductive, and biocompatible graphene paper, Adv. Mater. 20 (18) (2008) 3557–3561, https://doi.org/10.1002/adma.200800757.
[15] J. Gu, C. Xie, H. Li, J. Dang, W. Geng, Q. Zhang, Thermal percolation behavior of graphene nanoplatelets/polyphenylene sulfide thermal conductivity composites, Polym. Compos. 35 (2013) 1087–1092, https://doi.org/10.1002/pc.22756.
[16] J. Gu, C. Liang, J. Dang, W. Dong, Q. Zhang, Ideal dielectric thermally conductive bismaleimide nanocomposites filled with polyhedral oligomeric silsesquioxane functionalized nanosized boron nitride, RSC Adv. 6 (42) (2016) 35809–35814, https://doi.org/10.1039/c6ra04513h.
[17] H.L. Tekinalp, V. Kunc, G.M. Velez-Garcia, C.E. Duty, L.J. Love, A.K. Naskar, C.
A. Blue, S. Ozcan, Highly oriented carbon fiber–polymer composites via additive manufacturing, Compos. Sci. Technol. 105 (2014) 144–150, https://doi.org/
10.1016/j.compscitech.2014.10.009.
[18] R.W. Gray, D.G. Baird, J.H. Bohn, Effects of processing conditions on short TLCP fiber reinforced FDM parts, Rapid Prototyp. J. 4 (1998) 14–25.
[19] X. Tian, T. Liu, C. Yang, Q. Wang, D. Li, Interface and performance of 3D printed continuous carbon fiber reinforced PLA composites, Compos. Part A Appl. Sci.
Manuf. 88 (2016) 198–205, https://doi.org/10.1016/j.compositesa.2016.05.032.
[20] R. Matsuzaki, M. Ueda, M. Namiki, T.K. Jeong, H. Asahara, K. Horiguchi, T. Nakamura, A. Todoroki, Y. Hirano, Three-dimensional printing of continuous- fiber composites by in-nozzle impregnation, Scientific Rep. 6 (2016) 23058, https://doi.org/10.1038/srep23058.
[21] X. Wang, M. Jiang, Z. Zhou, J. Gou, D. Hui, 3D printing of polymer matrix composites: a review and prospective, Compos. Part B Eng. 110 (2017) 442–458, https://doi.org/10.1016/j.compositesb.2016.11.034.
[22] S.V. Lomov, K. Molnar, Compressibility of carbon fabrics with needleless electrospun PAN nanofibrous interleaves, Express Polym. Lett. 10 (1) (2016) 25–35, https://doi.org/10.3144/expresspolymlett.2016.4.
[23] R. Palazzetti, A. Zucchelli, Electrospun nanofibers as reinforcement for composite laminates materials – a review, Compos. Struct. 182 (2017) 711–727, https://doi.
org/10.1016/j.compstruct.2017.09.021.
[24] R. Zhao, X. Lu, C. Wang, Electrospinning based all-nano composite materials:
recent achievements and perspectives, Compos. Commun. 10 (2018) 140–150, https://doi.org/10.1016/j.coco.2018.09.005.
[25] S. Jiang, Y. Chen, G. Duan, C. Mei, A. Greiner, S. Agarwal, Electrospun nanofiber reinforced composites: a review, Polym. Chem. 9 (20) (2018) 2685–2720, https://
doi.org/10.1039/c8py00378e.
[26] Y. Chen, L. Sui, H. Fang, C. Ding, Z. Li, S. Jiang, H. Hou, Superior mechanical enhancement of epoxy composites reinforced by polyimide nanofibers via a vacuum-assisted hot-pressing, Compos. Sci. Technol. 174 (2019) 20–26, https://
doi.org/10.1016/j.compscitech.2019.02.012.
[27] S. van der Heijden, L. Daelemans, T. Meireman, I. De Baere, H. Rahier, W. Van Paepegem, K. De Clerck, Interlaminar toughening of resin transfer molded laminates by electrospun polycaprolactone structures: effect of the interleave morphology, Compos. Sci. Technol. 136 (2016) 10–17, https://doi.org/10.1016/j.
compscitech.2016.09.024.
[28] L. Yuan, W. Fan, X. Yang, S. Ge, C. Xia, S.Y. Foong, R.K. Liew, S. Wang, Q. Van Le, S.S. Lam, Piezoelectric PAN/BaTiO3 nanofiber membranes sensor for structural health monitoring of real-time damage detection in composite, Compos. Commun.
25 (2021), 100680, https://doi.org/10.1016/j.coco.2021.100680.
[29] I.D.G.A. Subagia, Z. Jiang, L.D. Tijing, Y. Kim, C.S. Kim, J.K. Lim, H.K. Shon, Hybrid multi-scale basalt fiber-epoxy composite laminate reinforced with Electrospun polyurethane nanofibers containing carbon nanotubes, Fibers Polym.
15 (6) (2014) 1295–1302, https://doi.org/10.1007/s12221-014-1295-4.
[30] M.T. Aljarrah, N.R. Abdelal, Improvement of the mode I interlaminar fracture toughness of carbon fiber composite reinforced with electrospun nylon nanofiber, Compos. Part B Eng. 165 (2019) 379–385, https://doi.org/10.1016/j.
compositesb.2019.01.065.
[31] A. Sharifi, S.N. Khorasani, S. Borhani, R.E. Neisiany, Alumina reinforced nanofibers used for exceeding improvement in mechanical properties of the laminated carbon/epoxy composite, Theor. Appl. Fract. Mech. 96 (2018) 193–201, https://
doi.org/10.1016/j.tafmec.2018.05.001.
[32] H. Tian, W. Fan, S. Ge, C. Xia, Y. Liu, H. Wang, S. Wang, Nanofiber–sheathed structure for enhancing interfacial properties of basalt fiber-reinforced composites, Compos. Commun. 23 (2021), 100589, https://doi.org/10.1016/j.
coco.2020.100589.
[33] C.B. Sweeney, B.A. Lackey, M.J. Pospisil, T.C. Achee, V.K. Hicks, A.G. Moran, B.
R. Teipel, M.A. Saed, M.J. Green, Welding of 3D-printed carbon nanotube-polymer composites by locally induced microwave heating, Sci. Adv. 3 (6) (2017), 1700262, https://doi.org/10.1126/sciadv.1700262.
Additive Manufacturing 46 (2021) 102030 [34] H.T. Loong-Tak Lim. Poly(lactic acid): Synthesis, Structures, Properties,
Processing, and Applications (Wiley Series on Polymer Engineering and Technology), first ed., Wiley, 2010.
[35] A. Mistriotis, D. Briassoulis, A. Giannoulis, S. D’Aquino, Design of biodegradable bio-based equilibrium modified atmosphere packaging (EMAP) for fresh fruits and vegetables by using micro-perforated poly-lactic acid (PLA) films, Postharvest Biol.
Technol. 111 (2016) 380–389, https://doi.org/10.1016/j.
postharvbio.2015.09.022.
[36] X. Yang, W. Fan, S. Ge, X. Gao, S. Wang, Y. Zhang, S.Y. Foong, R.K. Liew, S.S. Lam, C. Xia, Advanced textile technology for fabrication of ramie fiber PLA composites with enhanced mechanical properties, Ind. Crops Prod. 162 (2021), 113312, https://doi.org/10.1016/j.indcrop.2021.113312.
[37] S. Goutianos, L. Van der Schueren, J. Beauson, Failure mechanisms in unidirectional self-reinforced biobased composites based on high stiffness PLA fibres, Compos. Part A Appl. Sci. Manuf. 117 (2019) 169–179, https://doi.org/
10.1016/j.compositesa.2018.11.018.
[38] N. Kurokawa, A. Hotta, Thermomechanical properties of highly transparent self- reinforced polylactide composites with electrospun stereocomplex polylactide nanofibers, Polymer 153 (2018) 214–222, https://doi.org/10.1016/j.
polymer.2018.08.018.
[39] A. Kmetty, T. B´ ´ar´any, J. Karger-Kocsis, Self-reinforced polymeric materials: a review, Prog. Polym. Sci. 35 (10) (2010) 1288–1310, https://doi.org/10.1016/j.
progpolymsci.2010.07.002.
[40] R. Hashemi Sanatgar, C. Campagne, V. Nierstrasz, Investigation of the adhesion properties of direct 3D printing of polymers and nanocomposites on textiles: Effect of FDM printing process parameters, Appl. Surf. Sci. 403 (2017) 551–563, https://
doi.org/10.1016/j.apsusc.2017.01.112.
[41] T. Kozior, M. Trabelsi, A. Mamun, L. Sabantina, A. Ehrmann, Stabilization of electrospun nanofiber mats used for filters by 3D printing, Polymers 11 (10) (2019), https://doi.org/10.3390/polym11101618.
[42] T. Kozior, A. Mamun, M. Trabelsi, M. Wortmann, S. Lilia, A. Ehrmann, Electrospinning on 3D printed polymers for mechanically stabilized filter composites, Polymers 11 (12) (2019), https://doi.org/10.3390/polym11122034.
[43] H. He, M. Gao, B. Ill´es, K. Molnar, 3D printed and electrospun, transparent, hierarchical polylactic acid mask nanoporous filter, Int. J. Bioprint. 6 (4) (2020) 278, https://doi.org/10.18063/ijb.v6i4.278.
[44] C. Vyas, G. Ates, E. Aslan, J. Hart, B. Huang, P. Bartolo, Three-dimensional printing and electrospinning dual-scale polycaprolactone scaffolds with low-density and
oriented fibers to promote cell alignment, 3D print, Addit. Manuf. 7 (3) (2020) 105–113, https://doi.org/10.1089/3dp.2019.0091.
[45] J. Dong, M. Li, L. Zhou, S. Lee, C. Mei, X. Xu, Q. Wu, The influence of grafted cellulose nanofibers and postextrusion annealing treatment on selected properties of poly(lactic acid) filaments for 3D printing, J. Polym. Sci. Part B Polym. Phys. 55 (11) (2017) 847–855, https://doi.org/10.1002/polb.24333.
[46] J.R. Riba, J. Cailloux, R. Cantero, T. Canals, M.L. Maspoch, Multivariable methods applied to FTIR: a powerful technique to highlight architectural changes in poly (lactic acid), Polym. Test. 65 (2018) 264–269, https://doi.org/10.1016/j.
polymertesting.2017.12.003.
[47] R. Xu, J. Xie, C. Lei, Influence of melt-draw ratio on the crystalline behaviour of a polylactic acid cast film with a chi structure, RSC Adv. 7 (63) (2017) 39914–39921, https://doi.org/10.1039/c7ra05422j.
[48] S. Wong, R. Shanks, A. Hodzic, Interfacial improvements in poly(3-
hydroxybutyrate)-flax fibre composites with hydrogen bonding additives, Compos.
Sci. Technol. 64 (9) (2004) 1321–1330, https://doi.org/10.1016/j.
compscitech.2003.10.012.
[49] J.P. Mofokeng, A.S. Luyt, T. T´abi, J. Kov´acs, Comparison of injection moulded, natural fibre-reinforced composites with PP and PLA as matrices, J. Thermoplast.
Compos. Mater. 25 (8) (2011) 927–948, https://doi.org/10.1177/
0892705711423291.
[50] S.C. Lee, J.I. Han, Y.G. Jeong, M. Kwon, Strain-induced enthalpy relaxation in poly (lactic acid), Macromolecules 43 (1) (2010) 25–28, https://doi.org/10.1021/
ma901880a.
[51] X. Li, Y. Liu, H. Peng, X. Ma, H. Fong, Effects of hot airflow on macromolecular orientation and crystallinity of melt electrospun poly(L-lactic acid) fibers, Mater.
Lett. 176 (2016) 194–198, https://doi.org/10.1016/j.matlet.2016.04.070.
[52] D.M. Panaitescu, A.N. Frone, I. Chiulan, R.A. Gabor, I.C. Spataru, A. C˘as¸˘aric˘a, Biocomposites from polylactic acid and bacterial cellulose nanofibers obtained by mechanical treatment, BioResources 12 (1) (2017) 662–672, https://doi.org/
10.15376/biores.12.1.662-672.
[53] K. Rumiana, I. Petrova-Doycheva, D. Menseidov, E. Ivanov, A. Paddubskaya, P. Kuzhir, Exploring thermal annealing and graphene-carbon nanotube additives to enhance crystallinity, thermal, electrical and tensile properties of aged poly(lactic) acid-based filament for 3D printing, Compos. Sci. Technol. 181 (2019), 107712, https://doi.org/10.1016/j.compscitech.2019.107712.
H. He and K. Moln´ar