Component visualization methods for large legacy software in C/C++
Máté Cserép
a, Dániel Krupp
baEötvös Loránd University mcserep@caesar.elte.hu
bEricsson Hungary daniel.krupp@ericsson.com
Submitted August 28, 2014 — Accepted February 24, 2015
Abstract
Software development in C and C++ is widely used in the various in- dustries including Information Technology, Telecommunication and Trans- portation since the 80-ies. Over this four decade, companies have built up a huge software legacy. In many cases these programs, implementing complex features (such as OS kernels, databases) become inherently complicated and consist of millions lines of code. During the many years long development, not only the size of the software increases, but a large number (i.e. hundreds) of programmers get involved. Mainly due to these two factors the maintenance of software becomes more and more time consuming and costly.
To attack the above mentioned complexity issue, companies apply various source code cross-referencers to help in the navigation and visualization of the legacy code. In this article we present a visualization methodology that helps programmers to understand the functional dependencies of artifacts in the C++ code in the form similar to UML component diagrams. Our novel graph representation reveals relations between binaries, C/C++ implementation files and headers. Our technique is non-intrusive. It does not require any modification of the source code or any additional documentation markup. It solely relies on the compiler generated Abstract Syntax Tree and the build information to analyze the legacy software.
Keywords:code comprehension, software maintenance, static analysis, com- ponent visualization, graph representation, functional dependency
MSC:68N99 http://ami.ektf.hu
23
1. Introduction
One of the main task of code comprehension software tools is to provide naviga- tion and visualization views for the reusable elements of the source code, because humans are better at deducing information from graphical images [2, 7]. We can identify reusable software elements in C/C++ language on different abstraction levels of modularity. At a finer granularity, functions provide reusable implemen- tation of a specific behavior, while on a higher scale (in C++) classes defines the next level, where a programmer can collect related functions and data that belong to the same subject-matter. At the file level, header files group related functions, variables, type declarations and classes (in C++ only) into a semantic unit.
State of the art software comprehension and documentation tools implement various visualization methods for all of these modularization layers. For example, on the function level call graph diagrams can show the relations between the caller and the called functions [9], while on the class level, one can visualize the contain- ment, inheritance and usage relations by e.g. UML diagrams. On the file level, header inclusion diagrams help the developers in code comprehension [8].
However, our observations showed that the state of the art file level diagrams are not expressive enough to reveal some important dependency relationships among implementation and header files. In this paper, we describe a new visualization methodology that exposes the relations between implemented and used header files and the source file dependency chains of C/C++ software.
This paper is structured as follows. Section 2 consist of a brief overview of the state of the art literature with special focus on static software analysis. In Section 3 we describe the shortfalls of the visualization methods in the current software comprehension tools, then in Section 4 we present our novel views that can help C and C++ programmers in understanding legacy source code. Section 5 demonstrates our results by showing examples on real open-source projects, and finally in Section 6 we conclude the paper and set the directions for future work.
2. Background
Researchers have proposed several software visualization techniques and various taxonomies have been published over the past years. They address one or more of three main aspects (static, dynamic, and evolutional) of a software. The visu- alization of the static attributes focuses on displaying the software at a snapshot state, dealing only with the information that is valid for all possible executions of the software, assisting the comprehension of the architecture of the program.
Conversely, the visualization of the dynamic aspects shows information about a particular execution of the software, therefore helps to understand the behavior of the program. Finally, the visualization of the evolution – of the static aspects – of a software handles the notion of time, visualizing the alternations of these attributes through the lifetime of the software development. For a comprehensive summary of the current state of the art see the work of Caserta et al.[3]
The static analysis of a software can be executed on different levels of granularity based on the level of abstraction. Above a basic source code level, a middle – package, class or method – level, and an even higher architecture level exists.
In each category a concrete visualization technique can focus on various different aspects. A summary of categorization is shown on Table 1, classifying some of the most known and applied, as well as a few interesting new visualization techniques.
Kind Level Focus Techniques
Time T Visualization
Line Line properties Seesoft
Class Functioning, Metrics Class BluePrint
Architecture
Organization Treemap
Relationship
Dependency Structure Matrix UML Diagrams Node-link Diagrams 3D Clustered Graphs Visualizing Evolution
Table 1: Categorization of visualization tools
This article focuses on assisting the code comprehension through visualizing the relationships between architectural components of a software. The relevant category not only contains various prevalent and continuously improved visualizing techniques like theUML diagrams [4], but also recently researched, experimental diagrams like the three dimensional clustered graphs [1]. This technique aims to visualize large software in an integral unit, by generating graphs in a 3D space and grouping remote vertices and classes into clusters. The visibility of the inner content of a cluster depends dynamically on the viewpoint and focus of the user who can traverse the whole graph.
Our novel solution uses the classical node-link diagram in two dimensional space for visualization, which was formerly used at lower abstraction levels primarily.
3. Problems of visualization
Modularity on the file level of a software implementation in C/C++ is expressed by separating interfaces and definition to header and implementation (source) files.
Interfaces typically contain macro and type definitions, function and member dec- larations, or constant definitions; while implementation files usually contain the definition of the functions declared in the headers. This separation allows the programmers to define reusable components in the form of – static or dynamic – libraries. Using this technique, the user of a library does not need to have infor- mation about the implementation details in order to use its provided services.
Separation of these concerns is enforced by the C/C++ preprocessor, compiler and linker infrastructure. When a library is to be used, its header file should be
included (through the #include preprocessor directive) by the client implemen- tation or the header files. Implementation files should almost never1 be included in a project where the specification and implementation layers are properly sepa- rated. Unfortunately naming conventions of the header and implementation files in C/C++ are not constrained (like calss and file-naming in Java). Thus, based on a name of a file, it is not possible to find out the location, where the methods of a class are declared or implemented. Furthermore, the implementation of the class members declared in a header file can be scattered through many implementation files that makes the analysis even more difficult.
When a programmer would like to comprehend the architecture of a software, the used and provided (implemented) interface of a library component or the im- plementers of a specific interface should be possible to be fetched.
Problem 3.1. As an example let us analyze the commonly presented header in- clusion graph of a fileset in Figure 1. We assume that lib.h is an interface of a software library and that there are many users of this component, thus several files includes this header. If the programmer would like to comprehend where the functions declared in the header are implemented, the header inclusion graph is not helpful, since it does not unveil which C/C++ files are only using, and which are implementing thelib.h interface.
Figure 1: Implementation decision problem between component(s) and an interface.
As a solution we propose a so-called Interface diagram that is similar to the well-known header inclusion graph, but refines the include relation into uses and provides relationships. For this purpose we defined that a C/C++ file provides a header file when it contains its implementation, while it only uses it if the mentioned file refers to at least one symbol in the header, but does not implement any of them.
A proper and precisely defined description of this diagram is given in Section 4.2.
1A few exceptions may exist, i.e. in some rare cases of template usage.
4. Definition of relationships and diagrams
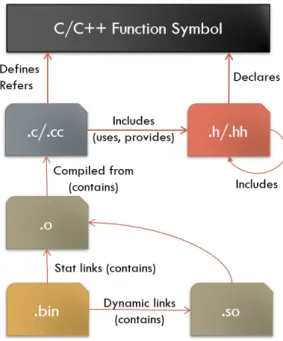
In this section first we introduce the commonly used basic terms of relationships defined between the C/C++ source files and the binary objects (see Figure 2), then present our more complex relationship definitions to describe the connections between the various kind of files in a software project at a higher abstraction level.
4.1. Preliminaries
Definition 4.1(Relations between source files). At the level of theabstract syntax tree [6], the main artifacts of a C/C++ source code are the user defined symbols2, which can be declared, defined or referred/used by either the source files (.c/.cc) or the header files (.h/.hh). A C/C++ symbol might have multiple declarations and references, but can be defined only once in a semantically correct source code.
To enforce the separation of the specification and implementation layer, header files should mainly consist of declarations, whose definitions are in the appropriate source files.3 From our perspective only those C/C++ symbols are important, which are declared in a header file and are defined or referred by a source file.
Figure 2: Relations between compilation artifacts.
2From our viewpoint only the function (and macro) symbols and their declaration, definition and usage are significant, although a similar classification for other symbol types can be established without difficulties.
3In some cases, headers may contain definition and source file may also consist forward decla- rations as an exception.
Definition 4.2(Relations between binaries). The source files of a project arecom- piled into object files, which are then statically linked into archive files (.lib/.a), shared objects or executable binaries. Shared objects are linked dynamically into the executables at runtime. To extract this information and visualize the relation- ship of binaries together with the relations declared between the C/C++ files, the analysis of the compilation procedure of the project is required beside the static analysis of the source code.
For the purpose of the presented visualization views in this paper the different kind of binary relationships is irrelevant, therefore they will be collectively referred as thecontains relation henceforward (see Figure 2).
4.2. Extended classification
The basic include relationship among the implementation and header C/C++ files have already been introduced in Section 4.1, however in order to solve the problem raised in Section 3, the definitions of the proposed uses and provides relations have to be separated.
Definition 4.3 (Provides relationship from implementation c to header h). We say that in a fileset a implementation filec provides the interface specified by the header fileh, whenc directly includeshand a common symbol sexists, for which hcontains the declaration, whilecconsists the definition of it.
Definition 4.4 (Uses relationship from implementation c to headerh). Similarly to the previous provides relationship definition, we state that in a fileset an imple- mentation file c uses the interface specified by the header file h, when c directly includes, but does not provides h and a common symbols exists, which c refers andhcontains the declaration of it.
Definition 4.5 (Interface graph (diagram) of implementation file c). Let us define a graph with the set of nodes N and set of edges E. Let P be the set of header files which areprovided bycandU the set of header files used byc, andB the set of binary files whichcontainc. We define thatN consists ofc, the elements ofP,U, andB. E consists the corresponding edges to represent the relationships between the nodes inN.
Figure 2 shows the illustration for the above mentioned definitions. Based on the idea of the Interface diagram defined in Definition 4.5, which shows the immediate provides, uses and contains relations of the examined file, we defined the following more complex file-based views.
The nodes of these diagrams are the files themselves and the edges represent the relationships between them. A labeled, directed edge is drawn between two nodes only if the corresponding files are in eitherprovides,uses orcontains relationship.
The label of the edges are the type of their relationship and they have the same direction as the relation they represent.
Definition 4.6(Used components graph(diagram) of sourcec). Let us define a graph with the set of nodes N and set of edges E, and let S be the set of implementation files which provides an interface directly or indirectly used by c.
We define thatN consists ofc, the elements ofS and the files along the path from c to the elements of S. Binaries containing any implementation file inS are also included in N. E consists the corresponding edges to represent the relationships between the nodes inN.
Intuitively we can say if sourcetis a used component ofc, thencis using some functionality defined int.
Definition 4.7 (User components graph(diagram) of sourcec). Let us define the graph with the set of nodesN and set of edgesE, and similarly to the previous definition, letS be the set of implementation files which directly or indirectlyuses the interface(s) provided by c. We define that N consists of c, the elements of S and the files along the path from c to the elements ofS. Binaries containing any implementation file inSare also included inN. Econsists the corresponding edges to represent the relationships between the nodes inN.
Intuitively we can say if sourcet is a user component ofc, thenc is providing some functionality used byt.
5. Experimental results
In order to implement the views defined in Section 4, we created a diagram visual- izing tool was created as part of a larger code comprehension supporting project – namedCodeCompass. The software is developed in cooperation at Eötvös Loránd University and Ericcson Hungary. The tool provides an interactive graph layout interface, where the users are capable of requesting more information about the nodes representing files and can also easily navigate between them, switching the perspective of the view they are analyzing.
Figure 3: Interface diagram of tinyxml.cpp.
For demonstration purposes in this paper, the open-source TinyXML parser project[10] was selected. In this section altogether three examples for the use of our tool is shown and information retrievable from them is examined.
Example 5.1. Figure 3 displays anInterface diagram, showing the immediate re- lations of a selected file with other files in the software. As the image shows, the C++ implementation file in the middle (tinyxml.cpp) includes two header files, but the special connection of implementation (provides) is distinguished from the mere uses relation. This diagram not only presents the connections between C++
source and header files, but also displays in which object file the focused imple- mentation file was compiled into through the compilation process of the project.
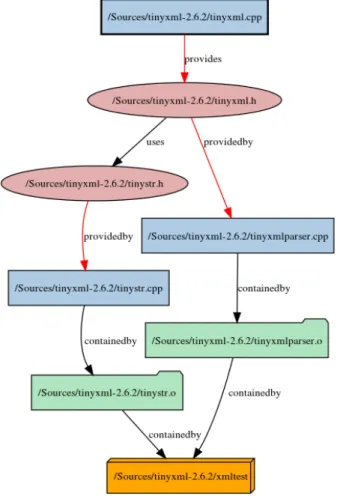
Figure 4: Used components bytinyxml.cpp.
Example 5.2. Figure 4 presents theUsed components diagram of the implemen- tation filetinyxml.cpp at the top. The goal of this visualization is to determine
which other files and compilation units the selected file depends on. As it is de- picted in the figure, the interface specification for thetinyxml.cppimplementation file is located in the tinyxml.hheader. This header file on the one part is pro- vided by thetinyxmlparser.cpp, and on the other hand uses thetinystr.h. The latter header file is provided by the tinystr.cpp source. Hence the implication can be stated that the original tinyxml.cpp indirectly uses and depends on the tinyxmlparser.cppand thetinystr.cppfile.
Example 5.3. Parallel to Figure 4, the following example deduces the compilation artifacts depending on the same selected source tinyxml.cpp. The User compo- nents diagram displays (see Figure 5) that this implementation file implements an interface contained by thetinyxml.hheader. This header is used or provided by three sources (tinyxmlparser.cpp,xmltest.cppandtinyxmlerror.cpp), there- fore they are the users of tinyxml.cpp.
Figure 5: User components of tinyxml.cpp.
6. Conclusions and future work
In large legacy software projects a huge codebase can easily be built up because of the extended development time, while fluctuation among programmers can also often be a significant problem. Code comprehension support addresses these ques- tions through assisting – both experienced and newcomer – developers with visu- alization views to better understand the source code. In this paper we discussed
what kind of file-level views are missing from the current code comprehension tools, regarding the relationships between different type of compilation artifacts. We de- fined our novel graph view as a solution to this problem, and demonstrated the practical use of our technique through examples on an open-source C++ project.
The new visualization techniques were found helpful and applicable for legacy soft- ware in supporting code comprehension.
Above the file-level granularity, a higher level of modularity can also be defined, considering that related files can form the interface of a reusable binary component and are often grouped together physically (i.e. contained in a directory) or virtu- ally (e.g. using packages or namespaces). Future development will generalize and expand the file-based dependency relationship definitions introduced in this paper to be applicable for modules containing multiple files.
Further work will also include the examination of how the information retrieved by our definition rules can be used in the field of architecture compliance checking.
Software systems often impose constraints upon the architectural design and im- plementation of a system, for example on how components are logically grouped, layered and how they may interact with each other. In order to keep the main- tainability of a software system through a long development time with a large programmer team, it bears extreme importance that the design and implementa- tion are compliant to its intended software architecture. Due to the complexity of large software systems, guaranteeing the compliance by manual checking is almost impossible, hence automated support is required, which is still not a completely solved issue nowadays [5].
References
[1] Balzer, M., Deussen, O., Level-of-detail visualization of clustered graph lay- outs,Proceedings of the 6th International Asia-Pacific Symposium on Visualization, (2007), 33–140.
[2] Biederman, I.,Recognition-by-components: a theory of human image understand- ing,Psychological review, Vol. 94 (1987), 115–147.
[3] Caserta, P., Zendra, O.,Visualization of the static aspects of software: a survey, IEEE Transactions on Visualization and Computer Graphics, Vol. 17 (2011), 913–
933.
[4] Gutwenger, C., Jünger, M., Klein, K., Kupke, J., Leipert, S., Mutzel, P., A new approach for visualizing UML class diagrams, Proceedings of the 2003 ACM Symposium on Software Visualization, (2003), 179–188.
[5] Pruijt, L., Koppe, C., Brinkkemper, S.,, On the accuracy of architecture com- pliance checking support: Accuracy of dependency analysis and violation reporting, IEEE 21st International Conference on Program Comprehension, (2013), 172–181.
[6] Salomaa, A.,Formal Languages,Academic Press Professional, Inc., (1987).
[7] Spence, I., Visual psychophysics of simple graphical elements,Journal of Experi- mental Psychology: Human Perception and Performance, Vol. 16 (1990), 683–692.
[8] Doxygen Tool: http://www.stack.nl/~dimitri/doxygen/.
[9] Understand Source Code Analytics & Metrics,http://www.scitools.com/.
[10] TinyXML parser,http://www.grinninglizard.com/tinyxml/.