ORIGINAL PAPER
Electrochemical study of anatase TiO
2nanotube array electrode in electrolyte based on 1,3-diethylimidazolium
bis (trifluoromethylsulfonyl)imide ionic liquid
Milan Vraneš1&Nikola Cvjetićanin2&Snežana Papović1&Marko Pavlović3&István Szilágyi4,5&Slobodan Gadžurić1
Received: 9 July 2018 / Revised: 6 June 2019 / Accepted: 15 June 2019
#Springer-Verlag GmbH Germany, part of Springer Nature 2019
Abstract
The density, viscosity and electrical conductivity of ionic liquid 1,3-diethylimidazoliumbis(trifluoromethylsulfonyl)imide, (C2C2imTFSI), and 0.5-M solution of LiTFSI in C2C2imTFSI were determined at different temperatures. The LiTFSI/C2C2imTFSI system was tested as a possible electrolyte for lithium-ion batteries by using anatase TiO2nanotube array electrode as anode material for the first time. The electrochemical testing has shown not only the improvement of lithium-ion insertion/deinsertion properties by increasing temperature but also the existence of a decomposition of the electrolyte, detecting the change of colour. The decomposition of electrolyte leads to the formation of a film on the surface of the electrode which improves Coulombic efficiency during cycling.
Keywords Imidazolium ionic liquid . Ionicity . TiO2nanotubes . Cyclic voltammetry . Galvanostatic cycling
Introduction
Current lithium-ion battery (LIB) systems are not sufficiently safe mainly owing to undesired reactions between the battery components and flammable electrolytes [1,2], triggered by un- predictable events such as short circuits or local overheating,
leading to an exothermic reaction of the electrolyte with the electrode materials [3,4]. Electrolytes for LIBs derived from ionic liquids (ILs) exhibit negligible vapour pressure and flame-retardant performance [5] that ensure reliability in their use as safe electrolytes in LIBs and improve battery safety [6, 7], resulting with extreme temperature range operation. Novel battery architectures with improved safety, power and energy density are currently being demanded for battery miniaturization.
Indeed, the properties of ILs can be tailored in detail by the cation and anion combination. From a literature survey, it was observed that the most used and efficient anion was bis(- trifluoromethylsulfonyl)imide ([NTf2]−) due to the delocalized charge that it possesses, even if some drawbacks are reported to be related to its corrosive characters [8,9]. Its advantages are high thermal stability and adapted physicochemical properties.
As cations, imidazolium-based ones are often used to allow easy chemical modification by changing the length, the number and the functionality of the side-alkyl chains. Indeed, the presence of an acidic proton on the C2 position, which is reactive towards lithium, has to be considered [10–12]. Thus, many authors have attempted to improve the electrochemical stability by suitable modifications of the IL structure [7,13–20]. However, the results are somewhat contradictory and some confusion still remains.
An electrode material which enhances the capacity and energy density of the battery could be TiO2nanotube arrays (NTAs) [21–32]. The most frequently mentioned potential Electronic supplementary materialThe online version of this article
(https://doi.org/10.1007/s11581-019-03129-8) contains supplementary material, which is available to authorized users.
* Milan Vraneš
milan.vranes@dh.uns.ac.rs
1 Faculty of Science, Department of Chemistry, Biochemistry and Environmental Protection, University of Novi Sad, Trg Dositeja Obradovića 3, Novi Sad 21000, Serbia
2 Faculty of Physical Chemistry, University of Belgrade, Studentski trg 12-16, Belgrade 11158, Serbia
3 Department of Colloid Chemistry, Max-Planck Institute of Colloids and Interfaces, Am Mühlenberg 1, 14476 Potsdam, Germany
4 MTA-SZTE Lendület Biocolloids Research Group, University of Szeged, Szeged H-6720, Hungary
5 Interdisciplinary Excellence Center, Department of Physical Chemistry and Materials Science, University of Szeged, Szeged H-6720, Hungary
https://doi.org/10.1007/s11581-019-03129-8
applications are the use of TiO2NTAs in photocatalysis and dye solar cells [33,34]. Modification of the semiconductor nature of highly ordered TiO2NTAs is important for its appli- cation in constructing high-performance supercapacitors [35, 36]. Applications of TiO2NTAs in electrochromic devices, as improved photo-catalysts and anodes for micro LIBs, are con- nected with the modification of electronic and optical proper- ties of TiO2upon lithium-ion (Li+) intercalation and the ability of nanotubes to intercalate/deintercalate Li+large number of times [21–24].
As continuation of our scientific work [37, 38], in this research study are examined the physicochemical and electro- chemical properties of 0.5 mol·dm−3LiTFSI ionic liquid 1,3- diethylimidazolium bis(trifluoromethylsulfonyl)imide, C2C2imTFSI, as well as the performance of anatase Ti/TiO2
nanotube array (NTA) cells—that electrode material enhances the capacity and energy density of the battery upon lithium- ion (Li+) intercalation and the ability of nanotubes to intercalate/deintercalate Li+ large number of times [39]. In order to examine temperature effect on cell performances, cyclic voltammetry (CV) and galvanostatic charge/discharge experiments are performed in a wide temperature range 298.15 to 328.15 K. The electrochemical testing was conduct- ed in order to compare the stability of selected electrolyte with previous one, which contains γ-butyrolactone, GBL, as cosolvent [37], where it is assumed that there is a possibility of stabilization effect between the carbonyl group of GBL and acidic C2-H from 1,3-dialkylimidazolium cation. The aims of this work are to investigate electrochemical performances of electrolyte containing only lithium salt in ionic liquid and to realize a battery system that has both safety and high-energy performances.
Experimental
MaterialsIonic liquid C2C2imNTf2was commercially available from IoLiTec (ω≥0.99). The summary of the provenance and pu- rity of the samples is given in Table1. The ionic liquid was slowly heated under vacuum for 1 day. Prior to use, the ionic liquid was kept in a vacuum desiccator over P2O5for 24 h.
After that, C2C2imNTf2was stored in a dry box under a nitro- gen atmosphere. The water content in IL was determined by Karl Fischer titration using an 831 Karl Fischer coulometer, and the amount of water content is given in Table1.
Lithium salt, LiTFSI, was dried in vacuum atT= 373.15 K.
The electrolyte was prepared under inert conditions in an argon- filled glove box by dissolving LiTFSI in C2C2imTFSI, obtaining Li+concentrationc(Li+) = 0.5 mol·dm−3. For convenience, in this work, the electrolyte 0.5 mol·dm−3LiTFSI in C2C2imTFSI will be referred as LiTFSI/C2C2imTFSI.
TiO2NTAs were prepared by anodic oxidation of 0.25-mm thick and 0.5-cm wide Ti foil. The anodization was conducted in 0.7% glycerol solution of NH4F by using graphite as a cathode, under a constant voltage of 30 V. The anodic oxida- tion was performed during 6 h to obtain a sufficiently thick layer of NTs [40] for accurate mass determination. Both sides of Ti electrode covered with NTs were well rinsed with dis- tilled water, and after drying, the electrode was annealed three times in air atT= 673.15 K to convert TiO2from amorphous to crystal anatase form.
Apparatus and procedures Density measurements
The vibrating tube Rudolph Research Analytical DDM 2911 densimeter with the accuracy and precision of ± 0.00005 g cm−3was used for density measurements. The in- strument was thermostated within ± 0.01 K and viscosity was automatically corrected. Before each series of measurements, calibration of the instrument was performed at the atmospher- ic pressure (p= 0.1 MPa) using ambient air and bi-distilled ultra-pure water in the temperature range from 293.15 to 323.15 K. Each experimental density value is the average of at least five measurements at selected temperatures. Repeated experimental measurements showed reproducibility within 0.01%, and an average value is presented in this paper. The standard uncertainty of determining the density is less than 7.6∙10−4g cm−3.
Viscosity measurements
The viscosity of pure ionic liquid was measured using a Brookfield Viscometer DV II+ Pro thermostated within ± 0.01 K and filled with about 8 cm3of liquid. The spindle type (SC4-18) was immersed and the rate per minute (RPM) was set to obtain a suitable torque. A viscometer cell was protected from moisture with the compartment made by the manufac- turer and calibrated using the liquids of different viscosities purchased from the manufacturer. The viscosity of pure ionic liquid and electrolyte was measured in the temperature range from 293.15 to 323.15 K with a rotation speed of 60 RPM.
Presented experimental values are the mean of three measure- ments and the measurement relative standard uncertainty was found to be about 1%.
Electrical conductivity measurements
These measurements were carried out in a Pyrex cell with platinum electrodes in the temperature range 293.15 to 323.15 K on a conductivity meter Jenco 3107, using a DC signal. The conductometric cell with a total volume of 14 cm3was initially dried in the atmosphere of nitrogen and
thermostated for 20 min with the external flow with an accu- racy of ± 0.01 K. At least 10 measurements were performed at 5 s intervals, in order to eliminate the self-heating and ioniza- tion in the electrodes [41]. The experimental cell was calibrat- ed with standard 0.1000 mol dm−3KCl solution by the same experimental procedure. The resulting cell constant amounted to 1.0353 cm−1, and it was checked from time to time to control any possible evolution. The uncertainty for electrical conductivity was less than 1.5%. All obtained experimental values represent the mean of three measurements.
Flammability test
The potential flammability of the ionic liquid C2C2imTFSI and LiTFSI/C2C2imTFSI electrolyte could be examined by directly observing the flame on the surface of the solution for 60 s. Firstly, the ionic liquid or electrolyte sample (exactly measured mass) was placed to a watch glass and exposed to a burner for 60 s to allow ignition, but the flame from investi- gated samples was not observed. The flame temperature was 1200 °C, measured with a Digital Thermocouple Thermometer Dual-channel LCD Backlight Temperature Meter with an R-type Thermocouple sensor probe.
Electrochemical tests
The cyclic voltammetry (CV) experiments were carried by Gamry PCI4/300 Potentiostat/Galvanostat in a bottle-like three-electrode cell made of Pyrex glass and closed with a Teflon stopper with a double“O”ring. Electrical contacts for all three electrodes were routed through the Teflon stopper.
The cell is filled with 3 cm3of the electrolyte. Ti foil with anodically grown TiO2 NTAs was used as the working
electrode, and lithium metal foil was used both as the refer- ence and counter electrode. The geometrical surface area of the working electrode in contact with electrolyte was 1 cm2. All CVs were recorded by using a current interrupt (CI) meth- od for IR compensation. The same type of cell in a two- electrode arrangement was used for galvanostatic charging/
discharging experiments which were performed by an Arbin BT 2042 battery testing device. The temperature control was achieved by immersing cells in the thermostat bath (Lauda UB 40J, WK 1400).
The same two-electrode cell used for galvanostatic experi- ments was also used for electrochemical impedance spectros- copy (EIS) measurements using a Gamry PCI4/300 Potentiostat/Galvanostat. The EIS measurements were per- formed atT= 298.15 K after 50 and 150 galvanostatic cycles.
The cell was fully discharged and halfway charged at a current rate 20 μA·cm−2and then left to relax half an hour before measurements. An AC amplitude of 5 mV was applied in the frequency range 100 kHz–0.1 (0.01) Hz. The Gamry Echem Analyst, version 5.61, was used for fitting data to the equivalent circuit model.
Raman, FTIR and UV-Vis spectroscopy measurements Room temperature Raman spectra of electrolytes were obtain- ed using solid-state Nd:YAG laser excitation line of 532 nm, with an incident laser power less than 60 mW on a Thermo Scientific DXR Raman microscope, under the inert atmo- sphere. A Tri Vista 557 triple spectrometer coupled with the nitrogen-cooled CCD detector was employed for spectrum collection.
The FTIR measurements were performed using a Thermo Scientific Nicolet iS20 spectrometer equipped with a Table 1 Provenance and purity of
the samples Chemical name Provenance Product
number
Purification method
Final mass fraction as stated by the supplier
Water analysis method
Water content (ppm)
C2C2imTFSI IoLiTech 174,899–88-8 Vacuum drying
ω≥0.99 KF titra- tion
13
LiTFSI Sigma-Aldrich 90,076–65-6 Vacuum
drying
ω≥0.9995 – –
0.5 mol·dm−3 LiTFSIc/C2C2imT- FSI
– – Vacuum
drying
– KF
titra- tion
10
Ti foil Alfa Aesar 7440-32-6 – ω≥0.995 – –
NH4F Sigma-Aldrich 12,125–01-8 – ω≥0.995 – –
Glycerol Sigma-Aldrich 56–81-5 – ω≥0.995 – –
C2C2imTFSI, 1,3-diethylimidazoliumbis(trifluoromethylsulfonyl)imide KF titration, Karl Fischer titration
LiTFSI, lithiumbis(trifluoromethylsulfonyl)imide
Universal diamond ATR Sampling Accessory. The measure- ments were performed with a total of 60 scans at room tem- perature and a spectrum resolution of 2 cm−1in a range from 500 to 3400 cm−1. Investigated electrolytes were placed on the top of the diamond crystal, and measurements were performed under the inert atmosphere. The Omnic 6.2 software was used for the data acquisition and spectral analysis.
In the wavelength range 250–800 nm, the absorption spec- tra were recorded. The measurements were performed on a Thermo Scientific UV-Vis spectrophotometer Evolution 220.
Quartz spectrophotometric cells of 1-mm path length with Teflon stoppers were used, and all measurements were per- formed at room temperature and under the inert atmosphere.
Electrode material characterization, XRD and SEM
The crystal structure of TiO2NTAs was examined by X-ray diffraction (XRD). XRD data were collected by a Philips PW diffractometer 1050 with Cu-Kα1,2 radiation in a 2θrange between 20 and 80owith a step size 0.05oand counting time 2 s per step. XRD patterns of Ti foil, before and after anodi- zation, are shown in Fig.S1. The reflections of both anatase and Ti-metal phase can be observed in the XRD pattern of Ti foil after anodic oxidation. The strongest and the most obvious reflections of the anatase phase are marked with an asterisk. A similar procedure for TiO2NTA preparation from Ti foil was demonstrated by Papovićet al. [37].
The surface morphology of obtained TiO2NTs was inves- tigated through a JEOL JSM 6460LV scanning electron mi- croscope (SEM) (Fig.S2). The NTs have a more or less cy- lindrical shape with outer diameter of ~ 150 nm, inner diam- eter of ~ 80 nm and wall thickness of 35–40 nm. Obtained SEM images of TiO2NTAs before and after cycling did not show any change in morphology and structure (Fig.S3).
Results and discussion
Physicochemical properties for IL and IL-based electrolyte
Due to a lack of literature data for density, viscosity and elec- trical conductivity of C2C2imTFSI, these physicochemical properties were measured in the temperature range from 293.15 to 323.15 K and at an atmospheric pressure (p= 0.1 MPa). The experimental results for C2C2imTFSI are pre- sented in Table2and compared with some available experi- mental data from the literature [41–46].
It was found that density values obtained in this work for C2C2imTFSI deviate from the literature values, reported in a paper from Rocha et al. and Domanska et al. [42,43] where they are less than 0.05% at the temperatureT= 298.15 K. A good agreement can be observed between the density values
with those reported by Rocha et al. [42], finding relative de- viation in the whole temperature range from 0.01–0.05%. The relative deviation between the experimental values in this work and those published in the work of Tome et al. [41] is 0.8%. Comparing our viscosity results given in Table2with those obtained in the paper from Rocha et al. [42], it can be seen that deviation is 3–14%. The relative deviation between the experimental viscosity measured in this work and those reported in the literature atT= 298.15 K is 8%. A good agree- ment can be observed between the values of electrical conduc- tivity with those reported by Higarava et al. [44] finding a relative deviation in the temperatureT= 293.15 K, which is below 2.5%.
The comparison of density values obtained for C2C2imTFSI with ionic liquids C1C1imTFSI [47] and C1C2imTFSI [48] is presented in Fig.S4a. From Fig.S4a, it could be seen that density decreases as the alkyl chain length on the cation increases. It is understandable bearing in mind that the larger the individual ions are, the Coloumbic interac- tions would be weaker. Therefore, the ions are less closely packed, causing lower macroscopic density. Additionally, the cation symmetry provides a different structural organiza- tion which also allows the fine tuning of IL physicochemical properties [49,50]. Xiao et al. [51] showed that the symmetric IL series presents a higher local order and higher intermolec- ular dynamics in frequency than the asymmetric series.
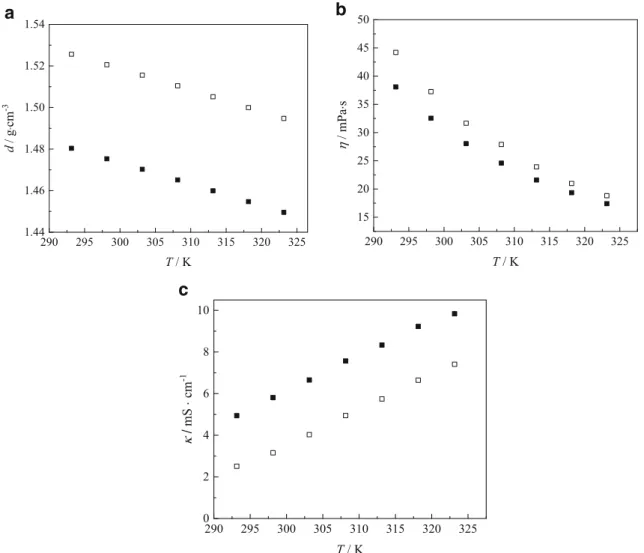
Figure1apresents a comparison between physicochemical properties for pure ionic liquid and 0.5 mol dm−3LiTFSI in C2C2imTFSI (LiTFSI/C2C2imTFSI electrolyte). From Fig.1a, it can be seen that density increases with a dissolved lithium salt in C2C2imTFSI and decreases linearly with in- creasing temperature. Obtained data were fitted as a function of temperature using a linear fit, with parameters tabulated in TableS1. For experimental densities (Table2, Fig.1a) were used to derive other thermodynamic properties such as coef- ficient of thermal expansion [52–54] given in the supporting information of this manuscript (Fig.S5, TableS2).
The effect of temperature on the viscosity of C2C2imTFSI and LiTFSI/C2C2imTFSI electrolyte is graphically presented in Fig.1bfor the whole temperature range. The experimental results of viscosity at different temperatures were fitted using the Vogel–Fulcher–Tammann (VFT) equation [55–57]:
η¼aexpðb=ðT−ToÞÞ ð1Þ whereηis the viscosity,Tis the temperature in K anda,b, andToare the coefficients of VFT equation whose values are given in TableS3together with the standard deviations.
The temperature has a significant effect on the perfor- mances of the IL-containing batteries, as the viscosity is a crucial limitation [58].
From Fig.1b, it can be seen that viscosity decreases 2–2.5 times when temperature increases in the range from 293.15 to
323.15 K from pure ionic liquid to 0.5 mol·dm−3Li+electrolyte, respectively. The addition of LiTFSI in the ionic liquid in- creases the viscosity of the mixture, which is more pronounced at lower temperatures. Structural changes in LiTFSI/
C2C2imTFSI mixture upon the addition of LiTFSI lead to a structure that causes higher density and viscosity [59].
The increase of electrical conductivity with temp1111era- ture for ionic liquid is observed in Fig.1cand is in accordance with the fact that electrical conductivity of the IL largely de- pends on the viscosity [60]. Electrical conductivity decreases when a LiTFSI salt is added to the ionic liquid (Fig.1c). The reduction of the electrical conductivity is associated with the ionic interactions between the Li+ and the IL anion, which increase the viscosity and result in larger complexes with low- er mobility [61–64].
Electrical conductivity data obtained for 0.5 mol dm−3 LiTFSI/C2C2imTFSI electrolyte are qualitatively compared with other ionic liquid–based electrolytes with the optimal compositions for LIBs reported in the literature [65–69]. It is evident that ionic liquid based–electrolytes at compositions stated as“optimal”for LIBs (presented in Fig.S5), including electrolyte studied in this work, have comparable electrical conductivity, which is one of the parameters that govern the performance of the lithium-ion batteries.
The relationship between molar conductivity (based on the experimental electrical conductivity and density data) and vis- cosity of the ionic liquid, as well for LiTFSI/C2C2imTFSI electrolyte, is illustrated by the qualitative approach developed by Walden [70], defined as
Λm⋅ηα¼K¼const ð3Þ
whereΛmis the molar conductivity andηαis the viscosity of the ionic liquid (or LiTFSI/C2C2imTFSI electrolyte). The
exponentαis used to describe the decoupling of mobile ions [71]. This exponent is the slope of the logarithmic form of the Eq. (3), while logKis the intercept given as
logΛm¼α⋅log η−1
þlogK ð4Þ
The Walden rule relates the ionic mobility represented by the equivalent conductivity Λmto the fluidity (η−1) of the medium through which the ions move [72]. Figure2 shows the Walden plots for some imidazolium-based ILs (which are similar on the basis of the structure with investigated one, such as {[CnC1im][NTf2]; n= 1 and 2}) and for LiTFSI/
C1C2imTFSI electrolyte, with temperatures varying from 293.15 to 323.15 K [47]. These plots are placed below the
“ideal”KCl line, which represents 0.01 mol dm−3KCl aque- ous solution known to be fully dissociated and to have ions of equal mobility [71]. Previous reports have shown that many pure ionic liquids lie below the reference line indicating in- complete ionization of these ionic liquids, as was explained by the Walden plot [70–73]. Deviation from the ideal line is com- monly observed for most of ILs and is correlated to the partial Walden rule [72–74]. From Fig.2, it can be seen that with the alkyl chain increase on cation of IL, Walden plot is on a larger distance from the ideal line. It indicates that pure ILs with longer alkyl side chains show lower ionization. It is important to evaluate the percent of ionization as a quantitative expres- sion as ionicity (I), calculated with Eq. (5) [75,76]:
I ¼10−ðlogð Þη−1 −logΛmÞ ð5Þ
Ionicity of the C2C2imTFSI is calculated atT= 298.15 K and it is 53% in case of pure ionic liquid and 80% in case of LiTFSI/C2C2imTFSI electrolyte. A lithium salt addition to IL Table 2 Experimental and
literature values of density, (d), viscosity, (η) and electrical conductivity, (κ), of the pure liquid C2C2imTFSI at the specified temperatures and atmospheric pressure (p= 0.1 MPa)
d/(g cm−3) η/(mPa s) κ/(mS cm−1)
T/(K) This work References This
work
References This work
References
293.15 1.48035 1.4692a; 1.4799b 38.09 36.89a; 36.00d; 35.00f
4.94 6.2d
298.15 1.47532 1.4632a; 1.4749b; 1.4760c; 1.452d; 1.470e
32.54 30.78b 5.81 –
303.15 1.47030 1.4577a; 1.4699b
28.04 26.02b 6.66 –
308.15 1.46516 1.4473a; 1.4650b
24.59 22.21b 7.57 –
313.15 1.45993 1.4600b 21.60 19.15b 8.33 –
318.15 1.45473 1.4551b 19.35 16.65b 9.23 –
323.15 1.44956 1.4502b 17.40 14.61b 10.14 –
Standard uncertainty:u(d) = 9.75·10−1 kg m−3;ud(T) = 0.015 K,uη(T) = 0.02 K, relative standard uncertainties areur(η) = 2%, %,u(κ) = 1.5%,ur(p) = 1.5%
a = [22], b = [23], c = [24], d = [25], e = [26], f = [27]
usually reduces the ionicity because of the high charge density of lithium, and the Coulombic interaction was favoured and increases ion pairing [76].
In terms of electrolyte safety features, it is important to assess the flammability of LiTFSI/C2C2imTFSI electrolyte.
The flame did not appear during heating of 120 s, and this is a clear indication that LiTFSI/C2C2imTFSI electrolyte is non- f l a m m a b l e ( F i g . S6) . T h u s , L i T F S I / C2C2i m T FS I (0.5 mol dm−3LiTFSI in C2C2imTFSI) is selected as an elec- trolyte for the following electrochemical characterization of nanotubular anatase TiO2as anode material for LIBs.
Electrochemical characterisation Cyclic voltammetry
Initially, the electrochemical stability window of LiTFSI/
C2C2imTFSI electrolyte, under non-atmospheric conditions [77], has been measured by cyclic voltammetry using a glassy c a r b o n ( G C ) a s w o r k i n g e l e c t r o d e . T h e c y c l i c
voltammograms obtained at a scan rate of 10 mV·s−1are pre- sented in Fig.3atT= 298.15 K. The voltage window between the onset of oxidation and reduction is around 4 V. It is im- portant to emphasize that small amounts of water can narrow the potential limits of ionic liquids to a certain degree [77].
According to Fig. 3, Li4Ti5O12 (LTO) and TiO2may be considered as suitable anode materials to be tested in LiTFSI/C2C2imTFSI as a potential electrolyte for Li-ion bat- teries. Despite the fact that LTO has slightly lower working potential, the choice fell on anatase TiO2NTs. The Ti/TiO2NT electrode, obtained by anodic oxidation, concurrently joins the current collector and the active material without the binder and therefore is more robust for measurements at elevated temper- atures in bottle-type cells.
Figure4ashows CVs recorded for anatase TiO2NTA elec- trode in LiTFSI/C2C2imTFSI electrolyte at scan rates 1, 2 and 5 mV·s−1at temperatureT= 298.15 K. In all cases, the poten- tial was scanned from 3 to 1 V and then vice versa. At all scan rates, Ti4+/Ti3+ redox peaks appear owing to the process of insertion/extraction of Li+and may be considered fast most
290 295 300 305 310 315 320 325 1.44
1.46 1.48 1.50 1.52 1.54
d/gcm-3
T/ K
290 295 300 305 310 315 320 325 15
20 25 30 35 40 45 50
/mPas
T/ K
290 295 300 305 310 315 320 325 0
2 4 6 8 10
/mScm-1
T/ K
a b
c
Fig. 1 Comparison of experimental:adensity, (d),bviscosity, (η), andcelectrical conductivity, (κ) for (■) C2C2imTFSI and (□) LiTFSI/C1C2imTFSI, as a function of temperature
likely due to the short diffusion length of Li+ion into nanotube walls. At all scan rates, the common appearance of CVs was obtained, i.e. a higher scan rate gives a higher current peak, except the peak heights at 1 and 2 mV s−1in reduction are the same. This happened because during a reduction in scan rate 1 mV s−1, the lithium ions where for the first time inserted into TiO2NTs and some of them remained irreversibly bounded (irreversible capacity loss). The smaller peak, more clearly visible in reduction at all scan rates, most likely may be attrib- uted to the additional filling of oxygen octahedra above com- position Li0.5TiO2[78]. At the lowest scan rate of 1 mV·s−1 (Fig.4b), redox peak-to-peak separation is 0.441 V and is similar to that observed for IL-based electrolytes [19,20], and also for LiPF6/EC-DMC [79] and LiClO4/PC [80]
electrolyte.
Figure4bdemonstrates the influence of temperature on CVs recorded at a scan rate 5 mV·s−1. The increase in temper- ature at the same time enhances the height of the redox peaks and decreases the peak-to-peak separation. This indicates the significant improvement of both lithium-ion storage capability and reversibility of the Ti/TiO2NT electrode. Although CVs were recorded by using the CI method which eliminates elec- trolyte resistance, the peak-to-peak separation, even at the highest temperatureT= 328.15 K, is significantly larger from the Nernstian. The main reason is most likely the slow elec- tron transport inside the TiO2NTs even though lithium inter- calation reduces the energy gap of anatase TiO2semiconduc- tor [34].
Galvanostatic experiments
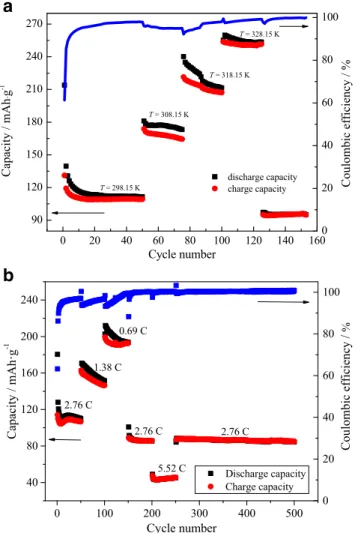
The galvanostatic (GS) cycling for the first Ti/TiO2NTA elec- trode was performed by using the current density of 100μA cm−2at different temperatures. The current rate was
calculated later by scraping nanotubes from the Ti foil. The gal- vanostatic charge/discharge (lithium extraction/lithium insertion) capacity of TiO2NTs is shown for 150 cycles in Fig. 5afor LiTFSI/C2C2imTFSI electrolyte, at different temperatures.
After initial capacity drop, the insertion/extraction capacity of Li+ ion into/from TiO2 NTs became very stable at T= 298.15 K. After 50 cycles at this temperature, the insertion/
extraction capacity amounted 111.2/109.5 mAh g−1. This corre- sponds to the Coulombic efficiency of 98.5%. By increasing temperature from 298.15 to 308.15 K, capacity significantly rises, but is in the constant slow decrease. After 25 cycles at temperature T= 308.15 K, insertion/extraction capacity was 173.1/164.4 mAh·g−1, which gives, comparing with previous temperature, the lower Coulombic efficiency of 95.0%.
The growth of temperature to T= 318.15 K, leads to a further jump in capacity. At this temperature, the capacity drop is much steeper in the first ~ 11 cycles with Coulombic effi- ciency which is between 92.2% for the 1st (76th in total) and 95.2% for the 11th (86th in total) cycle. Then, both in charge and discharge, capacity decreases to some extent, but Coulombic efficiency increases and capacity drop is signifi- cantly diminished. At the end of cycling atT= 318.15 K, for the 25th (100th in total) cycle, the insertion/extraction capac- ity is 211.4/207.1 mAh g−1and Coulombic efficiency 98.0%.
TheT= 328.15 K is the highest temperature at which galva- nostatic cycling was examined. Very stable cycling behaviour was obtained in this case. From a total of 25 cycles, in the last 10 cycles practically, there is no capacity fade. For the last 25th (125th in total) cycle, insertion/extraction capacity of Li+is 253.5/251.5 mAh g−1, and Coulombic efficiency is as high as 99.2%. These experimental facts, most likely, indicate the formation of a film on the surface of TiO2NTs which was more or less accomplished at T = 318.15 K and prevented
1 2 3 4 5
-0.0003 -0.0002 -0.0001 0.0000 0.0001 0.0002 0.0003
Current/A
Potential vs. Li / V
Fig. 3 Electrochemical stability window of LiTFSI/C2C2imTFSI electrolyte obtained at room temperature by using a glassy carbon (GC) working electrode and Li-metal foil as both counter and a reference elec- trode. The scan rate was 10 mV s−1
0.0 0.5 1.0 1.5
0.0 0.5 1.0 1.5
log ( -1 / P) log ( m / Scm2 mol-1 )
Fig. 2 Walden plot (Eq.4) for (■) C2C2imTFSI, () C1C2imTFSI [29], (●) C1C1imTFSI [28] and (□) LiTFSI/C2C2imTFSI electrolyte
further decomposition of the electrolyte. Because of this, cy- cling behaviour atT= 328.15 K was very stable and with very high Coulombic efficiency. The cycling behaviour after returning toT= 298.15 K is in favour of film formation.
Namely, even though insertion/extraction capacity declines (95.7/95.6 mAh g−1for the 150th cycle), compared with ca- pacities in the first 50 cycles, cycling behaviour from the 125th to 150th cycle may be considered exceptionally stable with no capacity drop and Coulombic efficiency as high as 99.9%. The change in colour of electrolyte from colourless to pale yellow indicates the existence of electrolyte decomposi- tion, as shown in Fig.S7.
The second Ti/TiO2 NTA electrode was GS cycled at different current densities (in orders 100, 50, 25, 100, 200 and finally 100μA cm−2) at room temperature (RT) (Fig.5b). Current rates were calculated from the mass of
NTs. During the first 250 cycles, the current rate was changed every 50 cycles, and the next 250 cycles current rate was constant and the same as at the beginning of cy- cling, Fig.5b. The capacity and Coulombic efficiency fol- low a similar trend during a current rate decrease, Fig.5b, as with temperature increase, Fig. 5a. By decreasing the current rate from 2.76 to 1.38 C charge/discharge capacity increases and Coulombic efficiency slightly decreases.
Further decrease of the current rate to 0.69 C initially de- creases Coulombic efficiency, but at the end of cycling at this current rate, charge and discharge capacity become stabilized and Coulombic efficiency attains 100%. During further cycling, at higher current rates, it remains at max- imum level of 100%. During the last 250 cycles at a current rate of 2.76 C, capacity fade is around 4%. Most likely, the formation of the film at the surface of electrode is complet- ed at a current rate of 0.69 C. After 500 cycles at RT, the colour of the electrolyte became bright yellow (Fig.S7).
1.0 1.5 2.0 2.5 3.0
-0.0008 -0.0006 -0.0004 -0.0002 0.0000 0.0002 0.0004 0.0006 0.0008
2 mV s-1 5 mV s-1
1 mV s-1
Current/Acm-2
Potential vs. Li/Li+/ V
1.0 1.5 2.0 2.5 3.0
-0.002 -0.001 0.000 0.001 0.002
328.15 K 318.15 K 308.15 K
Current/A·cm-2
Potential / V vs. Li/Li+
298.15 K
a
b
Fig. 4 Cyclic voltammograms of anatase TiO2NTAs in LiTFSI/
C2C2imTFSI electrolyte recorded at adifferent scan rates 1, 2 and 5 mV∙s−1atT = 298.15 K andb different temperatures (298.15–
328.15) K at scan rate 5 mV∙s−1
0 20 40 60 80 100 120 140 160
90 120 150 180 210 240 270
T = 328.15 K
T = 318.15 K
T = 308.15 K
T = 298.15 K
discharge capacity charge capacity
Capacity / mAhg-1
Cycle number
0
0 20 40 60 80 100
Coulombic efficiency / %
0 100 200 300 400 500
40 80 120 160 200 240
Discharge capacity Charge capacity
Capacity / mAh·g-1
Cycle number 2.76 C
1.38 C 0.69 C
2.76 C
5.52 C
2.76 C
0 20 40 60 80 100
Coulombic efficiency /
a
b
Fig. 5 Charge/discharge performance of anatase TiO2NTAs in LiTFSI/
C2C2imTFSI electrolyte atadifferent temperatures at a current rate of 3 C andbdifferent current rates: 0.69 C, 1.38 C, 2.76 C and 5.52 C at room temperature
Voltage profiles
The real theoretical capacity of TiO2should be 335 mAh g−1, but actual theoretical capacity is usually taken to be 167.5 mAh g−1, which corresponds to composition Li0.5TiO2
in which Li+ ion occupies the half of octahedral cites.
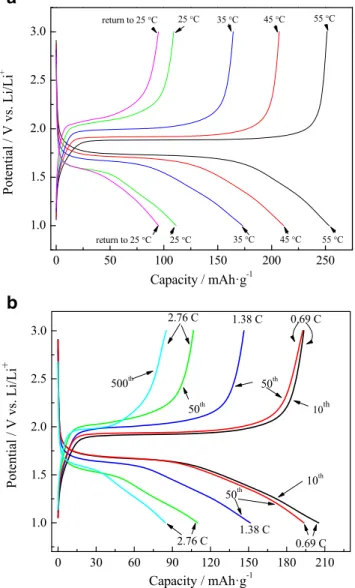
However, it had been demonstrated that for very small parti- cles, capacity can be larger [23]. Figure5ashows that charge/
discharge capacity of anatase TiO2NTAs, at a high current rate, may also exceed theoretical value. Figure6adepicts volt- age profiles in the charge and discharge for temperatures 298.15–328.15 K. Every voltage profile in discharge (lithium insertion) has three distinct regions. The first region is from 3 V down to the constant voltage plateau, which presents the second region, and the third region is from plateau down to 1 V. The first region is rather ascribed to electric double-layer
capacitance than to the formation of solid solution domain of TiO2and LixTiO2[81]. The region where the voltage is con- stant reflects coexistence of two phases: Li-poor Li0.026TiO2
and Li-rich Li~0.55TiO2. The region with inclined voltage pro- file down to 1 V designates the existence of surface storage mechanism which leads to pseudo-capacitive behaviour [81–83]. Figure6a shows that values of the overall capacity of anatase TiO2NTAs, which exceeds theoretical capacity, come from the large contribution of lithium surface storage capacity, which does not depend on bulk diffusion time. The relative contribution of surface storage capacity decreases with the temperature increase because of the increased diffu- sion coefficient of lithium-ion [37,38], but remains signifi- cant. The decrease in the difference between voltage plateaus in charge and discharge with the temperature increase shows the expected diminution of overall resistance of the cell at higher temperatures. The enlargement of difference between plateaus after returning toT= 298.15 K confirms the findings of EIS about the increase of overall resistance due to the in- crease of resistance of the electrolyte, formation of the film and the increase in charge transfer resistance. The decrease in capacity after returning toT= 298.15 K may come from the partial blocking of pores of NTs with solid products of elec- trolyte decomposition which can reduce the number of sites for lithium insertion.
Figure 6b shows voltage profiles during charging and discharging at room temperature at different current rates.
The influence of the decrease of the current rate on voltage profiles is expected to be similar to the influence of the tem- perature increase: capacity increases and the difference be- tween voltage plateaus become smaller. After 50 cycles, at the lowest current rate of 0.69 C at which the uppermost jump in Coulombic efficiency happens, the difference between volt- age profiles in charge and discharge slightly increases com- paring with 10th cycle. This shows a small increase of resis- tivity in the system which, having in mind achieved Coulombic efficiency of 100% may be attributed to film for- mation, as suggested above in the text. Figure6balso shows voltage profiles after 500 cycles in total, from which last 250 cycles are at current rate of 2.76 C, in comparison with profiles at the same current rate after 50 cycles. It can be seen that cycling between the 50th and 500th cycle at different current rates significantly decreases capacity. If we assume that there is no loss of active material of robust Ti/TiO2NTA electrode, this decrease may be attributed to blocking some of NT sites for lithium insertion with products of electrolyte decomposi- tion, most likely deeper inside NTs. The difference in voltage profiles in charge and discharge, at the same time, after 500 cycles becomes smaller then after 50 cycles. This indicates, in the first place, the decrease in film and charge transfer resis- tance during cycling at different rates.
FTIR, Raman and UV-VIS spectra of solutions after GS cycling were recorded, having in mind the observed change
0 50 100 150 200 250
1.0 1.5 2.0 2.5 3.0
55 C 45 C 35 C 25 C
return to 25 C
45 C 55 C 35 C 25 C return to 25 C
Potential/Vvs.Li/Li+
Capacity / mAh·g-1
0 30 60 90 120 150 180 210
1.0 1.5 2.0 2.5 3.0
Potential/Vvs.Li/Li+
Capacity / mAh·g-1 2.76 C 2.76 C
50th 500th
1.38 C
1.38 C
0.69 C 0.69 C
10th 50th
10th 50th
a
b
Fig. 6 Charge/discharge voltage profiles for anatase TiO2NTAs in LiTFSI/C2C2imTFSI electrolyte atadifferent temperatures and at a rate of 3 C andbdifferent current rates 0.69 C, 1.38 C, 2.76 C and 5.52 C at room temperature
from colourless to yellow colour. Only some minor changes were observed in FTIR spectra, and there were no changes in Raman spectra of these solutions in comparison with initial IL-based electrolyte. UV-Vis spectra showed the strong ab- sorption of formed compound(s), which must be present in very small concentration, undetectable with vibrational spec- troscopy (Figs.S8–S10).
Impedance measurements
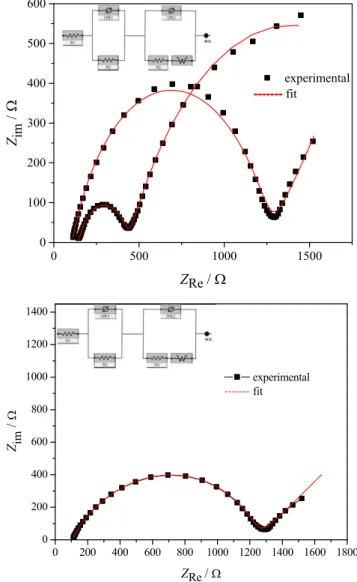
In order to confirm the formation of film on the electrode surface, impedance measurements were performed for the electrode which is subjected to GS cycling at different tem- peratures. EIS spectra were recorded after 50 cycles at T= 298.15 K, and after 150 cycles, again atT= 298.15 K, after the cell was subjected to galvanostatic charge/discharge regime at elevated temperatures (Fig.5). After 50 cycles, in
the Nyquist plot, impedance data form a depressed semicircle in a high- and middle-frequency region and unit slope line in a low-frequency region, Fig.7The semicircle can be fitted to two depressed semicircles, corresponding to film and charge transfer impedance and unit slope line is due to Warburg im- pedance. The film resistance, in this case, is much smaller from charge transfer resistance. After 150 cycles, two distinct semicircles can be observed in the Nyquist plot. The first semicircle is due to the film formed on the surface of TiO2
NTs during cycling at elevated temperatures, and the second semicircle to charge transfer process. Although more data at lower frequencies are missing for a more accurate fit, it may be concluded that both film and charge transfer resistance are increased after 150 cycles at different temperatures. Linear part in impedance plot is missing at low frequencies meaning that the process of lithium insertion/deinsertion is under kinet- ic control. The intercept of a semicircle withx-axis in the high- frequency region, in both cases, gives the resistance of elec- trolyte, which is changed to some extent after cycling at ele- vated temperatures. Finally, EIS confirmed the formation of film on electrode surface which, according to GS cycling ex- periments, was formed as a result of reductive decomposition of electrolyte. Most likely C2C2im+ion is reduced at electrode surface, but that remains to be confirmed.
Conclusions
The density, viscosity and electrical conductivity data were obtained at different temperatures for ionic liquid C2C2imTFSI as well as for 0.5-M solution of LiTFSI in C2C2imTFSI. The electrochemical properties of the LiTFSI/C2C2imTFSI system as a potential electrolyte for LIBs were tested by using anatase TiO2nanotube array electrode as anode material. Despite the low vapour pres- sure, non-flammability and room temperature electrochem- ical stability of ionic liquid–based electrolytes, which in- dicates their possible use in safer LIBs, the need for their testing at elevated temperatures was emphasized. In the case of LiTFSI/C2C2imTFSI electrolyte, electrochemical experiments at elevated temperatures up to T= 328.15 K not only showed the significant improvement in Li+ stor- age capability into Ti/TiO2NTAs electrode but also leads to the reductive decomposition of the electrolyte. Finally, such decomposition leads to the formation of a film on the electrode which significantly improves Coulombic effi- ciency but increases electrolyte and charge transfer resis- tance and decrease charge/discharge capacity of TiO2elec- trode at T= 298.15 K compared with the values before cycling at higher temperatures.
Acknowledgements I.S. is thankful for the support of the Lendület pro- gram of the Hungarian Academy of Sciences (96130).
0 500 1000 1500
0 100 200 300 400 500 600
Zim/
ZRe/
experimental fit
0 200 400 600 800 1000 1200 1400 1600 1800 0
200 400 600 800 1000 1200 1400
experimental fit
Z im/
ZRe/
Fig. 7 Nyquist plots obtained using electrochemical impedance spectroscopy for LiTFSI/C2C2imTFSI. The inset shows a circuit equivalent to the systems under consideration
Funding information This work was financially supported by the Ministry of Education, Science and Technological Development of Serbia under project contract ON172012, III 45014.
Compliance with ethical standards
Conflict of interest The authors declare that they have no conflict of interest.
References
1. Aurbach D, Markovsky B, Salitra G, Markevich E, Talyossef Y, Koltypin M, Nazar L, Ellis B, Kovacheva D (2007) Review on electrode–electrolyte solution interactions, related to cathode mate- rials for Li-ion batteries. J Power Sources 165:491–499.https://doi.
org/10.1016/j.jpowsour.2006.10.025
2. Kawamura T, Kimura A, Egashira M, Okada S, Yamaki J (2002) Thermal stability of alkyl carbonate mixed-solvent electrolytes for lithium ion cells. J Power Sources 104:260–264.https://doi.org/10.
1016/S0378-7753(01)00960-0
3. Eshetu GG, Bertrand J-P, Lecocq A, Grugeon S, Laruelle S, Armand M, Marlair G (2014) Fire behavior of carbonates-based electrolytes used in Li-ion rechargeable batteries with a focus on the role of the LiPF6and LiFSI salts. J Power Sources 269:804–
811.https://doi.org/10.1016/j.jpowsour.2014.07.065
4. Wang Q, Ping P, Zhao X, Chu G, Sun J, Chen C (2012) Thermal runaway caused fire and explosion of lithium ion battery. J Power Sources 208:210–224.https://doi.org/10.1016/j.jpowsour.2012.02.038 5. Diallo AB, Morgan AB, Len C, Marlair G (2013) An innovative experimental approach aiming to understand and quantify the actual fire hazards of ionic liquids. Energy Environ Sci 6:699–710.https://
doi.org/10.1039/C2EE23926D
6. Guerfi A, Dontigny M, Charest P, Petitclerc M, Lagacé M, Vijh A, Zaghib K (2010) Improved electrolytes for Li-ion batteries: mix- tures of ionic liquid and organic electrolyte with enhanced safety and electrochemical performance. J Power Sources 195:845–852.
https://doi.org/10.1016/j.jpowsour.2009.08.056
7. Fernicola A, Croce F, Scrosati B, Watanabe T, Ohno H (2007) LiTFSI-BEPyTFSI as an improved ionic liquid electrolyte for re- chargeable lithium batteries. J Power Sources 174:342–348.https://
doi.org/10.1016/j.jpowsour.2007.09.013
8. Cho E, Mun J, Chae OB, Kwon OM, Kim H-T, Ryu JH, Kim YG, Oh SM (2012) Corrosion/passivation of aluminum current collector inbis(fluorosulfonyl)imide-based ionic liquid for lithium-ion batte- ries. Electrochem Commun 22:1–3.https://doi.org/10.1016/j.
elecom.2012.05.018
9. Peng C, Yang L, Zhang Z, Tachibana K, Yang Y (2007) Anodic behavior of Al current collector in 1-alkyl-3-methylimidazolium bis[(trifluoromethyl)sulfonyl] amide ionic liquid electrolytes. J Power Sources 173:510–517.https://doi.org/10.1016/j.jpowsour.
2007.05.006
10. Bazito FFC, Kawano Y, Torresi RM (2007) Synthesis and charac- terization of two ionic liquids with emphasis on their chemical stability towards metallic lithium. Electrochim Acta 52:6427– 6437.https://doi.org/10.1016/j.electacta.2007.04.064
11. Olschewski M, Gustus R, Marschewski M, Hoefft O, Endres F (2014) Spectroscopic characterization of the interaction of lithium with thin films of the ionic liquid 1-octyl-3-methylimidazolium bis(trifluoromethylsulfonyl)amide. Phys Chem Chem Phys 16:
25969–25977.https://doi.org/10.1039/C4CP03091E
12. Mun J, Jung Y, Yim T, Lee H, Kim H, Kim Y, Oh S (2009) Electrochemical stability ofbis(trifluoromethanesulfonyl)imide- based ionic liquids at elevated temperature as a solvent for a
titanium oxide bronze electrode. J Power Sources 194:1068– 1074.https://doi.org/10.1016/j.jpowsour.2009.05.048
13. Shimizu M, Usui H, Matsumoto K, Nokami T, Itoh T, Sakaguchi H (2014) Effect of cation structure of ionic liquids on anode properties of Si electrodes for LIB. J Electrochem Soc 161:A1765–A1771.
https://doi.org/10.1149/2.0021412jes
14. Choi J-A, Kim D-W, Bae Y-S, Song S-W, Hong S-H, Lee S-M (2011) Electrochemical and interfacial behavior of a FeSi2.7thin film electrode in an ionic liquid electrolyte. Electrochim Acta 56:
9818–9823.https://doi.org/10.1016/j.electacta.2011.08.080 15. Srour H, Chancelier L, Bolimowska E, Gutel T, Mailley S, Rouault
H, Santini CC (2015) Ionic liquid-based electrolytes for lithium-ion batteries: review of performances of various electrode systems. J Appl Electrochem 46:149–155. https://doi.org/10.1007/s10800- 015-0905-1
16. Tachikawa N, Park JW, Yoshida K, Tamura T, Dokko K, Watanabe M (2010) Limiting current density in ionic liquid electrolyte for lithium batteries. Communication 78:342–352.https://doi.org/10.
5796/electrochemistry.78.349
17. Seki S, Kobayashi Y, Miyashiro H, Ohno Y, Usami A, Mita Y, Kihira N, Watanabe M, Terada N (2006) Lithium secondary batte- ries using modified-imidazolium room-temperature ionic liquid. J Phys Chem B 110:10228–10230. https://doi.org/10.1021/
jp0620872
18. MacFarlane DR, Tachikawa N, Forsyth M, Pringle JM, Howlett PC, Elliott GD, Davis JH, Watanabe M, Simon P, Angell CA (2014) Energy applications of ionic liquids. Energy Environ Sci 7:232–250.https://doi.org/10.1039/c3ee42099j
1 9 . Wa n g Z , C a i Y, D o n g T, C h e n S , L u X ( 2 0 1 3 ) Triethylbutylammoniumbis(trifluoromethane-sulphonyl)imide ionic liquid as an effective electrolyte additive for Li-ion batteries.
Ionics 19:887–894.https://doi.org/10.1007/s11581-012-0820-y 20. Fernicola A, Scrosati B, Ohno H (2006) Potentialities of ionic liq-
uids as new electrolyte media in advanced electrochemical devices.
Ionics 12:95–102.https://doi.org/10.1007/s11581-006-0023-5 21. Roy P, Berger S, Schmuki P (2011) TiO2nanotubes: synthesis and
applications. Angew Chem Int Ed 50:2904–2939.https://doi.org/
10.1002/anie.201001374
22. Mor GK, Shankar K, Paulose M, Varghesen OK, Grimes CA (2006) Use of highly-ordered TiO2nanotube arrays in dye- sensitized solar cells. Nano Lett 6:215–218.https://doi.org/10.
1021/nl052099j
23. Meekins BH, Kamat PV (2009) Got TiO2nanotubes? Lithium ion intercalation can boost their photoelectrochemical performance.
ACS Nano 3:3437–3446.https://doi.org/10.1021/nn900897r 24. Park SG, Yang JJ, Rho JW, Kim HI, Habazaki H (2014)
Electrochemical behavior of TiO2nanotube/Ti prepared by anod- izing for micro-lithium ion batteries. J Korean Electrochem Soc 17:
13–17.https://doi.org/10.5229/JKES.2014.17.1.13
25. Ling L, Bai Y, Li Y, Ni Q, Wang Z, Wu F, Wu C (2017) Quick activation of nanoporous anatase TiO2as high-rate and durable anode materials for sodium-ion batteries. ACS Appl Mater Interfaces 9:39432–39440.https://doi.org/10.1021/acsami.
7b13927
26. Yan D, Yu C, Zhang X, Li J, Li J, Lu T, Pan L (2017) Enhanced electrochemical performances of anatase TiO2nanotubes by syner- getic doping of Ni and N for sodium-ion batteries. Electrochim Acta 254:130–139.https://doi.org/10.1016/j.electacta.2017.09.120 27. Liu S, Luo Z, Tian G, Zhu M, Cai Z, Pan A, Liang S (2017) TiO2
nanorods grown on carbon fiber cloth as binder-free electrode for sodium-ion batteries and flexible sodium-ion capacitors. J Power Sources 363:284–290.https://doi.org/10.1016/j.jpowsour.2017.07.098 28. Xu Y, Lotfabad EM, Wang H, Farbod B, Xu Z, Kohandehghan A,
Mitlin D (2013) Nanocrystalline anatase TiO2: a new anode mate- rial for rechargeable sodium ion batteries. Chem Commun 49:
8973–8975.https://doi.org/10.1039/C3CC45254A