Continuous non-invasive blood pressure monitoring via 3D force sensor and its applications in diagnostics
Sándor Földi
This dissertation is submitted for the degree of Doctor of Philosophy
Supervisors:
Dr. György Cserey, Dr. Péter Sótonyi
Roska Tamás Doctoral School of Science and Technology Faculty of Information Technology and Bionics
Pázmány Péter Catholic University Budapest, 2019
Összefoglaló
A szív- és érrendszer a teljes emberi szervezetet behálózza, ezért vizsgálatának fontos szerepe van az egészségügyben. A vér kémiai összetételének vizsgálatát széles körben alkalmazzák diagnosztikai célokra, de sokkal több információ is kinyerhető ebből a rend- szerből. A vérnyomás és annak hullámterjedése egy jelenleg még kiaknázatlan diag- nosztikai lehetőség és egyben alapvető a betegmegfigyelésben is. Manapság diagnosztikai célra leginkább a pillanatnyi vérnyomásértéket használják. Monitorozási célra csak egy széles körben használt megoldás van, az arany standard artériás kanül, mely egy invazív módszer. Ez a disszertáció egy újszerű nem-invazív folytonos vérnyomás monitorozási módszert mutat be, mely betegmegfigyelésre és diagnosztikai célokra is használható.
Ez az újszerű módszer egy 3D erőmérő érzékelőn alapszik. Ezt az érzékelőt a Pázmány Péter Katolikus Egyetem két végzett doktora fejlesztette ki. Nagyon kis erőhatásokat is képes érzékelni, akár az artéria falának mozgását is. Megoldásomban ezt az érzékelőt a csuklónál a radiális artéria fölé kell helyezni, ahol folytonos nyomás görbét képes rögzíteni, mellyel monitorozási és diagnosztikai célok is megvalósíthatók.
Jelen disszertáció két fő témakört mutat be, a folytonos vérnyomás monitorozás validálását és a rendszer pulzusdiagnosztikai alkalmazhatóságának vizsgálatát. A folytonos monitorozás validálása egy másik nem-invazív módszerrel, Millar tonométerrel és invazív artériás kanüllel történt. Utóbbinak két fő lépése volt, először a hullámforma összevetése, ahol csak a felvett görbék alakja számított szívciklusonként, majd a tényleges vérnyomás értékek összehasonlítása. A pulzusdiagnosztika esetében egy 175 alanyt magába foglaló adatbázis felvételét valósítottam meg.
Az eredmények erős korrelációt mutattak, mind a Millar tonométerrel, mind az artériás kanüllel szemben. Az átlagos korreláció 0,85 és 0,9 közötti. A vérnyomásértékek össze- hasonlításához Bland-Altman módszert alkalmazva a legtöbb érték az Association for the Advancement of Medical Instrumentation (AAMI) által felállított nemzetközi köve- telményeken belülre esett, ami 5 Hgmm átlagtól való eltérést és 8 Hgmm szórást jelent.
Kivételt képzett a szisztolés érték az invazív kanülhöz hasonlítva. A diagnosztikai té- makörben sikerült hullámforma jelölteket találni néhány egészségi állapotra, mely analóg az irodalomban megtalálhatókkal.
A disszertációm egy rövid bevezetéssel indul, majd az elméleti háttérrel folytatódik, bemutatva a szív- és érrendszer fiziológiai hátterét, a vérnyomásmérési módszereket és a pulzusdiagnosztikát. Három fő fejezet foglalja össze a munkámat, az általam alkal- mazott módszereket és az elért eredményeimet. Az utolsó fejezet összefoglalja a tézis mondataimat és a bemutatott módszer alkalmazási területeit.
Abstract
Studying the cardiovascular system has a great importance in healthcare as it covers every organs. Besides the widely used diagnostic values acquired by chemical composition of the blood, the cardiovascular system carries much more diagnostic information. Blood pressure (BP) and its propagating waveform also have great potential in diagnostics and it is crucial for patient monitoring. Today, for diagnostics, mainly just the momentary BP value is used. For monitoring, there is only one widely used method, the gold standard arterial cannulation, which is an invasive method with risks. This dissertation introduces a novel non-invasive BP measuring method that can be used for both diagnostics and patient monitoring.
This novel method is based on a 3D force sensor developed by two former PhD students at Pázmány Péter Catholic University. This sensor is sensitive enough to be able to detect alterations of the arterial wall. In my solution, the sensor is attached to the wrist over the radial artery and it can continuously record the pressure waveform, providing information for monitoring and diagnostic purposes.
This dissertation focuses on two main applications of the mentioned novel method:
continuous BP monitoring and pulse diagnostics. The continuous monitoring capabilities were validated with another non-invasive method, a Millar tonometer and with the inva- sive arterial cannula. The latter comparison had two main steps, first, only the waveform was compared, exact BP values were not taken into consideration, and the second, where even the exact BP value comparison was studied. A pulse diagnostic pilot study including 175 participants was conducted as well.
Results suggest a strong similarity compared to the Millar tonometer and the invasive arterial cannula. Average correlation of the compared BP signals were between 0.85 and 0.9. For BP values Bland-Altman plots were utilized, and most of the values, except for systole, when compared to the invasive arterial cannula were within the international re- quirements set by Association for the Advancement of Medical Instrumentation (AAMI), meaning the bias is within 5 mmHg and the standard deviation is within 8 mmHg. In the diagnostic study different health condition related characteristic waveforms published in previous studies can be detected.
My dissertation starts with a very short introduction and a theoretical background chapter, introducing physiological basis of the cardiovascular system, BP measurement methods and pulse diagnostics. My work, the methods I have applied and the results I have gained, is summarized in three chapters. The last chapter includes my Thesis sentences and the application areas of the presented methods.
Glossary
aorta – The largest artery, originating from the left ventricle of the heart.
arterial cannulation – An invasive method used for continuous arterial blood pres- sure monitoring in acute and critical care.
arteriole – A smaller artery segment which has more smooth muscle than large arteries. It ends in capillaries.
atherosclerosis – A chronic disease characterized by abnormal thickening and hard- ening of the arterial walls with resulting loss of elasticity.
atrioventricular valve – Heart valve between each atrium and ventricle.
atrium – A chamber of the heart receiving blood from the corresponding vein and forwards it to the ventricles.
beat-to-beat – Every cardiac cycle, each heartbeat.
brachial artery – The main artery of the upper arm. It divides into the radial and the ulnar arteries.
calcification – A process resulting in stiffening of the arteries. It is caused by the deposition of or conversion into calcium carbonate or some other insoluble calcium compounds.
capillaries – The smallest arterial elements withµmdiameters.
dicrotic notch – Also called as incisura. The edge point of thedicrotic wave.
dicrotic wave – A forward wave in the blood pressure signal, a small uprise in the pressure waveform, which is created by the collision of the heart valves and the blood after the closure of the valves.
insicura – See dicrotic notch.
missbeat – An extra beat of the heart, which happens earlier than the end of the cardiac cycle, usually in the repolarisation phase of the heart muscles. As the heart ventricles cannot be filled with blood during this shorter time, the missbeat usually have a lower systolic blood pressure.
myocardial cell – Specialized muscle cells of the heart.
percussion wave – A forward wave in the blood pressure signal reflecting the systolic event.
pericardium – A cavity containing the heart.
precardial – In front of the heart, on the external surface of the chest.
pulmonary circulation – The passage of blood from the right side of the heart through arteries to the lungs where the oxygen absorption occurs and returning to the left side of the heart by veins.
pulmonary trunk – The pulmonary artery originating from the right ventricle of the heart. It forwards the blood from the heart to the lungs.
pulse diagnosis – A non-invasive diagnostic method based on the traditional Chinese medicine.
pulse diagnostics – A non-invasive diagnostic method analysing the blood pressure waveform.
pulse transit time – The time required by the blood pressure wave to arrive at the peripheral measurement point (usually at the wrist over the radial artery) from the heart.
radial artery – An arterial segment originating from the brachial artery located at the forearm.
reflected wave – A backward wave in the blood pressure signal, the reflection from the peripheral arteries.
single-period signal – In this thesis it is considered as the continuous blood pressure waveform of a single heartbeat.
systemic circulation – The passage of arterial blood from the left atrium of the heart through the left ventricle and the systemic arteries. It is connected to most of the organs, except the lungs. It ends in the right atrium.
tonometry – A continuous non-invasive blood pressure measuring method.
tunica externa – Also called adventitia. The outer layer of the blood vessel wall. It is composed of collagenous and elastic fibers.
tunica media – The middle part of the blood vessel wall consisting mainly of circular muscle fibers.
ventricle – A chamber of the heart which receives blood from a corresponding atrium. It forwards the blood to the arteries.
venules – Small vein elements which collect the blood from the capillaries and forward it to veins.
Contents
1 Introduction 1
2 Theoretical background 3
2.1 Physiology of the cardiovascular system . . . 3
2.1.1 Heart and circulation . . . 3
2.1.2 Elements of the vascular system . . . 6
2.1.3 Cardiac cycle . . . 7
2.1.4 Pressure wave propagation and waveform . . . 8
2.1.5 External and internal factors affecting the cardiovascular system . 10 2.2 Blood pressure measurement . . . 10
2.2.1 Invasive blood pressure monitoring . . . 11
2.2.2 Non-invasive blood pressure monitoring methods . . . 11
2.2.2.1 Intermittent BP monitoring . . . 12
2.2.2.2 Continuous BP monitoring . . . 13
2.3 Automatized pulse diagnostics . . . 18
3 Blood pressure waveform measurement using 3D force sensor 23 3.1 OptoForce/OnRobot sensor . . . 23
3.2 The measurement environment and the protocol based on the 3D pressure sensor . . . 25
3.3 Repeatability of sensor attachment . . . 28
4 Novel non-invasive continuous blood pressure monitoring 30 4.1 Validation by Millar tonometer . . . 30
4.1.1 Measurement devices and protocol for non-invasive validation . . . 30
4.1.2 Characteristics of the participants for non-invasive validation . . . 31
4.1.3 Data analysis for non-invasive validation . . . 31
4.1.4 Repeatability analysis for non-invasive validation . . . 33
4.1.5 Statistical methods for non-invasive validation . . . 34
4.2 Results of non-invasive validation . . . 35
4.3 Discussion for non-invasive validation . . . 43
i
CONTENTS ii
4.4 Validation by invasive arterial cannula . . . 45
4.4.1 Waveform comparison study . . . 45
4.4.1.1 Steps of analysis for waveform comparison study . . . 46
4.4.1.2 Results for waveform comparison study . . . 48
4.4.1.3 Discussion for waveform comparison study . . . 49
4.4.2 Continuous blood pressure comparison study . . . 51
4.4.2.1 Measuring devices for continuous blood pressure compar- ison study . . . 51
4.4.2.2 Measurement protocol for continuous blood pressure com- parison study . . . 51
4.4.2.3 Data analysis for continuous blood pressure comparison study . . . 52
4.4.2.4 Calibration of the non-invasive signal for continuous blood pressure comparison study . . . 53
4.4.2.5 Statistical methods for continuous blood pressure com- parison study . . . 53
4.4.2.6 Results for continuous blood pressure comparison study . 54 4.4.2.7 Discussion for continuous blood pressure comparison study 57 5 Pulse diagnostics 60 5.1 Signal processing . . . 60
5.1.1 Graphical User Interface . . . 62
5.2 Measurements . . . 65
5.3 Feature extraction . . . 68
5.4 Clustering . . . 70
5.5 Results and discussion . . . 72
6 Conclusions, new scientific results, applications 77 6.1 Thesis group 1. . . 78
6.2 Thesis group 2. . . 79
6.3 Thesis group 3. . . 81
6.4 My participation in Theses as a co-supervisor . . . 82
6.4.1 Examination of physical stress caused morphological alterations on arterial pressure waveform from pulse diagnosis perspective . . . . 82
6.4.2 Filtering motion artefacts during continuous blood pressure mea- surement . . . 82
6.4.3 Determination of pulse transit time with non-invasive pressure wave- form and ECG . . . 83
6.4.4 Non-invasive cuff-based blood pressure measurement using the 3D force sensor . . . 83
CONTENTS iii 6.4.5 Implementation of continuous non-invasive blood pressure monitor-
ing with 3D force sensors and automatized sensor placement . . . . 84 6.4.6 Determination of quantitative quality index for arterial pressure
waveform . . . 84 6.5 Future development ideas . . . 85 6.6 Applications . . . 86
Acknowledgements 89
References 90
List of Figures
2.1 Structure of the heart. . . 4
2.2 The conduction system of the heart. . . 5
2.3 Positions of the precordial electrodes on the chest. . . 5
2.4 Connection between the elements of the vascular system. . . 7
2.5 Events during a cardiac cycle with different modalities. . . 8
2.6 A typical healthy BP waveform with its characteristic points. P–peak of the percussion wave, Ri–Initial point of the reflected wave, R–peak of the reflected wave, Di–initial point of the dicrotic wave, D–dicrotic notch. . . 9
2.7 E. J. Marey’s sphygmograph. . . 13
2.8 The basic concept of tonometry. The measuring position is at the wrist over the radial artery. The tonometric sensor must be pressed to the artery and then the artery have to be pressed to the bone to become semmi-occluded. 14 2.9 Summary of the Peñaz principle-based non-invasive continuous BP moni- toring method. . . 16
3.1 Schematic figure of the OptoForce sensor. 1 – sensing surface, 2 – reflective layer, 3 – light emitter, 4 – sensing element. . . 24
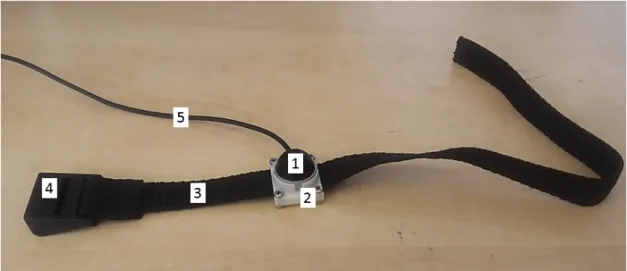
3.2 Final version of the sensor attachment. 1 – OptoForce OMD-20-SE-40N sensor, 2 – sensor holder, 3 – band, 4 – buckle, 5 – wire of the sensor . . . 26
3.3 The placement of the presented system at the wrist. 1 – OptoForce OMD- 20-SE-40N sensor, 2 – sensor holder, 3 – band, 4 – buckle, 5 – wire of the sensor . . . 27
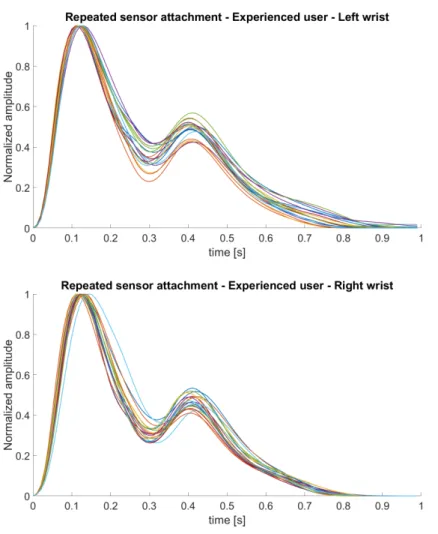
3.4 Averaged and normalized single-period signals as results of repeated sensor attachment by an experienced user. . . 28
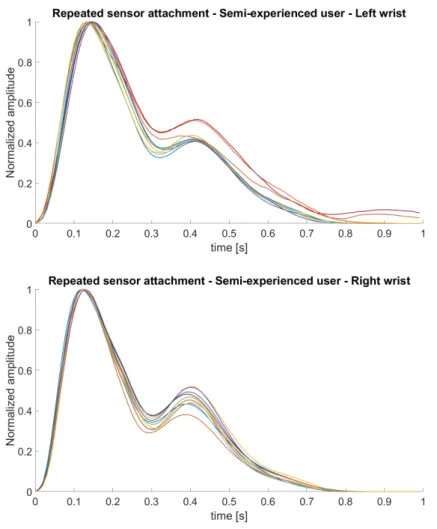
3.5 Averaged and normalized single-period signals as results of repeated sensor attachment by a semi-experienced user. . . 29
4.1 Summary of the measuring protocol. . . 32
4.2 Summary of our study. Opto refers to the 3D force sensor based system based on OptoForce sensor, and Tono refers to applanation tonometry based on Millar tonometer. . . 35
iv
LIST OF FIGURES v 4.3 20 seconds-long section of the best correlated signal pair without compen-
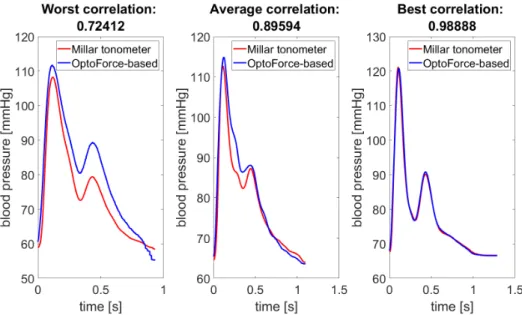
sation of the blood pressure difference between the two arms (correlation coefficient is 0.9889) . . . 38 4.4 The averaged single-period signals of the worst (after exclusion of the 12
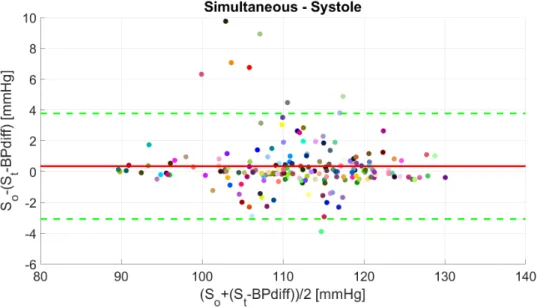
outliers), the best and an average correlated signal pair. Correlation values refer to the complete continuous 1-minute long measurements. . . 38 4.5 Bland-Altman plot of the simultaneously measured signals’ systolic pres-
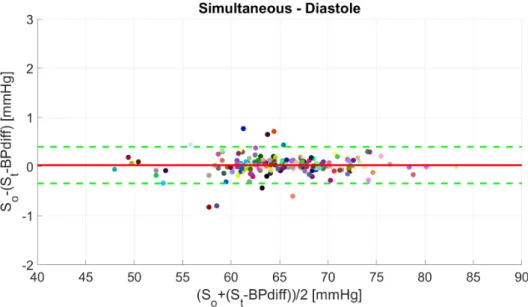
sure. The red line is the mean difference, and the dashed green lines are the limits of agreement (1.95×standard deviation) compensated with the within subject variation of repeated measurements. The mean systolic difference and standard deviation is 0.35±1.75 mmHg. . . 39 4.6 Bland-Altman plot of the simultaneously measured signals’ diastolic pres-
sure. The red line is the mean difference, and the dashed green lines are the limits of agreement (1.95×standard deviation) compensated with the within subject variation of repeated measurements. The mean diastolic difference and standard deviation is 0.02±0.19 mmHg. . . 40 4.7 Bland-Altman plot of the simultaneously measured signals’ MAP. The red
line is the mean difference, and the dashed green lines are the limits of agreement(1.95×standard deviation) compensated with the within sub- ject variation of repeated measurements. The mean MAP difference and standard deviation is 2.88±2.42 mmHg. . . 40 4.8 Bland-Altman plot of the simultaneously measured signals’ pressure at the
incisura peak. The red line is the mean difference, and the dashed green lines are the limits of agreement (1.95×standard deviation) compensated with the within subject variation of repeated measurements. The mean difference in incisura pressure and standard deviation is 3.84±3.90 mmHg. 41 4.9 Bland-Altman plot of the signals’ systolic pressure measured on the same
arms. The red line is the mean difference, and the dashed green lines are the limits of agreement (1.95×standard deviation). The mean systolic difference and standard deviation is 0.42±1.77 mmHg. . . 41 4.10 Bland-Altman plot of the signals’ diastolic pressure measured on the same
arms. The red line is the mean difference, and the dashed green lines are the limits of agreement (1.95×standard deviation). The mean diastolic difference and standard deviation is 0.02±0.74 mmHg. . . 42 4.11 Bland-Altman plot of the signals’ MAP measured on the same arms. The
red line is the mean difference, and the dashed green lines are the limits of agreement (1.95×standard deviation). The mean MAP difference and standard deviation is 3.02±2.26 mmHg. . . 42
LIST OF FIGURES vi 4.12 Bland-Altman plot of the signals’ pressure at the incisura peak measured
on the same arms. The red line is the mean difference, and the dashed green lines are the limits of agreement (1.95×standard deviation). The mean difference in incisura pressure and standard deviation is 3.85±3.43 mmHg. . . 43 4.13 Summary of the signal processing steps. The measured signal is filtered
with a cascaded adaptive filter, which has two main parts: wavelet de- composition filter and Spline estimation filter. Then the filtered signal is segmented into single period signals. . . 47 4.14 An example of a well correlated invasive and non-invasive continuous BP
signal section. In this figure for better visibility, the normalization was made to the highest amplitude invasive signal in the presented segment. . 48 4.15 An example of a low correlated invasive and non-invasive continuous BP
signal section. In this figure for better visibility, the normalization was made to the highest amplitude invasive signal in the presented segment before the movement noise. . . 49 4.16 The distribution of RMSE values for simultaneously recorded invasive and
non-invasive BP signals’ systolic (A), diastolic (B) and MAP (C) BP values. 55 4.17 (A), Bland-Altman plot of the simultaneously measured signals’ systolic
pressure for each participant with the mean and limits of agreement. The red line is the mean difference for every participant, and the dashed green lines are the average limits of agreement (1.95×standard deviation). The mean systolic difference with standard deviation is −9.53±4.69 mmHg.
(B), the same Bland-Altman plot with all the simultaneously measured invasive and non-invasive systolic pairs. . . 55 4.18 (A), Bland-Altman plot of the simultaneously measured signals’ diastolic
pressure for each participant with the mean and limits of agreement. The red line is the mean difference for every participant, and the dashed green lines are the average limits of agreement (1.95×standard deviation). The mean diastolic difference with standard deviation is −0.26±3.06 mmHg.
(B), the same Bland-Altman plot with all the simultaneously measured invasive and non-invasive diastolic pairs. . . 56 4.19 (A), Bland-Altman plot of the simultaneously measured signals’ MAP for
each participant with the mean and limits of agreement. The red line is the mean difference for every participant, and the dashed green lines are the average limits of agreement (1.95× standard deviation). The mean MAP difference with standard deviation is 1.25±2.26 mmHg. (B), the same Bland-Altman plot with all the simultaneously measured invasive and non-invasive MAP pairs. . . 56
LIST OF FIGURES vii 5.1 The Open tab of the GUI. In the upper panel, the raw sensor output of
the first light sensing element can be seen. In the bottom panel, the vector length is depicted, calculated from the raw sensor data. For both panels, the x-axis is the time in seconds. . . 63 5.2 The signal processing tab of the GUI. . . 63 5.3 The Single-period signal tab of the GUI. In both panels the selected single
period signal is shown, in the bottom, the characteristic points are also marked. The y-axis is the signal Amplitude after signal processing, the x-axis is the time in seconds. . . 64 5.4 Proportion of men and women in different age groups in the recorded
database. . . 66 5.5 Summary of the measuring protocol for pulse diagnostic measurements. . 67 5.6 Absolute features of a pulse signal. . . 68 5.7 Features for pulse signal clustering into healthy and hypertensive groups. . 71 5.8 The graphics on the left are examples from [1] (x-axis is the time for a
100 Hz signal, y-axis is the measured amplitude), and the graphics on the right are our results. . . 72 5.9 The graphics on the left are examples from [2] (x-axis is the time for a
100 Hz signal, y-axis is the measured amplitude) reprinted with permission from Elsevier, and the graphics on the right are our results. . . 73 5.10 Healthy signals in different age groups. . . 73 5.11 Different health conditions. . . 74 5.12 Results of the clustering algorithms with several example signals in each
group. . . 75
List of Tables
4.1 Characteristics of participants . . . 31
4.2 Repeatability of tonometer measurements. . . 36
4.3 Correlation and RMSE between simultaneously recorded non-invasive con- tinuous blood pressure signals in the time domain. Average of measurement 1–3: the 3D force sensor based system on the left arm, tonometer on the right arm. Average of measurement 4–6: the 3D force sensor based system on the right arm, tonometer on the left arm. . . 37
4.4 Summary of average bias and standard deviation values for systolic, dias- tolic, MAP and incisura pressure presented in Figure 4.5–4.12. . . 39
4.5 Characteristics of participants . . . 46
4.6 Correlation of single-period signals . . . 48
4.7 Characteristics of participants . . . 51
5.1 Characteristics of the participants . . . 66 5.2 Statistics summarized according to health conditions of the participants . 67
viii
Chapter 1
Introduction
Cardiovascular monitoring is crucial in patient monitoring, during surgeries, in the am- bulance and in intensive care units. In some critical stakes, it is vital to know the blood pressure (BP) values at any moment for the practitioners to be able to take immediate actions when the condition of the patient changes suddenly. Today, the gold standard, widely used method for continuous BP measurements is the invasive arterial cannulation.
So far, this method is the most accurate solution, however it has many risks such as haematoma formation, bleeding at the place of puncture and peripheral nerve injury [3].
The classic non-invasive BP measuring method was finalized by Korotkov in the early 1900s. This cuff based method is still widely used, and has not been developed much in the recent decades. The main development was the oscillometric measuring method that led to the usage of the currently most well-known and applied automatized BP measuring devices. However, this method cannot provide detailed information, only one systolic and diastolic BP value and the actual pulse rate at 40 seconds time frame.
There is a growing need for a continuous BP measuring device, due to its potential beneficial features for both practitioners and patients. There are several solutions avail- able, but none of them have been used widespread. It is a great challenge to create a robust non-invasive solution. The most promising solutions are tonometric devices, Peñaz principle based devices and pulse transit time (PTT) based solutions. All of these devices will be introduced in details in the next chapter.
The question would arise, why are these continuous non-invasive BP monitors not used in everyday practice? Is there any other solution which could provide an easier, more robust, more accurate and comfortable option for healthcare workers? Can a non- invasive monitoring device reach the accuracy of the gold standard invasive method? In this Thesis, I attempt to provide answers to some of these questions by introducing a 3D force sensor based novel BP monitoring method.
The OptoForce 3D force sensor-based solution is advantageous, because the 3 dimen- sional vector can provide information about the relative position of the sensor and the artery. Knowing this relative position is useful during sensor placement, it can help the
1
2 user to find the best measuring position. This system can be also more robust during measurements, small position changes of the sensor on the wrist caused by patient move- ments would not require immediate repositioning, the signal can remain good quality.
Are there other ways how the continuous BP signal can be used? These signals are not only important in patient monitoring, but they can also be important in diagnostic procedures. The shape, characteristics of the signal can provide information about the cardiovascular system and according to the traditional Chinese medicine it can reflect to several internal organ related diseases. The method utilizing these information is called pulse diagnostics. These information can be extracted from the pulse, more specifically from the continuous BP waveform.
Today trends show that an easy to use, compact monitoring device would be a great tool for everyday use as well. There are smart watches, smart phone extensions that can provide information about heart rate, blood oxygenation level and even blood pressure.
The accuracy of these devices are still questionable, but by using better and better sensors, it can improve a lot. Also, if there was a sensor, attached to a smart device, which can record the blood pressure waveform and analyse it, a new home diagnostic tool could be developed. This would be a great step forward in prevention by providing an early diagnostic suggestion.
In the following chapters, the theoretical background is summarized including physiol- ogy of the cardiovascular system, blood pressure measuring and the current technologies and the background of pulse diagnostics. Then, I introduce my work in three main sec- tions, the applied 3D force sensor and its attachment to the wrist, the blood pressure monitoring and the pulse diagnostics. Afterwards, I conclude my Thesis with summariz- ing new scientific results and application possibilities of my work.
Chapter 2
Theoretical background
This chapter summarizes the principal theoretical background related to the main topics of Thesis, starting with the physiological knowledge of the cardiovascular system and moving to the current technologies and studies in the cardiovascular monitoring and diagnostics.
2.1 Physiology of the cardiovascular system
It is essential to summarize the basics of the cardiovascular system’s physiology to un- derstand the cardiac cycle and other processes that take part in creation of the blood pressure waveform.
2.1.1 Heart and circulation
Heart is the engine of the cardiovascular system, an organ in the chest covered by a double-walled sac, called the pericardium. The pericardium’s walls are very close to each other, between them there is aqueous fluid, which is responsible for the protection of the heart during its beating movement [4].
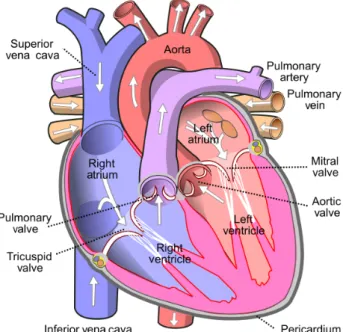
Heart is the centre of the cardiovascular system, which divides this system into two parts, the pulmonary and the systemic circulation. It has four chambers, two atria and two ventricles as shown in Figure 2.1. (source of this figure: Wikipedia1). The left side of the heart is the part of the systemic circulation, the right side is part of the pulmonary circulation. The atria receives the blood from the veins and forwards it to the ventricles.
Heart valves are the main rectifier elements of the cardiovascular system. There are four valves, two atrioventricular valves, which do not allow the blood to flow back from the ventricles to the atria, and a pulmonary and an aortic valve, which prevent the back flow from the pulmonary trunk and the aorta, respectively, to the ventricles. The opening and the closure of these valves are passive processes, caused by the pressure difference between the two sides of them. The ventricles are getting filled with blood and they
1https://commons.wikimedia.org/wiki/File:Diagram_of_the_human_heart_(cropped).svg
3
2.1 Physiology of the cardiovascular system 4 pump the blood into the arteries. The wall of the left ventricle is thicker than the right side’s, because maintaining the systemic circulation requires more pressure, thus more heart muscle.
Figure 2.1: Structure of the heart.
Pulmonary circulation consists only of the lungs. It starts of the right ventricle of the heart and ends in the left atria. The main function of the pulmonary circulation is the gas exchange in the blood, the CO2 leaves the blood cells, and oxygen attaches to it.
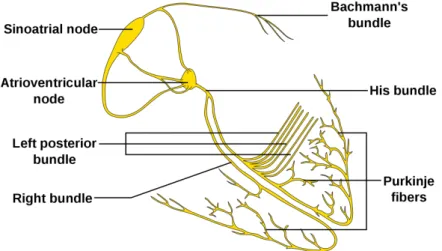
The heart consists mostly of myocardial cells, which is a specially differentiated mus- cle cell. These myocardial cells are connected with gap junctions which provides a very fast depolarization, thus a synchronized, almost simultaneous contraction [5]. Another important property of these cells is that they do not need to rest, they constantly work through the life. Some of these myocardial cells further differentiated creating the con- duction system of the heart. This conduction system, shown in Figure 2.2. (source of this figure: Wikipedia2) consists of the sinus node, the atrioventricular node, the bundles of His and the Tawara branches.
In average, heart beats 72 per minute, it is called normal heart rate. If this rate is over 100 beats per minute (bpm), then it is called tachycardia and if it is below 50 bpm, it is called bradycardia. The heart has its own pacemaker function, but in a normal case, heart rate is controlled by the autonomous nervous system through signals sent to the sinus node. The electric signal travels through the wall of the atrium to the atrioventricular node. From this node, the signals get to the ventricles, propagating through the bundle
2https://commons.wikimedia.org/wiki/File:ConductionsystemoftheheartwithouttheHeart-en.
svg
2.1 Physiology of the cardiovascular system 5
Figure 2.2: The conduction system of the heart.
of His, then the Tawara branches, reaching the ventricle’s wall. By the spreading Tawara branches and the fast conducting of the ventricle wall, the myocardial cells are able to contract almost simultaneously.
The heart is usually examined by electrocardiograph (ECG), which measures the electric activity of the cardiac muscles. By ECG the potential changes can be measured.
To measure this activity, electrodes are attached to the chest. The positions of the electrodes are shown in Figure. 2.3. (source of this figure: Wikipedia3). The muscle activity and thus the measurable electric signal reflects the events of the cardiac cycle, which is introduced in the corresponding subsection later in this dissertation.
Figure 2.3: Positions of the precordial electrodes on the chest.
3https://commons.wikimedia.org/wiki/File:Precordial_leads_in_ECG.png
2.1 Physiology of the cardiovascular system 6 In this Thesis, the main focus is on the systemic circulation. This circulation covers the whole body, all the organs except the lungs. The main function of the systemic circu- lation is transporting oxygen and nutrient to the cells of the organs and the body while also collecting the metabolic by-products. Therefore, systemic circulation is connected and interacts with almost all cells of the human body, and therefore can store information about it.
2.1.2 Elements of the vascular system
The vascular system consists of the following elements: arteries, capillaries and veins.
The arteries have a relatively large variety in their diameters. The aorta, the largest artery in the body, has an average diameter of 25 mm and wall thickness of 2 mm. The wall of the aorta is elastic and expandable, which is important, because it must bear the blood volume bursts from the left chamber. By the fast expansion and slow contraction, the aorta has a vital part in maintaining the pressure gradient through the diastolic phase in the arterial system. This property of the aorta is called the Windkessel effect.
Large arteries has a diameter between 1 to 10 mm and wall thickness around 1 mm.
They are still elastic, but after a threshold pressure/extension, the collagen fibers start to be recruited, which lowers their maximal extension. The main function of the large arteries is transferring blood to the periphery. As the arteries tighten, the blood pressure is getting lower. Small arteries and arterioles are close to the periphery or the internal organs. This type of arteries have more smooth muscle, which is controlled by the au- tonomous nervous system. By smooth muscle contraction, these parts of the arteries can change their diameter, controlling the amount of blood flowing to the organs. For exam- ple, under stress or shock, more blood reaches the brain, but during digestion, stomach gets more blood.
Arteries end in the micro-vascular system. These small vessels’ wall have only one layer. The metabolic processes happen here. The blood pressure in the microvessels is low, below 1 mmHg, and the blood flow is slow. The microvessels ends in the venules, small diameter veins which collect, merge the microarteries to root back in higher diameter vessels. The venules end in veins. The main function of the veins is to drive the blood back to the heart. To be able to do this, valves in the veins’ walls have a crucial part, which prevent the back flow of the blood against the effects of the gravity. In the veins the blood pressure is between 3 to 6 mmHg. As a summary the connection between the elements of the vascular system is shown in Figure 2.4. (source of this figure: Wikipedia4).
The wall of the arteries typically has 3 layers: endothelial layer, tunica media and tunica externa, also called adventitia [4]. The innermost layer is the endothelial, which consists of a single cell layer. The main function of this layer is to provide a very smooth
4https://commons.wikimedia.org/wiki/File:Illu_capillary.jpg
2.1 Physiology of the cardiovascular system 7
Figure 2.4: Connection between the elements of the vascular system.
surface, which prevents sedimentation and when the arteries is externally closed it pre- vents the sticking of the artery’s wall. Tunica media is the middle layer. It consists of elastic fibers and smooth muscles. In larger arteries elastic fibers dominate, but in smaller arteries the proportion of smooth muscles increase. The adventitia mainly consists of col- lagen fibers, and vasa vasorums (vessels providing blood to the cells of the arterial wall).
The main function of this layer is to provide nutrients and oxygen to the cells of the arterial wall, and prevent the arterial wall from injury by collagen fibers in the case of high blood pressure.
2.1.3 Cardiac cycle
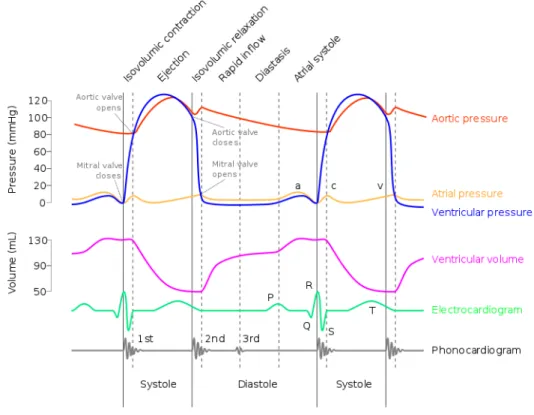
The cardiac cycle is the source of the blood pressure wave formation. It can be divided into two main parts, systolic and diastolic events. Both parts can be divided further to an early and a late stage. At the start of the early systolic phase the ventricles are filled with blood, the semilunar (aortic and the pulmonary) valves are closed and the atria start to contract which pumps the blood from them to the ventricles. In the ECG signal this phase can be recognized by the P wave. Also the cardiac muscles of the chambers start to contract, the pressure in the ventricles increases, but the valves at the pulmonary trunk and the aorta are still closed. It refers to the start of the QRS complex in the ECG.
In the beginning of the late systolic phase, the pressure inside the ventricles reaches the pressure in the arteries, thus the semilunar valves open and the blood flows to the arteries, while the cardiac muscles reach their peak contraction. As the blood pumped out from the heart ventricles, the pressure starts to fall and the semilunar valves close, the repolarization of heart muscles starts (T wave on the ECG).
The next phase is the early diastole, which is rather short. In this phase, the cardiac muscles start to relax, the atrial valves open and the ventricles start to fill with blood. In the late diastolic phase, the heart muscles completely relax and the ventricles continue to
2.1 Physiology of the cardiovascular system 8 fill with blood. The completion of the repolarization can be recognized by the isoelectric phase after the T wave in the ECG.
The physiological events during the cardiac cycle is presented in Figure 2.5 (source of this figure: Wikipedia5).
Figure 2.5: Events during a cardiac cycle with different modalities.
2.1.4 Pressure wave propagation and waveform
The repeated circulation of the systolic and the diastolic phase creates the blood pressure wave which propagates through the cardiovascular system. This pulsatile wave changes a lot throughout the vascular system.
Studying the propagation of the pressure waveform is part of the hemodynamics.
Examining the blood flow usually several assumptions should be made. One of these is that the blood flow is considered laminar flow, which is a flow type having layers flowing on each other and the molecules in each layer can only move between layers by molecular diffusion. The blood flow usually considered as stationary flow, meaning the flow speed vector does not change in time any point inside the vessel. Another assumption is that the blood is considered Newtonian fluid meaning that the connection between shear stress and speed is linear. This latter assumption is almost true in large arteries.
5https://commons.wikimedia.org/wiki/File:Wiggers_Diagram_2.svg
2.1 Physiology of the cardiovascular system 9 A typical BP waveform at the radial artery at the wrist can be seen in Figure 2.6. This typical waveform consists of three waves, two forward propagating wave, the percussion wave and the dicrotic wave, and a backward propagating wave, the reflected wave. The initial point of each heart cycle is the onset point which refers to the diastolic point (lowest BP in a heart cycle). The percussion wave refers to the systolic event, by a fast uprise in BP amplitude. Reflected wave is the reflection of the blood flow from the peripheral arterial site. The arrival of this wave can significantly modify the characteristic of the blood pressure waveform, so it is crucial in pulse diagnostics. The dicrotic wave (dicrotic notch) refers to the closure of the aortic valves. The closure of the heart valves creates a vacuum effect at the initial aorta, which causes a small backflow. This backflow leads to a collision at the heart valves leading to a small pressure uprise. The sum of these three waves characterizes the shape of the blood pressure signal.
Figure 2.6: A typical healthy BP waveform with its characteristic points. P–peak of the percussion wave, Ri–Initial point of the reflected wave, R–peak of the reflected wave, Di–initial point of the dicrotic wave,D–dicrotic notch.
The BP waveform can vary between different health conditions. For example, when the arteries are getting stiffer, the reflected wave can seemingly disappear by merging with the percussion wave, since in stiffer arteries the pressure wave propagation is faster.
Usually elderly people’s pulse signals show this waveform change. Similar distortion arises in hypertensive patients, where the reflected wave arrives earlier and with a much higher amplitude. These examples are shown later in the Pulse diagnostics chapter.
BP waveforms can be divided into three main categories based on the number of visu- ally distinguishable waves: the TRIWave, where all the above mentioned waves are visu- ally distinguishable meaning that five characteristic points can be defined; the DUOWave,
2.2 Blood pressure measurement 10 where these waves merge with one another, creating two visually distinguishable waves and three characteristic points; and those signals where seemingly there is only one wave with only one characteristic point, the peak of the percussion wave.
2.1.5 External and internal factors affecting the cardiovascular system Due to its complex nature and connections throughout the whole body the cardiovascular system is affected by many internal and external factors. This very complex homeostatic system is controlled by both the autonomous nervous system and the endocrine system.
Moreover, the cardiovascular system owns a reasonable role in maintaining the homeosta- sis of the body. Listing all the effects on the cardiovascular system is not an aim of this Thesis, only several examples will be briefly introduced.
Smoking is a well-known factor which greatly affects the cardiovascular system. Smok- ing increases the risk of atherosclerosis. As the consequence of this disease the arterial walls are calcified making it much stiffer compared to healthy arteries.
Another well known factor is the stress. Today, people are getting more and more stressed, being under pressure both in their work and personal life. This means that the body is continuously in an alert state, often meaning higher blood pressure. Having high blood pressure for a longer period of time harms the arterial wall, leading again to hypertension, which is a vicious circle. Also hypertension rises the possibility of stroke and heart attack, by having a greater chance of arterial or microvascular wall tearing.
Several other effects can be considered such as physical activity, nutrition and diet, socioeconomic state, social networks [6]. These all have effects on the states of the arteries, on their stiffness and thus the measurable blood pressure characteristics.
2.2 Blood pressure measurement
Studying the parameters of the cardiovascular system roots back to the ancient civiliza- tions, where the pulse was considered as the sign of the life. For a very long period of history, only the pulse and the pulse rate could be examined by the medical practitioners.
The first blood pressure measurement was conducted in the XVII. century by Stephen Hales, who measured the arterial blood pressure of a horse. In his experiment the arterial blood pressure of a horse was measured through an invasive procedure which caused the death of the horse.
Fortunately, since then, blood pressure measurement methods have been developed a lot. There are invasive methods which are no longer lethal to the patients of course and more and more non-invasive solutions are starting to appear. Measuring the blood pressure is a difficult task. The circulation is a closed loop system, which carries risks connected to the measuring device. In the next subsections, the currently applied blood pressure measuring and monitoring technologies and methods are introduced.
2.2 Blood pressure measurement 11 2.2.1 Invasive blood pressure monitoring
Invasive blood pressure monitoring includes arterial catheterization and arterial cannula- tion. Catheterization is primarily used for diagnostics, examination of the heart, ventri- cles or aorta. This is a very expensive method and the utilized sensor can be used only once for hygienic and safety reasons. It is able to measure the pressure waveform directly, mostly using a piezo-electric force/pressure sensor.
Currently, invasive arterial cannulation is considered as the gold standard for blood pressure measuring, only measuring the central aortic pressure can reach more accurate data [7]. By this method, the arterial blood pressure can be measured directly and con- tinuously as it is connected through a fluid column to a pressure transducer [3]. Usually the cannula is inserted in the radial artery at the wrist, but in several cases, if the ra- dial artery is not accessible, the brachial artery can also be used. It requires a trained professional to insert the arterial cannula and it is also important to have the adequate aseptic environment. It also means a greater hazard to the patient as it has many risks, like bleeding, haematoma formation, peripheral nerve injury, infection at the cannula site and embolism. Embolism can cause further harms leading to heart attack or stroke [3].
2.2.2 Non-invasive blood pressure monitoring methods
Non-invasive BP monitoring has two main categories, the intermittent and the continuous methods. Intermittent methods are widespread, but has not been developed significantly in the recent decades. However, continuous blood pressure measurement is an emerging area.
Intermittent non-invasive blood pressure measurement can be carried out using cuff- based devices. The most frequently used methods are the manual Korotkov method and the automatic oscillometric method. These methods can provide a systolic and a diastolic blood pressure value in a measurement lasting about 40 second. These devices are cheap, widespread, have an adequate accuracy, but low temporal resolution, meaning it is not continuous (intermittent blood pressure measurement).
Continuous non-invasive BP monitoring is an actively developed area. It has great temporal resolution, it can provide the pressure waveform of a single cardiac cycle. The main challenge is the robustness of these continuous BP measuring devices. They are sensitive to motions and other external effects on the measuring sensors.
For non-invasive blood pressure measurement, there is an international criterion set by the Association for the Advancement of Medical Instrumentation (AAMI) [8,9]. This criterion set the maximal bias against a validated blood pressure measurement device at 5 mmHg and standard deviation at 8 mmHg. There are many different protocols for BP measurement validation set by the AAMI. Most of them have very high requirements, which is beyond the possibilities that were realistic during my PhD with the introduced
2.2 Blood pressure measurement 12 device. These rules were set for the validation of commercially available solutions. I was trying to focus on a good scientific and research quality, thus I chose the AAMI SP10 protocol mentioned in [10] which requires minimum 15 subjects and 10 BP reading pairs per subject. The criterion is the same as above, average difference should be below 5±8 mmHg.
2.2.2.1 Intermittent BP monitoring
Intermittent methods can only provide one systolic and one diastolic BP value within approximately 30 to 60 seconds depending on the method and the manufacturer. The main advantages of these methods are being non-invasive, having low risk for the users and being cost-effective. Thus, these intermittent devices are widely used even at homes, because today’s automatized measuring devices do not require any special training or trained personal, they are very simple to operate.
The development of these devices roots back to Scipione Riva Rocci (1863–1937), who was the first to use a cuff to temporarily stop the blood flow. He inflated the cuff above systolic blood pressure, thus closing the brachial artery, while checking the pulse at the wrist. After the pulse stopped, he deflated the cuff slowly. When the pulse reappeared at the radial artery, the systolic blood pressure could be recorded. So this method could only measure the systolic blood pressure, but this was a very important step in blood pressure measuring developments.
The next great development was made by Nikolai Korotkov (1874–1920), whose aus- cultatory method included an arm cuff and a phonendoscope. Like in Riva Rocci’s method the cuff was inflated above the systolic blood pressure. At that point, no sounds can be heard. Slowly deflating the cuff and reaching the systolic pressure value, the so called Korotkov sounds appeared, like a continuously beating sound. The source of these sounds can be related to two phenomenon, the continuously opening and closing arteries or the sound of the turbulent blood flow. Both can be traced back to the partially blocked ar- teries. The latter is the older theory, which states that when the cuff flattens the artery, thus partially closes it, the blood flow becomes turbulent. The turbulent flow causes col- lisions between the arterial wall and the blood cells which generates the Korotkov sounds.
The other, newer theory states that while the cuff pressure is between the systolic and the diastolic BP, there are periods during a heart cycle when the arteries are closed and periods when the arteries are open. This fluctuation between opened and closed state generates a clapping noise which could be matched to the Korotkov sounds. Further deflating the cuff, the sounds disappeared when the cuff pressure reached the diastolic pressure and the above causes of the sound disappears.
This Korotkov method is still widely and frequently used by practitioners. There were not any new significant development in this intermittent blood pressure measuring method until today. However, automatized versions of this cuff-based method are widely
2.2 Blood pressure measurement 13 available. The most frequently used is the oscillometric method. The oscillometric de- vices measure the oscillations in the blocked artery. The oscillations, like the Korotkov sounds, appear between the systolic and the diastolic blood pressure. These devices can measure the highest oscillation which appears at around the mean arterial pressure and calculate back the systolic and diastolic values. The calculation method differs between the manufacturers and are usually kept as a company secret.
There are other similar cuff-based solutions using different sensors such as ultrasound.
By monitoring the rate of the arterial blockage, ultrasound is able to detect the systolic and diastolic values. Also using microphones, the auscultatory method can be automa- tized.
2.2.2.2 Continuous BP monitoring
BP monitoring is considered continuous when the frequency of the provided BP values are at least beat-to-beat, meaning that for every cardiac cycle, a systolic and a diastolic BP value can be determined. However, more detailed signal (acquired with higher sampling frequency) carries more diagnostic information. In the following subsections, several continuous blood pressure monitoring methods are introduced.
Sphygmograph Sphygmograph is the first continuous non-invasive blood pressure waveform measuring device, developed by E. J. Marey in 1860 [11]. It consists of levers, which are connected to the measuring sensor and the recording pen. The pen is able to draw the continuous pressure waveform on a moving paper by following the movement of the attached sensor. Marey’s measuring device is shown in Figure 2.7. (source of this figure: Wikipedia6). Although this device foregoes the cuff based blood pressure mea- surement method, it could not spread widely, since it was not able to give information about the exact blood pressure values, showed only the contour of the blood pressure waveform, which was not useful enough at that time. However, later this device inspired the development of applanation tonometry.
Figure 2.7: E. J. Marey’s sphygmograph.
6https://en.wikipedia.org/wiki/File:Marey_Sphygmograph.jpg
2.2 Blood pressure measurement 14 Applanation tonometry Applanation tonometry is based on the movement of the arterial wall that can be measured by partially closing the artery by pressing it to a solid surface like a bone [12]. The most commonly chosen artery for it is the radial artery at the wrist. Tonometric devices for BP monitoring usually have a pressure stamp, which can sense the small motions of the arterial wall. The location of the sensor is crucial, it has to be placed exactly over the artery in order to get good quality signal. The concept of tonometric sensor positioning is shown in Figure 2.8. Another challenge is the calibration, which can last several minutes. Movement of the patient can also be a problem, because after some movement the system must be recalibrated. Hence, these devices mostly used on anesthetized patients. Tonometric devices can be divided into two categories, the supervised and the unsupervised method.
Figure 2.8: The basic concept of tonometry. The measuring position is at the wrist over the radial artery. The tonometric sensor must be pressed to the artery and then the artery have to be pressed to the bone to become semmi-occluded.
The supervised method means that a medical professional holds the sensor at the desired position during the whole time of the examination. These tonometric devices usually have a pen-like structure. In the tip of this pen the measuring transducer, usually a pressure sensing stamp can be found. Examples for such supervised tonometric devices are the Millar tonometer [13], PulsePen device [14] and the SphygmoCor system (also using Millar transducer) [15]. In general the measuring protocol is the following. The patients asked to take a resting position, which could mean a sitting or a lying position. A soft, comfortable support is put under the examined wrist. Then, the medical professional tries to find the best measuring position over the radial artery. If the position is considered adequate, the recording of the signal is started. During the measurement, which is usually one-minute long, the professional tries to hold the sensor at the same position with the same applanation force. The recording is stopped after the decided measurement
2.2 Blood pressure measurement 15 length. This protocol can be supplemented by a cuff-based blood pressure measurement for calibration to the current blood pressure of the patient.
This supervised method is great for short term waveform analysis, but cannot be used for a long term monitoring. The supervised nature is advantageous, because the frequency of patient’s movement artefacts can be minimized. However, another noise source is integrated in this method – the movement or inaccurate sensor holding of the medical professional.
The other type of applanation tonometric devices is the unsupervised version. These devices require a trained personal only for the sensor installation. During the signal recording or monitoring, the device is attached to the wrist. The usual measuring pro- tocol is the following. First, by touching the wrist the trained personal determines and marks the position of the radial artery of the patient. Then, the measuring device is attached over the marked area and the device starts to adjust its position to the best measuring position by continuously searching for the best quality signal possible. When the adjustment is finished, a calibration takes place. There are two main ways for that, using a cuff-based blood pressure monitor, or using a recorded database which estimates the blood pressure through antropometric characteristics of the patient [16]. After cali- bration the continuous monitoring can be started.
The main challenge in the unsupervised tonometric method is the displacement of the sensor. This can happen easily during patient movements, but can arise in other situations as well, for example if the professional accidentally pushes the sensor’s holder.
If the sensor’s position changes, the position adjustment and the recalibration must be started over again. It means that the monitoring can be interrupted for minutes. Thus, these tonometric devices usually applied on anaesthetized patients where the patient’s movements are unlikely.
The most frequently studied tonometric device is the Tensys TL series [17,18,19,20, 21,22,23]. It has a great accuracy as compared to the invasive arterial cannulation, which is promising for a continuous non-invasive blood pressure measuring technique. Moreover, even in the special case of morbidly obese patients it has an acceptable accuracy [24].
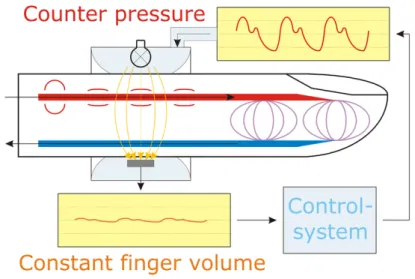
Peñaz principle-based BP monitoring Peñaz principle-based devices have good ac- curacy in beat-to-beat blood pressure measurements [25,26,27,28,29,30]. These devices have one or two finger cuffs each including a photoplethysmograph (PPG) sensor that can measure the blood oxygenation level. This method is also called vascular unloading technique. The main idea behind vascular unloading is to measure the blood oxygena- tion level continuously on the index and/or the middle finger and by a finger cuff set the measurable signal to a constant line. In details, the blood oxygenation level reflects the events of the cardiac cycle. The measured signal is similar to the arterial pressure waveform, but it is less detailed. It also has to be mentioned that the signal waveform is
2.2 Blood pressure measurement 16 also altered by the measuring position, meaning that the finger artery is much smaller in diameter than for example the radial artery. There is a back control loop, which changes the pressure of the finger cuffs to press the finger arteries as much as to keep the PPG signal as a constant line. Therefore, the control loop provides the blood pressure values.
The idea behind this measuring method is summarized in Figure 2.9 (source of this figure:
Wikipedia7).
Figure 2.9: Summary of the Peñaz principle-based non-invasive continuous BP monitoring method.
As mentioned above, the finger arteries are much smaller in diameter than the radial or brachial artery, so the measured blood pressure values must be corrected. This correction can be done by precalibration with a brachial oscillometric blood pressure monitor or by a transfer function. When the brachial BP is used, the measuring protocol is similar to the one introduced at the tonometric BP measurement. After the finger cuff is put on, the medical professional measures the brachial BP by the oscillometric device, and calibrate the output of the Peñaz principle based device to that pressure. The other solution is using a transfer function to calculate the radial arterial BP from the BP of the smaller finger arteries. This transfer function based calibration is easier in practice, because it does not require any additional device, but the transfer function is not clearly defined, the parametrization or even the function itself can alter between patients.
Based on the number of utilized fingers this method can be divided into two categories.
The one finger version, i.e. BMEYE’s Nexfin/Edwards Lifesciences’ ClearSight device [27, 31,32,33, 34, 35,36,37], continuously measures and therefore oppresses the given finger. The two finger version, i.e. CNSystems’ CNAP monitor [38,39,40,41,42,43,44], can alter between fingers. By altering between the two fingers at every heart beat, it can
7https://commons.wikimedia.org/wiki/File:Vascaular_unloading.png
2.2 Blood pressure measurement 17 provide smooth blood flow for a short period of time in both fingers. Due to constant oppression of the finger arteries, these devices have a temporal limit for safe use. The recommended time for the one-finger version is 12 hours and for the two finger version is 24 hours.
Most of the limitations of the Peñaz principle based system are given by the utilized PPG sensor’s limitations. The factors effecting the accuracy of a PPG include body and air temperature, skin color, condition of the finger arteries, outer light conditions, sweat and age. Some of these effects can change in a longer monitoring period, so the quality of the measured signal can differ during measurement. Also the blood oxygenation level itself should be taken into account. A standard plethysmograph measures the alterations of oxygenation level accurately, while it is above 70%. If it is below that level, the measured signal cannot be considered accurate. In most cases it is not a big problem, but in some patient group such as during a surgery or in the case of heavy smokers, it can cause issues.
Pulse Transit Time Pulse Transit Time (PTT) is getting popular recently, mainly due to the smart devices used for health applications. This method has a wide variety in the sense of measuring techniques. Basically the typical PTT system consists of an ECG and a measuring device that can give information about the heart cycle at the periphery.
For the latter purpose, the most frequently used device is the finger plethysmograph. The idea behind the PTT is to measure the time difference of a given heart beat from initiation to the appearance at the periphery. To do that an ECG and a peripheral pulse waveform measurement must be recorded simultaneously. The PTT can be calculated from the time of the R peak of the ECG to the time of the initial point of the corresponding pulse waveform at the periphery. From PTT and the distance between the heart and the peripheral sensor, the pulse wave velocity (PWV) can be calculated.
Another possible PTT measuring method is to use transducers in two different posi- tions at the periphery. A frequently used solution for that is when two pressure sensors are attached to the forearm, one at the end of the brachial artery at the elbow pit and the other over the radial artery at the wrist. In this case, the distance between the two sensors can be easily measured and because of the same measured modality, the initial phase of the signal is also a bit easier to annotate. But in this case the temporal reso- lution of the sensors must be very good, the sampling frequency should be at least 1000 Hz.
PWV is proportional to the arterial blood pressure [45], thus a good approximation of the BP can be calculated [46]. This provides a cuffless beat-to-beat blood pressure mea- suring method, which is very advantageous. Portability is also an advantage. Nowadays, the PTT based BP monitoring method is utilized in almost all the smart devices. Mainly in smart watches [47] and smart phones. These smart devices measure ECG signal and a
2.3 Automatized pulse diagnostics 18 peripheral pressure waveform using a simplified plethysmograph. This simplified plethys- mograph can be the camera of a smart phone extended with its flash, but of course it is much less accurate than a professional device with red and infrared light.
The limitation of the PTT method is the lack of personalization. The existing func- tions that converts the PWV to BP are only for estimation and there are not any general parametrization. It is the bottleneck of this method and requires a lot of studies to create a personalizable function that can be used for individualized measurements.
Arteriograph TensioMed’s Arteriograph is a Hungarian development. This works as a combination of several above mentioned methods. It uses an oscillometric cuff on the upper arm and a PPG sensor on one finger of the same arm. It combines the two measurements taking reflected waves into account [48]. Due to the detection of the reflected wave, the device can calculate the PWV. The measured blood pressure value by the cuff is used for calibration [49].
2.3 Automatized pulse diagnostics
Pulse diagnostics roots back to the traditional Chinese medicine [50,51] called as tradi- tional pulse diagnosis. Pulse diagnosis is a non-invasive, painless method without side- effects that can give information of several internal organ’s and the cardiovascular sys- tem’s health and diseases [52]. The main idea behind it is that the cardiovascular system is connected to the whole body, interacts with every organs, and the effects of these in- teractions appear in the pulse waveform. The pulse waveform is the continuous blood pressure waveform without the actual blood pressure values. This method has not yet been accepted by the western medical practice. But as several other traditional Chinese medicine methods, like acupuncture, it has the potential to become partially accepted.
Below, I introduce the automatized pulse diagnostic method, which considers several ideas from the traditional pulse diagnosis, but relies on quantitative measurements.
Automatized pulse diagnostics is based on several different methods, but the main idea is the same behind all of them, which includes measuring a continuous pulse waveform at the wrist, filtering the signal and analysing the data. The measuring technique has a relatively wide range of variability. Several of them can also be used for continuous blood pressure monitoring, like tonometric devices, but there are several other solutions that can measure the waveform itself without taking the exact BP values.
The advantages of the automatized method are the following, it is objective, the diag- nostic accuracy can be evaluated, the examination time can be shorter, taking only several minutes. The more reliable diagnosis can also help in popularizing the method, which would be a great step in prevention of several cardiovascular diseases like hypertension.
2.3 Automatized pulse diagnostics 19 It is interesting that for pulse waveform measurement not the usual continuous blood pressure monitoring solutions are used, but other devices that are able to record a contin- uous pulse wave contour or a little modified version of the continuous BP measurement devices. This fact is based on the different requirements for pulse diagnostics. To this diagnostic method, blood pressure itself is not as crucial, it is only a parameter which is beneficial to know, but the signal shape is more critical. The length of the diagnos- tic measurements is much shorter than it is required for patient monitoring. Thus, any sensor is good for the task which is able to detect arterial wall movement, or blood flow with adequate accuracy. Below, several examples are introduced briefly.
An example for sensors used for pulse diagnostics is ultrasound [53,54]. Ultrasound can measure blood wave velocity, thus the blood flow at a short section of the artery.
Blood flow corresponds to the pulse wave, therefore it can be used for waveform analysis.
By ultrasound a spectrogram can be measured, so a preprocessing step is required to get the analysable pulse waveform. The preprocessing step consists of an envelope graph fitting according to the intensity borders.
Another widely used sensors are the piezo-electric pressure transducers [55], pressure sensor arrays [56] and devices based on strain gauges [57, 58]. These are similar to the pressure stamp based tonometric devices, but are usually less accurate, less robust. It is not rare that these measurements have high frequency and low amplitude noises. Also the movement artefacts are a serious challenge, so an adequate signal processing method is required for these signals. Although it has many challenges, this type of transducers are frequently used, because they provide a usable signal quality with a relatively cheap and widely available sensor. Furthermore, sensors can be arranged into a sensor array due to their small size. The sensor array is advantageous, because it can detect the best measuring position. In practice it means that from the sensor array an algorithm chooses the signal with the highest amplitude and this chosen signal is to be processed.
Continuous pulse waveform recording can be done by laser-based distance sensors too.
In a pilot study, red laser light was used to detect the movement of the arterial wall at the wrist [59]. This is a contactless measurement method, which makes it very comfortable for the patient. It applies a triangulation method to record the arterial wall movement.
The resolution of arterial wall movement detection by this system is better than 4 µm.
The device has considerable size, however, for diagnostic purposes it is not an issue.
The signal processing of pulse waveforms generally consists of the following steps:
1. preprocessing, if the measuring method requires it, 2. noise filtering,
3. signal averaging to get the continuous waveform of a single cardiac cycle, 4. feature extraction and classification.
2.3 Automatized pulse diagnostics 20 Preprocessing step includes a data representation process, in which the measured modality is transformed into a continuous wave signal. This step is required for example if the signal was recorded by an ultrasound device, but it is not required if the continuous waveform was measured directly for example piezo-transducer based methods.
Noise filtering is crucial, because detailed, clean signal is important for diagnostic decisions. Filtering high frequency noise is a relatively easy task for pulse diagnostic purposes, because wrist pulse signal is a low frequency signal. Thus, filtering the low frequency noises is much more challenging. The main challenge in it that the noise itself can happen with nearly the same frequency as the pulse signal. These low frequency noises can be because of normal breath movements, slow tremor, small finger or hand movements. Noises of a longer or a stronger hand or arm or body movements make even lower frequency noises.
Filtering low frequency noises is even harder when the blood pressure value is also considered as an important information, and not just the signal waveform. It is because diastolic BP and some low frequency noises, mainly breathing movements, are strongly connected. By breathing the signal fluctuates because of two reasons. Once, during breathing the whole body has a small movement. Secondly, during inhale phase the heart is a bit pressed by the lungs and the moving chest, thus causing a slight blood pressure drop. Therefore, the noise generated by breathing cannot be filtered out from blood pressure waveform without losing diastolic information.
When the BP values are not considered important, the baseline wander can be filtered.
To do this filtering, zero-phase filters [60], wavelet decomposition filters [61,62,63] and classic frequency filters can be applied. An important aspect for the filtering that the pulse waveform should not be distorted, therefore, the parameters of the filters should be carefully set. Zero phase filtering is advantageous, because it has no phase distortion, but it requires more computation time. The frequency filters are easy to be applied, but can distort the signal in some cases such as anomalies in the signal caused by phase shift or the frequency to be filtered is too close to the frequency of the pulse wave signal.
Wavelet decomposition filters for biological signals become more and more popular.
Since the early 2000s, the number of studies using wavelet decomposition filtering in- creases. Wavelet decomposition filtering is beneficial because it provides information not only from the frequency spectrum of the signal, but it also keeps the information about the time domain. In practice, wavelet decomposition filters use a so called mother wavelet function, which must create an orthonormal basis. Using this mother wavelet function and convolution, the signal can be decomposed for a signal approximation and details on a specific level. To gain more information about the signal, continuous wavelet transfor- mation can be used. Applying this method, the time-frequency spectrum can be created for the signal. This is a great help both in finding the best filter parameters and both in checking, whether the applied filter is good enough.