Entropy and Gaussianity - Measures of Deterministic Dynamics of Heart Rate and Blood Pressure Signals of Rats
Tatjana Loncar-Turukalo
1, Sonja Milosavljevic
2, Olivera Sarenac
2, Nina Japundzic-Zigon
2, Dragana Bajic
11 Department of Communications and Signal Processing Faculty of Technical Sciences
University of Novi Sad Trg Dositeja Obradovia 6 21000 Novi Sad, Serbia
2 Department of Pharmacology, Clinical Pharmacology and Toxicology Faculty of Medicine
University of Belgrade dr Jovana Subotia 1 11000 Belgrade, Serbia
Abstract: Heart rate and blood pressure short-term variability analysis represent promising quantitative measures of the cardiovascular autonomic controls. The analysis include traditional statistical analytical tools and a number of methods based on nonlinear system theory, recently developed to give better insight into complex HR and BP time series. These methods might reveal abnormalities that may not be uncovered by traditional measures. This paper investigates the measure of entropy of HR and BP time series as a consequence of the involvement of the autonomic nervous system, assessed in conscious telemetred rats under blockade of β-adrenergic, α-adrenergic and M-cholinergic receptors.
1 Introduction
Physiological processes are complex phenomena, outcomes of multiple inputs including autonomic nervous system and humoral controls. Measure of entropy quantifies the unpredictability of fluctuations in a time series, reflecting the likelihood that ‘similar’ patterns of observations will not be followed by additional
‘similar’ observations. Therefore, a time series containing many repetitive patterns has relatively small entropy; a less predictable process (with more disorder) has higher entropy.
Entropy evaluation of a time series is an easy task if a process is well described; it may be still reliable if there is an inherent knowledge of time series statistics (Shannon’s experiments, e.g. [13]); yet, it can lead to incorrect conclusions and unfounded extrapolations if a time series is controlled by multiple not completely known factors.
The aim of this paper is to try to quantify the contribution of the autonomic nervous system: the adrenergic and the holinergic part to the heart rate and the blood pressure disorder. Pulse pressure signals were recorded in freely moving radiotelemetred rats. Entropies were estimated on systolic arterial pressure (SAP) and heart rate (HR) time series.
2 Materials and Methods
2.1 Animals
Experiments were done in conscious male Wistar outbred rats (320-350 g) during daytime (10-14 h), housed separately in plexiglas cages under standard laboratory conditions with water and food ad libitum.
2.2 Surgery
Rats were submitted to surgical procedure under combined 2% xylazine and 10%
ketamine anesthesia during which implants TA11 PA-C40 (Transoma Medical, DSI Inc., USA) were inserted in aorta. After full recovery period (10 days), rats were operated again under halothane anesthesia (4% concentration in the chamber for induction of anesthesia and 1.7% for maintenance under the mask) for quick insertion of catheter in jugular vein for drug injections. Two days later rats were submitted to four different protocols.
2.3 Protocols
Protocol 1 was designed to investigate the role of the sympathetic nervous system directed to the blood vessels in the genesis of the disorder in the cardiovascular signals, by selective blockade of α1 adrenergic receptors by prazosine (1 mg/kg i.v. bolus continued by 0.5 mg/kg/h infusion) in n=6 conscious rats. Protocol 2 was designed to investigate the role of the sympathetic nervous system directed to the heart in the genesis of the disorder in the cardiovascular signals, by selective blockade of β1 adrenergic receptors by metoprolol (2 mg/kg i.v. bolus continued by 1 mg/kg/h infusion) in n=6 conscious rats. In protocol 3 we investigated the
contribution of the parasympathetic part of the autonomic nervous system to the creation of the disorder of cardiovascular signals by blocking the muscarinic receptors by atropine methyl bromide (1 mg/kg i.v. bolus, followed by 0.5 mg/kg/h i.v. infusion). Protocol 4 was designed as a control group in which saline (0.9% NaCl) was injected to n=9 rats (1 ml/kg i.v. followed 0.5 ml/kg/h i.v.
infusion). In addition, an artificial control signal was simulated by generator of random numbers with normalized and centralized Gaussian distribution.
2.4 Drugs
Prazosin chloride, atropin methyl bromide and metoprolol chloride were purchased from Sigma-Aldrich (Uni-Chem, Belgrade). Ketamine and xylazine were purchase from Richter Pharma (Germany) and Ceva Sante Animal (Hungary), respectively. Halothane was donated by Jugoremedia (Belgrade). All drugs were dissolved in saline (0.9% NaCl).
2.5 Signal Processing
Recording of blood pressure pulse wave was done using DSI radiotelemetry system. Pulse pressure was sampled at 1000 Hz. Systolic blood pressure was obtained by identification of the maxima in the pulse wave signal. Heart rate [in bpm] was calculated from the heart period measured in seconds between two maxima (60/heart period [in s]). The slow components of created time series of SAP and HR were removed using the filter for detrending the biomedical data (λ=10) [10].
y D D I I
yDTR =( −( +λ2⋅ T⋅ )−1)⋅ ,
⎥⎥
⎥⎥
⎦
⎤
⎢⎢
⎢⎢
⎣
⎡
−
−
−
=
1 2 1 0 0
0 1
2 1 0
0 0
1 2 1
L
O O O O M
M O L
D (1)
Both original and detrended signals were used to estimate the uncertainty and disorder of time series. This evaluation is based upon the series of probability estimations. It starts from a time series y = [y(j)], j=1,…,N. A sequence of length m is defined as a short vector xm(i) = [y(i+k-1)], k = 1,…,m, i=1,…,N-m+1 that is a part of a long time series. For each pair of sequences a distance d(xn(i), xm(j)), i,j=1,…,N-m+1 is defined. It can be maximal absolute distance, mean square distance or any other distance suitable for the current investigation. The number of m-tuples for which the distance is bounded by some value r is Bi, i = 2,…,N-m+1.
The function ) 1
( = − +
m N r B
Cim i (2)
estimates the probability that any vector xm(j) is within the distance r from the sequence xm(i). Another function
[ ]
∑
− +=
+ ⋅
= − 1
1
) ( 1 ln
) 1
( N m
i m i
m C r
m r N
Φ (3)
is average of the natural logarithms of the previous function. It is proven [12, 1]
that the entropy of the underlying process can be approximated for the finite data sets:
[
Φ (r) Φ (r)]
ApEn(m,r,N) Φ (r) Φ (r)lim lim
lim m m m m
N m r
1 1
0
+ +
→∞
→∞
→ − ≈ = − (4)
Dependency on the record length and lack of relative consistency of this approach were shown in [7] where a heuristic improvement SampEn was introduced. If Bm(r) (Am(r)) is an estimate of the probability that two sequences will match for m (m+1) points (with Ai being a m+1 counterpart of Bi):
∑
−∑
=
−
= − −
⋅ −
= −
−
−
⋅ −
= − N m
i
m N
i m i
m i
m N
A m r N m A
N B m r N B
1 1 1
1 ) 1
( 1, 1 ) 1
( (5)
SampEn is then estimated as [7]:
⎟⎟⎠
⎜⎜ ⎞
⎝
− ⎛
= ( )
) ln ( )
, , ( SampEn
r B
r N A
r
m m
m (6)
For each pair of HR-BP series a cross-entropy was evaluated. Cross-entropy is an asymmetric measure, evaluated in the same way as ApEn, except that the compared data sets are of different origin (HR and SAP in this case) [6].
The estimates require normalized and (in a case of cross-entropy) centralized time series for which the first and the second moments are required, the features that could be estimated from stationary data only [2]! For this reason, a stationarity test frequently employed for biological time series [3,11] has been performed. The data collected from 6 rats (the first three protocols) or 9 rats (the fourth protocol) were segmented into series of 1024 samples each; the ones (either original or detrended) that had not passed the tests considering both the mean value and standard deviation of samples were rejected. Therefore, the study sample included 84 time series for protocol 1; 28 time series for protocol 2; 21 time series for protocol 3 and 12 time series for protocol 4.
While ApEn (and SampEn) are estimates devised for time-series, other entropy measures can also be performed. One of them is devised within the joint symbol dynamics analysis, where two windows of size m slide simultaneously along differentially coded SAP and HR (or, alternatively, from BBI – bit to bit interval) data [8]. Binary content of a window defines a symbol, therefore number of different symbols is 2m; a relative freqquence of pairs of symbols (observed in two simultaneous windows) is evaluated from the SAP and BBI as:
j m
i i j
m N
j
p i , , 1, ,2
) 1 (
symbol BBI and symbol SAP of occurences of
number
, 2 = L
+
= − (7)
JSD Shannon is then estimated as:
].
Sh 1 [ JSDSh
, 2
1 2
1
, ⎟⎟
⎠
⎞
⎜⎜
⎝
⋅ ⎛
=
∑∑
= = ij
i j
j
i ld p
p
m m
(8)
2.6 Statistics
Results in the figures are plotted as mean, while the variance is presented, for particular values, in Table 1. Differences between experimental groups were assessed using Student’s T test for unpaired observations in GraphPad Prism 4 software. Statistical significance was considered at p < 0.05.
Table 1
Mean ± SE (standard error) of entropy estimates for different protocols; gray results differs significantly from control group (Protocol 4)
3 Results
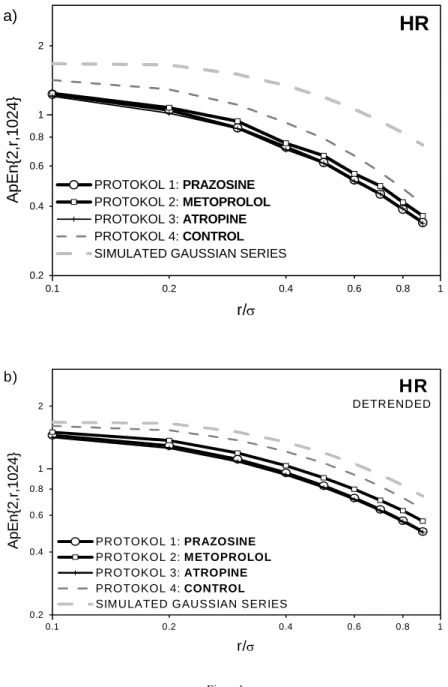
The entropy estimate is done observing the usual measure (m=2) corresponding to pairs of samples vs. triplets of samples, but instead of fixed value for comparison r/σ, a range of values is plotted. ApEn and its detrended counterpart for heart rate and systolic blood pressure are shown in Figs. 1 and 2, while SampEn is shown in
Protocol 1 Protocol 2 Protocol 3 Protocol 4 Gauss HR-ApEn 1.049±0.18 1.075±0.09 1.018±0.10 1.292±0.35 1.651±0.12 SAP-ApEn 1.347±0.30 1.536±0.45 1.474±0.30 1.093±0.38 1.651±0.12 HRD-ApEn
detrended 1.291±0.25 1.366±0.21 1.260±0.70 1.530±0.18 1.651±0.12 SAPD-ApEn
detrended 1.514±0.34 1.481±0.45 1.506±0.69 1.523±0.38 1.651±0.12 HR-SampEn 1.028±0.28 1.229±0.10 0.976±0.07 1.078±0.35 1.782±0.16 SAP-SampEn 1.432±0.24 1.789±0.45 1.765±0.67 1.298±0.38 1.782±0.16 HRD-SampEn
detrended 1.304±0.28 1.533±0.09 1.173±0.10 1.413±0.35 1.782±0.16 SAPD-SampEn
detrended 1.567±0.30 1.495±0.45 1.568±0.70 1.592±0.38 1.782±0.16 JSDSh 2.66±0.24 2.65±0.22 2.68±0.33 2.69±0.34 2.73±0.29
0.1 0.2 0.4 0.6 0.8 1 0.2
0.4 0.6 0.8 1 2
a)
HR
PROTOKOL 1: PRAZOSINE PROTOKOL 2: METOPROLOL PROTOKOL 3: ATROPINE PROTOKOL 4: CONTROL SIMULATED GAUSSIAN SERIES
ApEn{2,r,1024}
r/σ
0.1 0.2 0.4 0.6 0.8 1
0.2 0.4 0.6 0.8 1 2
b)
DETRENDED
HR
PROTOKOL 1: PRAZOSINE PROTOKOL 2: METOPROLOL PROTOKOL 3: ATROPINE PROTOKOL 4: CONTROL SIMULATED GAUSSIAN SERIES
ApEn{2,r,1024}
r/σ
Figs 3 and 4. A sample of cross-entropy is shown in Fig. 5. JSDSh is observed considering the windows of size m=3 (Table 1).
Figure1
ApEn of HR – original (a) and detrended (b) signals
0.1 0.2 0.4 0.6 0.8 1 0.2
0.4 0.6 0.8 1 2
a)
PROTOKOL 1: PRAZOSINE PROTOKOL 2: METOPROLOL PROTOKOL 3: ATROPINE PROTOKOL 4: CONTROL SIMULATED GAUSSIAN SERIES
SAP
ApEn{2,r,1024}
r/σ
0.1 0.2 0.4 0.6 0.8 1
0.2 0.4 0.6 0.8 1 2
b)
SAP
PROTOKOL 1: PRAZOSINE PROTOKOL 2: METOPROLOL PROTOKOL 3: ATROPINE PROTOKOL 4: CONTROL SIMULATED GAUSSIAN SERIES
DETRENDED
ApEn{2,r,1024}
r/σ
Figure2
ApEn of SAP – original (a) and detrended (b) signals
0.1 0.2 0.4 0.6 0.8 1 0.2
0.4 0.6 0.8 1 2
a)
HR
PROTOKOL 1: PRAZOSINE PROTOKOL 2: METOPROLOL PROTOKOL 3: ATROPINE PROTOKOL 4: CONTROL SIMULATED GAUSSIAN SERIES
SampEn{2,r,1024}
r/σ
0.1 0.2 0.4 0.6 0.8 1
0.2 0.4 0.6 0.8 1 2
b)
DETRENDED
HR
PROTOKOL 1: PRAZOSINE PROTOKOL 2: METOPROLOL PROTOKOL 3: ATROPINE PROTOKOL 4: CONTROL SIMULATED GAUSSIAN SERIES
SampEn{2,r,1024}
r/σ
Figure 3
SampEn of HR – original (a) and detrended (b) signals
0.1 0.2 0.4 0.6 0.8 1 0.2
0.4 0.6 0.8 1 2
a)
PROTOKOL 1: PRAZOSINE PROTOKOL 2: METOPROLOL PROTOKOL 3: ATROPINE PROTOKOL 4: CONTROL SIMULATED GAUSSIAN SERIES
SAP
SampEn{2,r,1024}
r/σ
0.1 0.2 0.4 0.6 0.8 1
0.2 0.4 0.6 0.8 1 2
b)
SAP
PROTOKOL 1: PRAZOSINE PROTOKOL 2: METOPROLOL PROTOKOL 3: ATROPINE PROTOKOL 4: CONTROL SIMULATED GAUSSIAN SERIES
DETRENDED
SampEn{2,r,1024}
r/σ
Figure 4
SampEn of SAP – original (a) and detrended (b) signals
0.1 0.2 0.4 0.6 0.8 1 0.6
0.8 1 2 4
a) 6
HR vs. SAP
PROTOKOL 1: PRAZOSINE PROTOKOL 2: METOPROLOL PROTOKOL 3: ATROPINE PROTOKOL 4: CONTROL SIMULATED GAUSSIAN SERIES
CrossApEnXY{2,r,1024}
r/σ
0.1 0.2 0.4 0.6 0.8 1
0.6 0.8 1 2 4
b) 6
SAP vs. HR
PROTOKOL 1: PRAZOSINE PROTOKOL 2: METOPROLOL PROTOKOL 3: ATROPINE PROTOKOL 4: CONTROL SIMULATED GAUSSIAN SERIES
CrossApEnYX{2,r,1024}
r/σ
Figure 5
Cross-ApEn HR vs. SAP (a) and SAP vs. HR (b)
4 Discussion
HR and SAP time series show chaotic properties due to functioning multiple regulation mechanisms => high entropy characterizes a healthy cardiovascular system. The autonomic nervous system (functionally divided into adrenergic and cholinergic part) is the fastest acting regulation mechanism that coordinates the changes of blood pressure and heart rate.
As it could be noticed in Fig. 1, ApEn shows the greatest disorder for simulated Gauss signals and the smallest for treated animals. Detrended signal show increase of entropy (some of the predictive components has diminished), but the relative positions of curves for different protocols remain the same as for the original data.
Table I shows value samples of sample mean and variance for a characteristic value of r = 0.2.
The results are different for blood pressure (Fig. 2) – the smallest entropy is found in control rats, suggesting the possible involvement of autonomic cardiovascular reflexes i.e. the baroreflex. For detrended SAP signals entropy values overlap, quite as expected – the significant amount of SAP signal energy is concentrated within the lower part of spectrum, removed by detrending.
Both the HR and SAP estimates using approach of original data does recognize autonomic contribution to SAP and HR, but does not discern adrenergic from holinergic contribution. Detrended (i.e. filtered) data lose this property for SAP time series. Besides, the detrended data do not show the significant difference regarding the control group, according to t-test. The suggestion is that data should not be detrended, but analyzed in its original form. Also, instead of absolute distance, a normal distance should be measured, to make more refined distinction between the components (drugs) involved.
SampEn approach, on the other hand, has a serious drawback in being a heuristic and not mathematically derived estimate. It is not the same measure, as could be seen from the corresponding equations: roughly speaking, ApEn is a sum of logarithms, while SampEn is a logarithm of sums. Therefore, SampEn is a measure, a probabilistic measure, but it is a measure only similar to entropy approximation and not an equal one. However, the results obtained by this method did not pass the significance test.
The results of JSDSh (Table I) show extremely high entropy values, compared to previous estimates. It could have been expected, since Eq. (8) is valid for statistically independent symbols only [5], while the contents of sliding window certanly form a Markov source: after the symbol (m-tuple, window content) 011, the only possible followers are 101 and 001. Therefore, conditional probabilities Pr{pk,l/pi,j} – relative frequencies of events that pair k,l would follow pair i,j, for i,j,k,l, = 1,…,2m – must be estimated from differentially coded SAP and BBI time
series. Then a correct formula for statistically dependent symbols could be applied [5]:
].
Sh } [ / Pr{
} 1 / Pr{
memory JSDSh with
2 1
2 1
2 1
2
1 , , , , ,
∑∑∑∑
= = = = ⎟⎟⎠
⎞
⎜⎜
⎝
⋅ ⎛
⋅
=
m m m m
i j k l pij pkl pij ld pkl pij (9) Unfortunatelly, there are 24⋅m different transition probabilities Pr{pk,l/pi,j}, (4096 for the case m=3), making the estimates quite unrelliably [9], except for very long time series.
Conclusion
ApEn has mathematical foundation and if it is not detrended it does recognize autonomic contribution to BP and HR, but does not discern adrenergic from holinergic contribution. SampEn is a heuristic improvement of ApEn, but it does not recognize autonomic contribution to BP and HR. JSDSh ought to be modified to include the memory of sliding window estimate, therefore it could be implemented with long data series.
Further research should be focused on entropy estimates of the increases and decreases of the signal difference separately. Other analytical methods, both for series of samples and series in time [4] would be included to find out which one show the greatest distinction between the components included; knowing the mechanism of the each one of the methods, more of the complexity of the signal would be revealed.
Acknowledgement
This paper was supported in part by Fundamental research grant no. 145062, Ministry of Science, Serbia.
References
[1] A. L. Goldberger, S. M. Pincus: Physiological Time-Series Analysis: What does Regularity Quantify? Am J Physiol, Vol. 266 (Heart Circ. Physiol.), pp. H1643-H1656, 1994
[2] A. Papoulis: Probability, Random Variables and Stochastic Processes, McGraw-Holl International Edition, 1984
[3] Bendat and Piersol: Random Data Analysis and Measurement Procedures, New York – Wiley Interscience, 1986
[4] D. Hoyer, B. Pompe, H. Friedrich, U. Zwiener, R. Baranowski, U. Müller- Werdan, H. Schmidt: Autonomic Information Flow during Awakeness, Sleep, and Multiple Organ Dysfunction Syndrome assessed by Mutual Information Function of Heart Rate Fluctuations, In Proceedings of IEEE EMBS, San Francisco, CA, USA September, 2004
[5] D. L. Isaacson, R. W. Madsen: Markov Chains Theory and Applications, Wiley, NY, 1976
[6] J. S. Richman, J. R. Moorman: Physiological Time-Series Analysis Using Approximate Entropy and Sample Entropy Am. J. Physiol. Heart Circ.
Physiol. Vol. 278(6), pp. H2039-H2049, 2000
[7] L. A. Lipsitz: Dynamics of Stability, J. of Gerontology, Vol. 57A, No. 3, pp. B115-B125, 2002
[8] M. Baumert, V. Baier, S. Truebner et al: Short-and Long-Term Joint Symbolic Dynamics of Heart Rate and Blood Pressure in Dilated Cardiomyopathy, IEEE Trans. on Biomed. Eng, Vol. 52; pp. 2112-2115, 2005
[9] M. Jeruchim: Techniques for Estimating the Bit Error Rate in the Simulation of Digital Communication Systems, IEEE JSAC, Vol. 2, No. 1, pp. 153-170, Jan. 1984
[10] M. P. Tarvainen, P. O. Ranta-aho, P. A. Karjalainen: An Advanced Detrending Method with Application to HRV Analysis, IEEE Trans. on Biomed. Engineering, Vol. 49, pp. 172-175, February 2001
[11] R. Karvajal et al.: Dimensional Analysis of HRV in Hypertrophic Cardiomyopathy Patientes, IEEE Engineering in Medicine and Biology, 21(4), pp. 71-78, July 2002
[12] S. M. Pincus: Approximate Entropy as a Measure of System Complexity, in Proceedings of Nat. Acad. Sci. USA;Vol. 88, pp. 2297-2301, 1991
[13] T. Bell, J. Cleary, I. Witten: Text Compression, Prentice Hall, New Jersey, 1990