Author’s Accepted Manuscript
Evaporative fluorophore labeling of carbohydrates via reductive amination
Balazs Reider, Marton Szigeti, Andras Guttman
PII: S0039-9140(18)30341-2
DOI: https://doi.org/10.1016/j.talanta.2018.03.101 Reference: TAL18535
To appear in: Talanta
Received date: 15 January 2018 Revised date: 13 March 2018 Accepted date: 29 March 2018
Cite this article as: Balazs Reider, Marton Szigeti and Andras Guttman, Evaporative fluorophore labeling of carbohydrates via reductive amination, Talanta, https://doi.org/10.1016/j.talanta.2018.03.101
This is a PDF file of an unedited manuscript that has been accepted for publication. As a service to our customers we are providing this early version of the manuscript. The manuscript will undergo copyediting, typesetting, and review of the resulting galley proof before it is published in its final citable form.
Please note that during the production process errors may be discovered which could affect the content, and all legal disclaimers that apply to the journal pertain.
www.elsevier.com/locate/talanta
Evaporative fluorophore labeling of carbohydrates via reductive amination
Balazs Reider1, Marton Szigeti1,2, Andras Guttman2
1MTA-PE Translational Glycomics Research Group, Research Institute of Biomolecular and Chemical Engineering, University of Pannonia, 10 Egyetem Street, Veszprem, 8200, Hungary
2 AOK, MMKK, University of Debrecen, 98 Nagyerdei Krt, Debrecen, 4032, Hungary
Abstract
As analytical glycomics became to prominence, newer and more efficient sample preparation methods are being developed. Albeit, numerous reductive amination based carbohydrate labeling protocols have been reported in the literature, the preferred way to conduct the reaction is in closed vials. Here we report on a novel evaporative labeling protocol with the great advantage of continuously concentrating the reagents during the tagging reaction, therefore accommodating to reach the optimal reagent concentrations for a wide range of glycan structures in a complex mixture. The optimized conditions of the evaporative labeling process minimized sialylation loss, otherwise representing a major issue in reductive amination based carbohydrate tagging. In addition, complete and uniform dispersion of dry samples was obtained by supplementing the low volume labeling mixtures (several microliters) with the addition of extra solvent (e.g., THF).
Evaporative labeling is an automation-friendly glycan labeling method, suitable for standard open 96 well plate format operation.
Graphical abstract
Abbreviations: PNGase F, peptide-N4-(N-acetyl-beta-glucosaminyl) asparagine-amidase;
hIgG1, Immunoglobulin G1; APTS, 8-aminopyrene-1,3,6-trisulfonic acid; THF, tetrahydrofuran;
Keywords: evaporation, fluorophore labeling, APTS, capillary electrophoresis
Introduction
As glycomics research is getting more and more important in systems biology and for the biopharmaceutical industry, new glycoanalytical tools and the associated sample preparation protocols are continuously developed [1]. The rapid emergence of this field was mostly initiated by the recent introduction of numerous monoclonal antibody (mAb) therapeutics and their biosimilar versions. In 2017 eight of the top 10 best-selling drugs were large molecules, most of them mAbs or fusion glycoproteins [2]. Glycosylation is one of the major and most complicated forms of post-translational modifications that plays essential roles in the activity and effector function of monoclonal antibodies [3] demanding improved glycoanalytical methods. Frequently
used techniques for carbohydrate analysis are mass spectrometry (MS) [4], liquid chromatography (LC) [5, 6], capillary electrophoresis (CE) [7-9], some combination of them [10-12] and if necessary, nuclear magnetic resonance spectroscopy (NMR) [13, 14].
Carbohydrates do not possess fluorophore or chromophore groups, thus derivatization methods like fluorophore labeling are commonly used to accommodate their analysis in liquid phase separation methods such as capillary electrophoresis (CE) and liquid chromatography (LC) with UV/VIS or fluorescent detection. One of the most generally used techniques to release reductive amination taggable N-linked oligosaccharides (i.e., aldehyde forms), is via PNGase F [peptide- N4-(N-acetyl-beta-glucosaminyl) asparagine-amidase] digestion, due to its reliable and specific cleavage capability and moderate reaction conditions [15]. As a result of continuous developments, the traditional protocol of overnight PNGase F digestion at 37°C has been successfully accelerated by microwave irradiation [16], pressure cycling technology [17], or with the utilization of immobilized PNGase F microreactors [18, 19]. The released carbohydrates can be tagged at their reductive ends in various ways, such as by Michael-type addition [20] or hydrazine labeling [21], but the most commonly used method is reductive amination in a two- step-reaction. During the first step a Schiff-base is formed in the presence of an acid catalyst, followed by reduction to form a stable conjugate in the second step. For this latter, sodium- cyanoborohydride (NaBH3CN) is used in most instances as reductive agent [22], but other methods utilizing sodium-triacetoxyborohydride (NaBH(O2CCH3)3) [23], borane-diethylamine ((CH3)2NHBH3) [24], 2-picoline-borane (pic-BH3) [25] or by the recently introduced transfer hydrogenation technique [26] have also been reported. The reaction speed and yield of this acid- catalyzed labeling reaction is greatly influenced by the amount and type of acid used. Organic acids with low pKa, such as acetic acid (pKa = 4.75), malonic acid (pKa1 = 2.83) or citric acid (pKa1 = 3.15), are more commonly used to accelerate glycan labeling [27, 28]. Studies have shown that stronger acids were able to increase derivatization yield [29], but their use was associated with higher sialic acid loss [30]. Among the numerous sugar labeling dyes the 8- aminopyrene-1,3,6-trisulfonic acid (APTS) [7] and 8-aminonaphthalene-1,3,6-trisulfonic (ANTS) [31] are the mostly used fluorophores in sugar analysis using electric field mediated separation methods as they are multiply charged and provide high fluorescent yield [32].
Procedures reported in the literature apply comparable but not unified reaction conditions and reagent volumes for fluorescent sugar labeling [10], most of them suggesting overnight incubation at 37°C [29, 33] or several hours of reaction times at higher temperatures (50°C) [34].
Recently introduced rapid labeling approaches required only 20 minutes reaction time, but at 60°C [35]. Practically all but this latter method used sealed vials to prevent evaporation of the
reaction mixture components and the labeling reaction volumes have been varied from several microliters up to tens of microliters. Structure specific labeling of various glycans, especially core-GlcNAc modifications have shown no difference in their derivatization yield as was reported earlier using core fucosylated and afucosylated complex carbohydrate standards [36].
Here we introduce a novel, evaporative process based glycan labeling protocol utilizing an open vial format during the tagging reaction. This method took advantage of the continuous evaporation of the reaction mixture components, with the assumption that the optimal reagent concentration is reached at some point of the process for a great diversity of carbohydrate structures, thus increasing derivatization yield as manifested in greater peak areas.
Materials and Methods Chemicals and Reagents
Human immunoglobulin G1 (hIgG1), acetic acid (glacial), sodium-cyanoborohydride (1M in THF), tetrahydrofuran, water (HPLC grade) and acetonitrile were obtained from Sigma Aldrich (St. Louis, MO, USA). Etanercept was kindly provided by the Medical School of the Univeristy of Debrecen (Debrecen, Hungray). The Fast Glycan Labeling and Analysis Kit, including the tagging dye of 8-aminopyrene-1,3,6-trisulfonic acid (APTS), HR-NCHO separation gel-buffer system and magnetic beads for excess dye removal were from SCIEX (Brea, CA, USA). The PNGase F enzyme was from UD Genomed (Debrecen, Hungary).
Sample Preparation
Sample preparation started with the addition of 5.0 µl of denaturation solution from the Fast Glycan Labeling and Analysis Kit to 10 µl of 10 mg/ml aqueous hIgG1 (test protein) and etanercept (target protein) solutions. The denaturation step proceeded for 8.0 minutes at 60°C, followed by the addition of 15 µL of water and 1.0 µL of PNGase F (2.5 mU) to the mixture and incubation at 50°C for 60 minutes. The released N-linked carbohydrate samples were aliquoted and dried at 60°C under reduced pressure (SpeedVac; 2,500 rpm) followed by mixing with the labeling solution containing 3.0 µl of 40 mM APTS in 20% acetic acid and 2.0 µl of NaBH3CN (1M in THF). The effects of additional 20% acetic acid and THF were evaluated as specified later. The reaction mixtures were incubated in a heating block at 40°C, 50°C and 60°C with closed (no evaporation) or open lid (evaporative labeling) vials. After the labeling step, the samples were magnetic bead purified and analyzed by CGE-LIF.
Capillary gel electrophoresis
A PA800 Plus Pharmaceutical Analysis System (SCIEX) with laser induced fluorescence detection (λex=488 / λem=520 nm) was used for all capillary gel electrophoresis separations employing the HR-NCHO separation gel buffer in a 20 cm effective length (30 cm total length, 50 µm ID) bare fused silica capillary. The applied electric field strength was 30 kV in reversed polarity mode (cathode at the injection side, anode at the detection side). The separation temperature was set at 30°C. A three-step electrokinetic sample injection was applied: 1) 3.0 psi for 5.0 sec water pre-injection, 2) 1.0 kV for 1.0 sec sample injection and 3) 1.0 kV for 1.0 sec bracketing standard (BST, DP2 and DP15). The 32Karat (version 10.1) software package (SCIEX) was used for data acquisition and interpretation.
Results and Discussion
The effect of continuous evaporation on the reduction amination based fluorophore labeling reaction of sugars was evaluated in an open vial format and compared to the conventional closed vial based method using the exact same reaction conditions. Three different reaction temperatures were studied (40°C, 50°C and 60°C) with the addition of zero, 4.0 µl and 8.0 µl of 20% extra acetic acid to the 3.0 µl 20% acetic acid containing APTS solution to the labeling mixture (total reaction volumes were 5.0, 9.0 and 13 µl, respectively) to ensure properly extended evaporation times (i.e., dryness only at the end of the process) in all instances. To obtain the same derivatization efficiency at lower temperatures and higher reaction volumes required longer labeling times as depicted in Table 1. In all instances, the maximum derivatization time was defined by the drying time of the open vial method, e.g., 40 min for the no extra acetic acid containing reaction mixture at 40°C (first line in Table 1). The same exact reaction conditions were used for the closed-vial labeling method and the resulting total peak areas, as well as for the subset of peaks representing the sialylated glycans are all compared in Table 1. As one can observe in Figure 1, up to four times higher detection signal was obtained with the use of the evaporative labeling protocol (50°C; and the addition of 4.0 μ of 20% acetic acid). The highest peak areas were obtained at 60°C labeling temperature with the addition of extra 8.0 µl of 20% acetic acid to the reaction mixture (total reaction volume: 13 µl). Equally importantly, the peak area percentages of the sialylated glycan representing peaks were between 14-21% using the closed-vial method, while were preserved significantly better using the open- vial labeling approach (20-24%), suggesting greater stability of the latter. The lowest sialic acid loss was observed at 40°C labeling temperature without any additional acetic acid in the reaction mixture (total reaction volume: 5.0 µl). Therefore, to accommodate the two important labeling requirements, i.e., highest possible peak areas and lowest sialic acid loss, 50°C reaction temperature with the addition of extra 4.0 µl of 20% acetic acid (total reaction volume: 9.0 µl)
and 60 min incubation time is recommended (Figure 1, trace a). However, if minimizing the sialic acid loss is top priority, the same extra 4.0 µl of 20% acetic acid addition, but at 40°C reaction temperature for 90 minutes is endorsed.
Table 1. Comparison of total peak areas and the sialoform subset of the hIgG1 N-glycan structures using evaporative and conventional (closed vial based) reductive amination based fluorophore labeling. The comparative study included three different reaction temperatures (40°C, 50°C and 60°C) with different volumes of extra catalyst added (none, 4.0 µl and 8.0 µl of 20% acetic acid, total reaction volumes 5.0, 9.0 and 13 µl, respectively). Reaction times were defined by reaching complete dryness for the open vial reactions.
Temperature and additional catalyst (20% acetic acid) volume
Reaction time (min)
Total peak area Sialylated peak area Sialylated % Open vial Closed vial Open vial Closed vial Open vial Closed vial 40° ; +0.0 μ 20% d 40 23.37 ± 0.47 16.37 ± 0.99 5.61 ± 0.17 3.01 ± 0.11 24.26 ± 1.69 18.77 ± 1.02 40° ; +4.0 μ 20% d 90 32.48 ± 0.99 29.61 ± 1.52 7.87 ± 0.19 5.25 ± 0.43 24.02 ± 0.39 18.11 ± 0.78 40° ; +8.0 μ 20% d 230 49.50 ± 2.21 33.73 ± 1.24 11.40 ± 0.40 4.87 ± 0.07 23.53 ± 0.54 14.78 ± 0.30 50° ; +0.0 μ 20% d 30 78.17 ± 1.84 25.12 ± 1.30 17.91 ± 0.36 5.29 ± 0.13 23.23 ± 0.61 21.03 ± 1.09 50° ; +4.0 μ 20% d 60 89.50 ± 1.81 19.68 ± 0.19 18.54 ± 0.50 3.40 ± 0.04 21.88 ± 0.23 17.13 ± 0.49 50° ; +8.0 μ 20% d 120 93.67 ± 3.69 39.91 ± 2.01 20.93 ± 0.86 5.94 ± 0.35 22.02 ± 1.04 15.75 ± 0.37 60° ; +0.0 μ 20% d 20 57.49 ± 3.02 18.20 ± 0.59 12.80 ± 0.65 3.46 ± 0.07 22.21 ± 0.29 19.15 ± 0.45 60° ; +4.0 μ 20% d 40 113.75 ± 5.28 38.29 ± 1.78 22.23 ± 0.67 6.13 ± 0.12 20.76 ± 1.20 16.31 ± 0.29 60° ; +8.0 μ 20% d 75 121.81 ± 3.84 52.14 ± 0.64 24.71 ± 0.87 7.30 ± 0.34 20.11 ± 0.67 14.22 ± 0.28
Evaporative labeling was also applied on tagging the PNGase F released N-glycans from 100 µg of etanercept target glycoprotein and compared to the traditional closed lid derivatization method. One hour incubation was used in both instances for the labeling process. Similar to the hIgG1 sample, evaporative labeling showed increased peak areas and decreased sialic acid loss.
In this case, a total of 13.75% increment was observed in percent values of the sialylated structures. The ratio of core and non-core fucosylated sialic acid containing glycans was also investigated to determine if there were any alterations caused by the evaporative labeling approach, compared to the traditional closed lid method. Negligible differences were found between core fucosylated and non-core fucosylated sialylated area % ratios using the two different labeling protocols as shown by the results with the peak evaluation table inset in Figure 2.
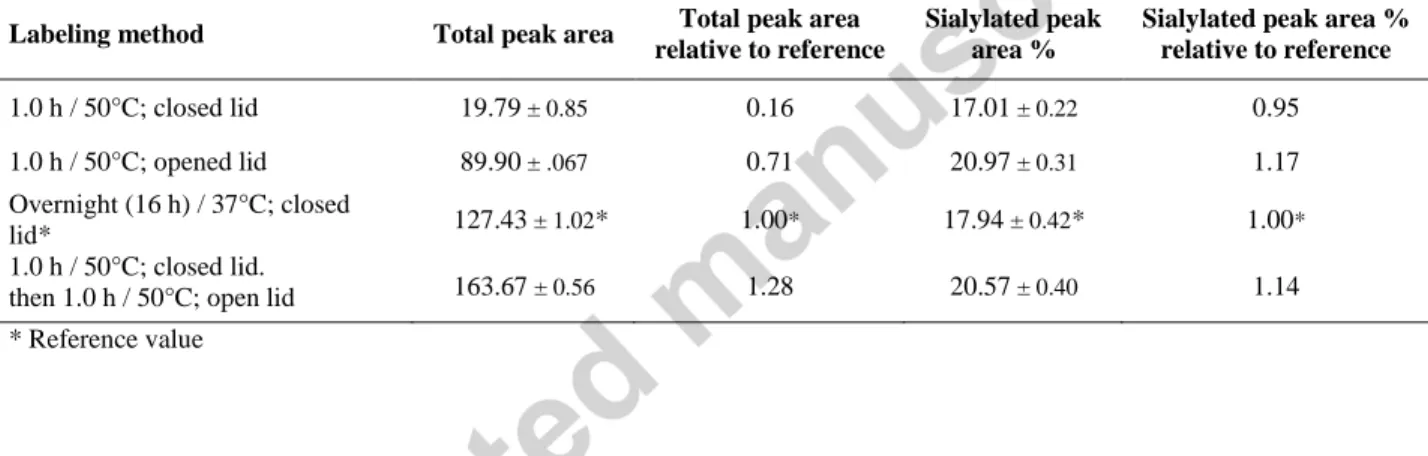
Next, the evaporative labeling technique was compared to the traditional overnight labeling method at 37°C to evaluate the overall performance and the sialylated peak area % values. hIgG1 samples were labeled at 50°C for one hour with the lid open and closed, as well as at 37°C overnight standard protocol (16 hours). Furthermore, a combination of the closed and open lid method were also carried out by applying 50°C for one hour with the lid closed, then 50°C for
one hour with the lid open. The labeling efficiency was only 16% at 50°C for one hour labeling with the lid closed, but by applying the open lid based evaporative labeling approach, it resulted in 71% compared to the reference overnight labeling at 37°C with the lid closed. Please note that the reaction time using the evaporative labeling method took only one hour, instead of overnight (16 h) with 3.03% higher sialylated peak area. More interestingly, combination of the traditional closed lid method with the evaporative labeling approach (open lid) outperformed the overnight reference method, both in overall performance (total peak areas) and in preserving the sialylated glycan structures but at a cost of an additional hour of the process. By all means in every instance, the evaporative labeling approach resulted in higher derivatization yield and greater sialylated peak area % values compared to the closed lid methods, as shown in Table 2.
Table 2. Effect of the different APTS labeling approaches of hIgG1 released N-linked glycans on overall fluorophore labeling performance (total peak area) and sialylated peak area % values compared to the traditional overnight 37°C labeling method.Separation and injection parameters were the same as in Figure 1.
Labeling method Total peak area Total peak area relative to reference
Sialylated peak area %
Sialylated peak area % relative to reference
1.0 h / 50°C; closed lid 19.79 ± 0.85 0.16 17.01 ± 0.22 0.95
1.0 h / 50°C; opened lid 89.90 ± .067 0.71 20.97 ± 0.31 1.17
Overnight (16 h) / 37°C; closed
lid* 127.43 ± 1.02* 1.00* 17.94 ± 0.42* 1.00*
1.0 h / 50°C; closed lid.
then 1.0 h / 50°C; open lid 163.67 ± 0.56 1.28 20.57 ± 0.40 1.14
* Reference value
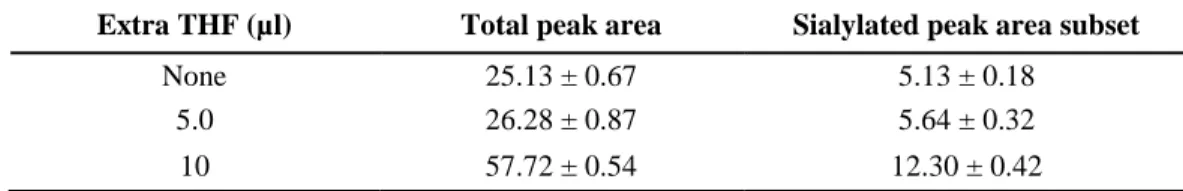
Mechanically dispensing dry samples with very low reagent volumes (several microliters) is a challenging step in reductive amination based sugar labeling. Frequently used current protocols suggest the addition of 4.0 µl – 6.0 µl labeling mixture per reaction, making it difficult to uniformly mix the reactants in the microvials, leading to possible sample loss. To alleviate this issue, we suggest the addition of extra tetrahydrofuran (THF) to the labeling reaction and avoiding this handicap by increasing the reaction volume. Please note that in most instances THF is the solvent of the reducing agent (e.g., sodium cyanoborohydride) in the reaction mixture, thus, readily miscible with the labeling solution, not affecting the reaction, and featuring a low boiling point (66°C) supporting rapid evaporation. A comparative study was executed by using the evaporative open vial labeling method with the addition of zero, 5.0 and 10 µl THF to the reaction mixtures (total reaction volumes were 5.0, 10 and 15 µl, respectively). This extra THF greatly accommodated uniform sample uptake by providing the sufficient volume for proper mixing (e.g., by vortexing). Importantly, the same reaction times could be used as delineated in Table 1, due to the rapid evaporation of THF from the reaction mixture in the open vial labeling
protocol. The results are shown in Table 3, featuring more than doubled peak areas, when 10 µl of extra THF was added to the labeling solution (total reaction volume was 15 µl). Since neither the reaction time nor any other conditions were changed, sialic acid loss was also minimized.
Table 3. Peak area comparison using the open vial labeling approach of dry sugar samples with the addition of none, 5.0 µl and 10 µl extra THF (total reaction volumes were 5.0, 10 and 15 µl, respectively). Labeling conditions: 60°C for 20 minutes with no extra 20% acetic acid added.
Extra THF (µl) Total peak area Sialylated peak area subset
None 25.13 ± 0.67 5.13 ± 0.18
5.0 26.28 ± 0.87 5.64 ± 0.32
10 57.72 ± 0.54 12.30 ± 0.42
Conclusions
An optimized, reductive amination based carbohydrate labeling method is presented for capillary electrophoresis analysis of reducing oligosaccharides utilizing a novel, open vial based fluorophore tagging approach that lead to gradual decrease in the reaction volumes during the derivatization step. Thus, the evaporation process caused continuous concentration of the reactants, speeding up in this way the reaction rate and resulted in significant increase of the peak areas compared to the conventional closed vial based labeling protocol. Various reaction conditions, including different temperatures and reaction times (set by the additional acetic acid to prolong the evaporation of the reaction mixture) were investigated to obtain the highest labeling yield (i.e., peak area), while minimizing sialylation loss as important criteria. Since the low volume of the labeling reaction mixture (several microliters) made difficult to accomplish complete and uniform dispersion of dry samples, the reagent volume was increased by the addition of tetrahydrofuran. This step allowed the use of simple vortexing based uniform sample reconstitution without any requirement to increase the reaction times or alter conditions. The optimized labeling protocol for 100 µg glycoprotein (hIgG1 and eternecept, in our case) was as follows: 60 minutes in closed vial followed by 60 minutes evaporative labeling (combined method) at 50°C with the standard labeling reagents of 3.0 µl of 40 mM APTS (in 20% acetic acid) and 2.0 µl of NaBH3CN (1M in THF) using additional 4.0 µl of extra 20% acetic acid and 6.0 µl of THF (total reaction volume: 15 µl). These parameters resulted in excellent labeling efficiency and minimal sialic acid loss. If sialic acid loss represents a concern, 90 minute labeling at 40°C with the addition of 4.0 µl extra 20% acetic acid and 6.0 µl THF to the standard labeling mixture is recommended. Please note that the open vial evaporative labeling format is fully compatible with liquid handling robot based automation for 96 well sample-plate operation.
Acknowledgements
The authors gratefully acknowledge the support of the National Research. Development and Innovation Office (NKFIH) (K 116263) grants of the Hungarian Government. This work was also supported by the BIONANO_GINOP-2.3.2-15-2016-00017 project. This is contribution
#139 from the Horvath Csaba Laboratory of Bioseparation Sciences.
References
[1] K. Marino, J. Bones, J.J. Kattla, P.M. Rudd, A systematic approach to protein glycosylation analysis: a path through the maze, Nat Chem Biol 6(10) (2010) 713-23.
[2] https://igeahub.com/2017/08/08/top-20-drugs-in-the-world-2017/ Access date: 2018.01.08.
[3] D. Shental-Bechor, Y. Levy, Folding of glycoproteins: toward understanding the biophysics of the glycosylation code, Curr Opin Struct Biol 19(5) (2009) 524-533.
[4] D.J. Harvey, Identification of protein-bound carbohydrates by mass spectrometry, Proteomics 1(2) (2001) 311-28.
[5] Y. Mechref, Y. Hu, J.L. Desantos-Garcia, A. Hussein, H. Tang, Quantitative glycomics strategies, Mol Cell Proteomics 12(4) (2013) 874-84.
[6] G.C. Vreeker, M. Wuhrer, Reversed-phase separation methods for glycan analysis, Anal Bioanal Chem 409(2) (2017) 359-378.
[7] A. Guttman, F.T. Chen, R.A. Evangelista, N. Cooke, High-resolution capillary gel electrophoresis of reducing oligosaccharides labeled with 1-aminopyrene-3,6,8-trisulfonate, Anal Biochem 233(2) (1996) 234-42.
[8] A. Guttman, A. Rathore, I. Krull, Bioanalytical Tools for the Characterization of Biologics and Biosimilars, 2012.
[9] S. Kamoda, K. Kakehi, Capillary electrophoresis for the analysis of glycoprotein pharmaceuticals, Electrophoresis 27(12) (2006) 2495-504.
[10] L.R. Ruhaak, G. Zauner, C. Huhn, C. Bruggink, A.M. Deelder, M. Wuhrer, Glycan labeling strategies and their use in identification and quantification, Anal Bioanal Chem 397(8) (2010) 3457-81.
[11] B. Mulloy, A. Dell, P. Stanley, H.P. J, Structural Analysis of Glycans, in: A. Varki, R.D.
Cummings, J.D. Esko, P. Stanley, G.W. Hart, M. Aebi, A.G. Darvill, T. Kinoshita, N.H. Packer, J.H. Prestegard, R.L. Schnaar, P.H. Seeberger (Eds.), Essentials of Glycobiology, Cold Spring Harbor (NY), 2015.
[12] S. Amon, A.D. Zamfir, A. Rizzi, Glycosylation analysis of glycoproteins and proteoglycans using capillary electrophoresis-mass spectrometry strategies, Electrophoresis 29(12) (2008) 2485-507.
[13] J. Duus, C.H. Gotfredsen, K. Bock, Carbohydrate structural determination by NMR spectroscopy: modern methods and limitations, Chem Rev 100(12) (2000) 4589-614.
[14] M.D. Battistel, H.F. Azurmendi, B. Yu, D.I. Freedberg, NMR of glycans: shedding new light on old problems, Prog Nucl Magn Reson Spectrosc 79 (2014) 48-68.
[15] R.A. O'Neill, Enzymatic release of oligosaccharides from glycoproteins for chromatographic and electrophoretic analysis, J Chrom A 720(1) (1996) 201-215.
[16] H. Zhou, A.C. Briscoe, J.W. Froehlich, R.S. Lee, PNGase F catalyzes de-N-glycosylation in a domestic microwave, Anal Biochem 427(1) (2012) 33-5.
[17] Z. Szabo, A. Guttman, B.L. Karger, Rapid release of N-linked glycans from glycoproteins by pressure-cycling technology, Anal Chem 82(6) (2010) 2588-93.
[18] J. Krenkova, A. Szekrenyes, Z. Keresztessy, F. Foret, A. Guttman, Oriented immobilization of peptide-N-glycosidase F on a monolithic support for glycosylation analysis, J Chrom A 1322 (2013) 54-61.
[19] M. Szigeti, J. Bondar, D. Gjerde, Z. Keresztessy, A. Szekrenyes, A. Guttman, Rapid N- glycan release from glycoproteins using immobilized PNGase F microcolumns, J Chromatogr B Analyt Technol Biomed Life Sci 1032 (2016) 139-143.
[20] J. You, X. Sheng, C. Ding, Z. Sun, Y. Suo, H. Wang, Y. Li, Detection of carbohydrates using new labeling reagent 1-(2-naphthyl)-3-methyl-5-pyrazolone by capillary zone electrophoresis with absorbance (UV), Anal Chim Acta 609(1) (2008) 66-75.
[21] Y. Shinohara, H. Sota, M. Gotoh, M. Hasebe, M. Tosu, J. Nakao, Y. Hasegawa, M. Shiga, Bifunctional labeling reagent for oligosaccharides to incorporate both chromophore and biotin groups, Anal Chem 68(15) (1996) 2573-9.
[22] J.C. Bigge, T.P. Patel, J.A. Bruce, P.N. Goulding, S.M. Charles, R.B. Parekh, Nonselective and Efficient Fluorescent Labeling of Glycans Using 2-Amino Benzamide and Anthranilic Acid, Anal Biochem 230(2) (1995) 229-238.
[23] D.S. Dalpathado, H. Jiang, M.A. Kater, H. Desaire, Reductive amination of carbohydrates using NaBH(OAc)3, Anal Bioanal Chem 381(6) (2005) 1130-1137.
[24] D. Locke, C.G. Bevans, L.-X. Wang, Y. Zhang, A.L. Harris, Y.C. Lee, Neutral, acidic, and basic derivatives of anthranilamide that confer different formal charge to reducing oligosaccharides, Carbohydr Res 339(2) (2004) 221-231.
[25] L.R. Ruhaak, E. Steenvoorden, C.A.M. Koeleman, A.M. Deelder, M. Wuhrer, 2-Picoline- borane: A non-toxic reducing agent for oligosaccharide labeling by reductive amination, Proteomics 10(12) (2010) 2330-2336.
[26] Z. Kovacs, G. Papp, H. Horvath, F. Joo, A. Guttman, A novel carbohydrate labeling method utilizing transfer hydrogenation-mediated reductive amination, Journal of pharmaceutical and biomedical analysis 142 (2017) 324-327.
[27] K.R. Anumula, Advances in fluorescence derivatization methods for high-performance liquid chromatographic analysis of glycoprotein carbohydrates, Anal Biochem 350(1) (2006) 1- 23.
[28] L.R. Ruhaak, R. Hennig, C. Huhn, M. Borowiak, R.J.E.M. Dolhain, A.M. Deelder, E. Rapp, M. Wuhrer, Optimized Workflow for Preparation of APTS-Labeled N-Glycans Allowing High- Throughput Analysis of Human Plasma Glycomes using 48-Channel Multiplexed CGE-LIF, J Proteome Res 9(12) (2010) 6655-6664.
[29] R.A. Evangelista, A. Guttman, F.T. Chen, Acid-catalyzed reductive amination of aldoses with 8-aminopyrene-1,3,6-trisulfonate, Electrophoresis 17(2) (1996) 347-51.
[30] F.T. A. Chen, T. S Dobashi, R.A. Evangelista, Quantitative analysis of sugar constituents of glycoproteins by capillary electrophoresis, 1998.
[31] C. Chiesa, C. Horváth, Capillary zone electrophoresis of malto-oligosaccharides derivatized with 8-aminonaphthalene-1,3,6-trisulfonic acid, J Chrom A 645(2) (1993) 337-352.
[32] A. Paulus, A. Klockow-Beck, Analysis of carbohydrates by capillary electrophoresis, (Ed Kevin Altria), Vieweg and Sohn mbH, Brausweig/Wiesbaden, Germany (1999).
[33] F.-T.A. Chen, R.A. Evangelista, Profiling glycoprotein N-linked oligosaccharide by capillary electrophoresis, Electrophoresis 19(15) (1998) 2639-2644.
[34] C. Váradi, C. Lew, A. Guttman, Rapid Magnetic Bead Based Sample Preparation for Automated and High Throughput N-Glycan Analysis of Therapeutic Antibodies, Anal Chem 86(12) (2014) 5682-5687.
[35] M. Szigeti, C. Lew, K. Roby, A. Guttman, Fully Automated Sample Preparation for Ultrafast N-Glycosylation Analysis of Antibody Therapeutics, J Lab Autom 21(2) (2016) 281-6.
[36] Y. Wang, M. Santos, A. Guttman, Comparative core fucosylation analysis of some major therapeutic antibody N-glycans by direct infusion ESI-MS and CE-LIF detection, Journal of Separation Science 36(17) (2013) 2862-7.
Figure 1. Comparison of the evaporative (trace a, open vial) and conventional (trace b, closed vial) APTS labeling of PNGase F released hIgG1 glycans. Labeling conditions: 50°C for 60 w dd x 4.0 μ 20% d x . Separation conditions: 20 cm effective length (30 cm total), 50 µm ID bare fused silica capillary;
30 kV separation voltage. Injection: preinjection of water for 3.0 sec at 5.0 psi was followed by 1.0 kV/1.0 sec sample and 1.0 kV/1.0 sec bracketing standard (DP2 + DP15) injection.
Figure 2. Comparison of the evaporative (trace a, open vial) and conventional (trace b, closed vial) based labeling protocols using etanercept sample. The inset depicts the actual labeling efficiency in both instances. Labeling, separation and injection parameters were the same as in Figure 1.
Highlights
The evaporation process supported auto-optimization of the reagent concentrations
The open vial (evaporative) method significantly increased derivatization yield
The evaporative labeling process minimized sialylation loss