0139–3006 © 2018 Akadémiai Kiadó, Budapest DOI: 10.1556/066.2018.47.4.14
VALIDATION OF DIFFERENTIAL PULSE POLAROGRAPHIC METHOD OF ASCORBIC ACID ASSAY IN FOOD – COMPARISON
WITH THE CHROMATOGRAPHIC REFERENCE METHOD
A. MAZUREK, M. WŁODARCZYK-STASIAK* and J. JAMROZ Department of Analysis and Evaluation of Food Quality, University of Life Sciences,
Skromna 8, 20-704 Lublin, Poland (Received: 21 March 2018; accepted: 6 June 2018)
The objective of the study was to demonstrate the applicability of differential pulse polarography (DPP) technique of the ascorbic acid (AA) assay for the analysis of food samples with various matrices. The following validation parameters were determined: selectivity, linearity, precision, accuracy, limit of detection, and limit of quantifi cation.
The limits of detection and quantifi cation were 0.17 and 0.5 mg ascorbic acid per 100 g food, respectively. The average recovery of added ascorbic acid from all matrices was 96.3–103.6%. The values of the coeffi cient of variation calculated on the basis of AA contents for food matrices were in the range 2–9.26% and Horrat values were 0.37–1.10. Ascorbic acid values of the samples obtained from the polarographic method were compared with those obtained from high-performance liquid chromatography with diode-array detection (HPLC-DAD) used as the reference method. The analytical parameters determined showed that the polarographic method was equivalent to the chromatographic method. Validation of the polarographic method of ascorbic acid assay indicates that it can be applied for the analysis of ascorbic acid concentration in food products that do not contain isoascorbic acid. This means that the method can be recommended for routine determinations.
Keywords: ascorbic acid, chromatography, differential pulse polarography, validation, vitamin C
The most preferred analytical method used for determination of ascorbic acid concentration is high-performance liquid chromatography, as it ensures higher selectivity than spectrophotometry, titration, or enzymatic methods, and the level of its sensitivity depends largely on the choice of suitable detectors (NOVAKOVA et al., 2008). Ascorbic acid is electrochemically active and undergoes oxidation on the dropping mercury electrode. The polarographic techniques developed in the last decades, e.g. differential pulse polarography, eliminate certain drawbacks that occurred during the classic direct current polarography and are characterised by increased selectivity of determination and by measurement automation.
Polarography was applied for the analysis of AA content in food (BRANCA, 1980), spices (GERHARDT & WINDERMIILLER, 1981), fruit and vegetables (ESTEVE et al., 1995a), modifi ed milk (MANGLANO et al., 2004), pharmaceutical products (ISSA et al., 1984), fl our suspension (CHERDKIATGUMCHAI & GRANT, 1987), beverages and fruit juice (ZULUETA et al., 2010).
Among multiple reports concerning ascorbic acid determination, only ESTEVE and co- workers (1995b) compared the precision and results of determinations performed by the polarographic and chromatographic methods, and showed that the two methods are comparable. However, that study was concerned only with samples of infant formulas and did not include the determination of the other validation parameters. To demonstrate the applicability of the polarographic method for ascorbic acid assay in food products, it is necessary to use samples with various matrices: juices as well as fruit and vegetables, being
* To whom correspondence should be addressed.
Phone: +48 81 4623332; fax: +48 81 4623376; e-mail: marzena.stasiak@up.lublin.pl.
the primary source of AA in the diet, food supplements, and food products with high contents of starch or fat.
The objective of this study was to perform the validation of the differential pulse polarography method (DPP) of ascorbic acid assay of various kinds of food matrices using high-performance liquid chromatography with diode-array detection (HPLC-DAD) as the reference method. The validation of the chromatographic reference method was described in our previous paper (MAZUREK & JAMROZ, 2015).
1. Materials and methods
1.1. Food samples
The following materials were used: juices from local producers (multi-vegetable, grapefruit, orange), fruit and vegetables (banana, kiwi fruit, caulifl ower, broccoli, cucumber, tomato, parsley leaves), fruit cream powder, infant milk powder, and multivitamin syrup. All samples were purchased from local supermarkets in Lublin, Poland. The content of ascorbic acid found on the product label and typical range of ascorbic acid content in selected fruit and vegetables found in the literature (ZEMPLENI et al., 2007) are given in Table 2.
1.2. Sample preparation for analysis
The samples were weighed with an accuracy of 1 mg (ms), then 2% solution of metaphosphoric acid was added, and the sample mass with metaphosphoric acid was determined again (ms+a).
The dilution factors (D) were calculated and used for the determination of the analyte content in the samples.
s a s
m m
D
(1) The samples were homogenised for 1 min using an Ultra Turrax T18 Basic, (Ika, Germany) homogeniser, then they were centrifuged for 5 min at 12 000×g. The supernatant was fi ltered using a syringe fi lter with a porosity of 0.45 μm. The samples prior chroma- tographic measurement were stored for a maximum of 2 h. All analyses were made in six replicates.
1.3. Chromatographic analysis
The ascorbic acid analysis was performed using the method of reversed-phase high- performance liquid chromatography described in our previous paper (MAZUREK & JAMROZ, 2015).
1.4. Polarographic analysis
Ascorbic acid determinations were performed by the method of differential pulse polarography, using a voltammetric trace analyser Metrohm 746 VA (Switzerland) with a 747 VA stand. The potential of the working electrode was measured in relation to an Ag/AgCl/KCl reference electrode. Qualitative determination of ascorbic acid was performed based on the comparison of the potential of its peak (obtained from sample analysis) with the potential of peaks obtained after adding the standard solution three times to the sample. A quantitative assay was performed by the method of triple standard addition by means of an automatic dosing
Acta Alimentaria 47, 2018
unit Dosino 700 (Metrohm). The standard addition was selected during each determination in such a way that at the fi nal stage a 3-4-fold higher mass of ascorbic acid was obtained in the measurement vessel. Ascorbic acid content in the sample (AAp) was determined on the basis of formula (2):
CAA • D
AAp = ________ (2) 10
where: CAA: concentration of ascorbic acid in the extract (μg ml–1)
Ten millilitres of acetate buffer with pH 4.6 and 0.5 ml of an extract of the analysed sample were added directly to the polarographic vessel. Prior to polarographic measurement, the solution was fl ushed with argon for 5 minutes to remove oxygen. The following conditions were applied during the polarographic analysis: initial potential –50 mV, fi nal potential 200 mV, voltage step time 0.6 s, voltage step 6 mV, pulse duration 40 ms, pulse amplitude 50 mV, the rate of potential change 10 mV/s, drop size 0.38 mm2.
1.5. Method validation
Linearity, precision, lower limit of detection (LOD), and limit of quantifi cation (LOQ) as well as recovery were determined in accordance with the method described in our previous paper (MAZUREK & JAMROZ, 2015).
1.5.1. Selectivity. In the case of determination of vitamin C concentration, the fundamental condition necessary to confi rm the selectivity of the method is the possibility to obtain an analytical signal of ascorbic acid without interference from the presence of isoascorbic acid in the analysed sample. The peak potentials of ascorbic and isoascorbic acid obtained by differential pulse polarography were compared.
1.5.2. Accuracy. The accuracy of the polarographic method was determined by comparison of the results obtained using the polarographic method and the reference chromatographic method. For this purpose, the method of calculating the ratio of mean results and the uncertainty of the determination was applied (KONIECZKA & NAMIEŚNIK, 2009).
1.5.3. Comparison of precision of the methods. The comparison of precision of the polarographic and chromatographic methods was performed using Snedecor’s F test (KONIECZKA & NAMIEŚNIK, 2009).
2. Results and discussion
2.1. Selectivity
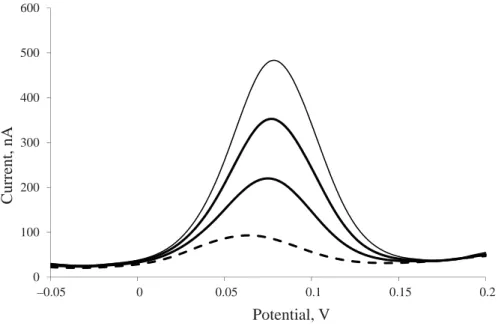
To verify the selectivity of the polarographic method, the potentials of ascorbic acid and isoascorbic acid peaks were compared. On the basis of the polarogram of isoascorbic acid solution, the value of peak potential was determined at 46 mV. The potential of the peak of ascorbic acid determined under the same conditions was 98 mV. The values of peak potentials are very close, and in the course of measurement using the technique of differential pulse polarography it is not possible to register separate peaks for each of the substances. Figure 1 presents a polarogram illustrating the measurement of a solution of ascorbic acid and isoascorbic acid, with three additions of the ascorbic acid standard. One can observe one peak
from the analysis of the sample with the potential of 63 mV, while the potential of peaks from the standard additions is 78 mV. This shows the lack of selectivity of that method in relation to isoascorbic acid, and therefore the method cannot be applied to samples of food products containing that acid. It should be noted that isoascorbic acid does not occur naturally, and it is used primarily in meat products as an additive with antioxidant properties.
0 100 200 300 400 500 600
–0.05 0 0.05 0.1 0.15 0.2
Current, nA
Potential, V
Fig. 1. A polarogram of ascorbic acid and isoascorbic acid (broken line) solution with three additions of ascorbic acid standard (solid lines)
2.2. Linearity
Table 1 presents the results of linear regression and statistical analysis of determinations of standard solutions. The determined value of the regression coeffi cient can show linearity of polarograph readings within the range of the analysed concentrations. As a result of analysis of signifi cance of the determined coeffi cients of the calibration graph, it was found that the slope value differs signifi cantly from zero, which is in agreement with the requirements. The value of the free term also differs from zero in a signifi cant manner, but this is contrary to the assumptions of analysis of linearity performed on the basis of the regression coeffi cient value.
Table 1. The values of parameters calculated on the basis of calibration curve to determine the linearity of polarograph readings
Calibration curve y=1.5431x–2.102
Regression coeffi cient r 0.9998
tcr 2.074
ta 266.397
tb 7.350
tcr: critical value of Student’s t-test read from the Tables for signifi cance level α=0.05 and number of degrees of freedom f=22.
ta and tb: parameters of Student’s t-test determined for the slope and free term in the linear regression equation
Acta Alimentaria 47, 2018
In relation to the above and based on the obtained results, a graph was plotted of the correlation between the constant of polarograph response and ascorbic acid concentration (Fig. 2). Analysis of the data shows that the concentrations of 5, 10, 75, and 100 μg ml–1 of standard solutions are situated outside the linear range. For this reason, the concentrations were divided into two ranges – from 5 to 20 μg ml–1 and from 20 to 100 μg ml–1 –, and graphs were plotted of the correlation between the ratio of current intensity vs. concentration, presented in Figure 3 (A and B). On their basis, the linearity of polarograph readings was found, described by two calibration curve equations dependent on the range of ascorbic acid concentrations (5–20 μg ml–1, y=1.4384x–0.7517; 20–100 μg ml–1, y=1.5514x–2.6901).
1.25 1.3 1.35 1.4 1.45 1.5 1.55
0 20 40 60 80 100
Constant of response
Concentration, μg ml–1
+5%
–5%
mean
Fig. 2. Correlation between the constant of polarograph response and ascorbic acid concentration in the range from 5 to 100 μg ml–1
2.3. Limits of detection and quantifi cation
The limit of detection was determined on the basis of parameters of the standard curve, which was obtained from the analysis of standard solutions within the range from 5 to 20 μg ml–1. The limit of detection was calculated on the basis of standard deviation of free term sa (0.304 nA) and of residual standard deviation sxy (0.431 nA):
LOD(sa)=0.70 μg ml–1 LOD(sxy)=0.99 μg ml–1
Similarly as in the case of determination of the limit of detection of the chromatographic reference method, the value adopted ultimately as the determined mean value was:
LOD=0.84 μg ml–1
The limit of quantifi cation was determined on the basis of the relation:
LOQ=3LOD LOQ=2.52 μg ml–1
which, when converted to ascorbic acid content in a sample according to the relation (2), for dilution factor of 2, is:
LOQ=0.5 mg/100 g
1.28 1.3 1.32 1.34 1.36 1.38 1.4 1.42 1.44 1.46
4 9 14 19
Constant of response
Concentration, μg ml–1
+5%
–5%
mean A
1.38 1.4 1.42 1.44 1.46 1.48 1.5 1.52 1.54 1.56 1.58
15 25 35 45 55 65 75 85 95 105
Constant of response
Concentration, μg ml–1
+5%
–5%
mean B
Fig. 3. Correlations between the constant of polarograph response and ascorbic acid concentration in the range from 5 to 20 μg ml–1 (A) and from 20 to 100 μg ml–1 (B)
The determined limit of detection was compared with literature data concerning methods employing the technique of differential pulse polarography. The determined value of the limit of detection coincides with the literature data: 0.182 μg ml–1 (CRASTON et al., 1991), 0.76 μg ml–1 (ZULUETA et al., 2010), 0.7 μg ml–1 (CHERDKIATGUMCHAI & GRANT, 1987). The limits of detection and quantifi cation of the polarographic method and the chromatographic reference method (LODHPLC-DAD=0.82 μg ml–1, LOQHPLC-DAD=2.46 μg ml–1) are close to each other, which indicates that the two methods are equivalent.
Acta Alimentaria 47, 2018
2.4. Precision
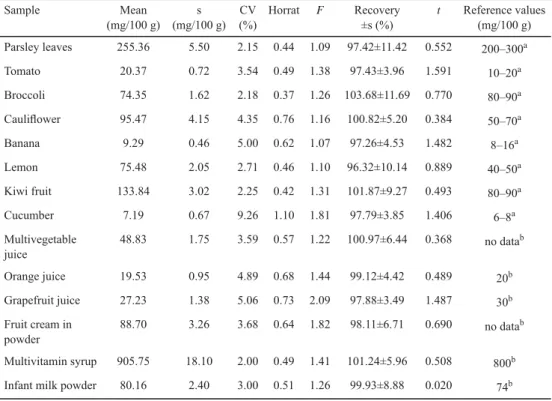
The values of the coeffi cient of variation (CV) within the range from 2% to 9.26% were determined on the basis of the results of analysis of ascorbic acid content (Table 2). The lowest value was observed for a sample of multivitamin syrup and the highest one for cucumber. The characteristic of the determined repeatability was performed on the basis of the HORRAT value, which values were within the correct interval (0.3–1.3) (AOAC, 2012) for all analysed samples; therefore, the polarographic method allows one to obtain precise results of the ascorbic acid determination. In the case of determinations of all samples using both methods, the analysis of the results of Snedecor’s F-distribution shows that there are no statistically signifi cant differences between standard deviations. Therefore, the DPP method is characterised by the same precision as the chromatographic reference method.
Table 2. Ascorbic acid content in the samples obtained by differential pulse polarography and statistical characteristics of the precision of determinations and recovery (tcr=2.571 and Fcr=5.05 for α=0.05 and f=5)
Sample Mean
(mg/100 g) s (mg/100 g)
CV (%)
Horrat F Recovery
±s (%)
t Reference values (mg/100 g) Parsley leaves 255.36 5.50 2.15 0.44 1.09 97.42±11.42 0.552 200–300a
Tomato 20.37 0.72 3.54 0.49 1.38 97.43±3.96 1.591 10–20a
Broccoli 74.35 1.62 2.18 0.37 1.26 103.68±11.69 0.770 80–90a
Caulifl ower 95.47 4.15 4.35 0.76 1.16 100.82±5.20 0.384 50–70a
Banana 9.29 0.46 5.00 0.62 1.07 97.26±4.53 1.482 8–16a
Lemon 75.48 2.05 2.71 0.46 1.10 96.32±10.14 0.889 40–50a
Kiwi fruit 133.84 3.02 2.25 0.42 1.31 101.87±9.27 0.493 80–90a
Cucumber 7.19 0.67 9.26 1.10 1.81 97.79±3.85 1.406 6–8a
Multivegetable juice
48.83 1.75 3.59 0.57 1.22 100.97±6.44 0.368 no datab
Orange juice 19.53 0.95 4.89 0.68 1.44 99.12±4.42 0.489 20b
Grapefruit juice 27.23 1.38 5.06 0.73 2.09 97.88±3.49 1.487 30b
Fruit cream in powder
88.70 3.26 3.68 0.64 1.82 98.11±6.71 0.690 no datab Multivitamin syrup 905.75 18.10 2.00 0.49 1.41 101.24±5.96 0.508 800b Infant milk powder 80.16 2.40 3.00 0.51 1.26 99.93±8.88 0.020 74b s: standard deviation; CV: coeffi cient of variation; Horrat: parameter defi ned as a ratio of coeffi cient of variation to coeffi cient estimated from the Horwitz equation; F: parameter of Snedecor’s F-test; t: parameter of Student’s t-test;
a: typical range of ascorbic acid content found in the literature (ZEMPLENI et al., 2007), b: the content of ascorbic acid found on the product label
2.5. Accuracy
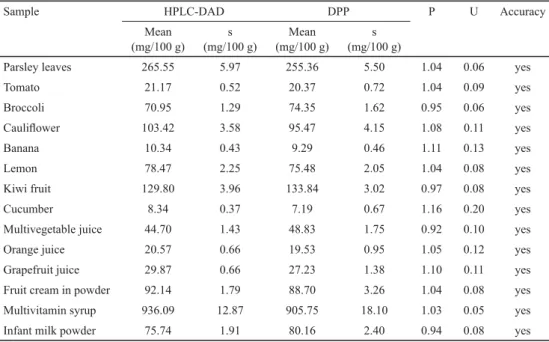
The accuracy of the polarographic method of the ascorbic acid assay was determined by comparing the obtained results of analyses of the same samples analysed at the same time using both the polarographic method and the chromatographic reference method. Based on
the analysis of the results presented in Table 3, it can be concluded that the results obtained by the polarographic method are correct, as mean values do not differ in a statistically signifi cant manner.
Table 3. Comparison of ascorbic acid values obtained by polarographic and chromatographic methods
Sample HPLC-DAD DPP P U Accuracy
Mean (mg/100 g)
s (mg/100 g)
Mean (mg/100 g)
s (mg/100 g)
Parsley leaves 265.55 5.97 255.36 5.50 1.04 0.06 yes
Tomato 21.17 0.52 20.37 0.72 1.04 0.09 yes
Broccoli 70.95 1.29 74.35 1.62 0.95 0.06 yes
Caulifl ower 103.42 3.58 95.47 4.15 1.08 0.11 yes
Banana 10.34 0.43 9.29 0.46 1.11 0.13 yes
Lemon 78.47 2.25 75.48 2.05 1.04 0.08 yes
Kiwi fruit 129.80 3.96 133.84 3.02 0.97 0.08 yes
Cucumber 8.34 0.37 7.19 0.67 1.16 0.20 yes
Multivegetable juice 44.70 1.43 48.83 1.75 0.92 0.10 yes
Orange juice 20.57 0.66 19.53 0.95 1.05 0.12 yes
Grapefruit juice 29.87 0.66 27.23 1.38 1.10 0.11 yes
Fruit cream in powder 92.14 1.79 88.70 3.26 1.04 0.08 yes
Multivitamin syrup 936.09 12.87 905.75 18.10 1.03 0.05 yes
Infant milk powder 75.74 1.91 80.16 2.40 0.94 0.08 yes
s: standard deviation; P: the ratio of means of determination results; U: uncertainty for P value
2.6. Recovery
Depending on the analysed sample, the value of the determined recovery of ascorbic acid varied from 96.32% to 103.68% (Table 2). The values are within the acceptable recovery range according to the AOAC (2012) for analyte content in the sample at the level of 10 ppm (80–110%). The results of statistical analysis using Student’s t-test show that there is no statistically signifi cant difference between the determined mean recovery values and the theoretical value of 100%.
3. Conclusions
The determined validation parameters of the polarographic method of ascorbic acid assay show that this method can be applied for the analysis of the content of that acid in food products that do not contain isoascorbic acid. The method provides reliable and precise results characterised by a high level of agreement with the chromatographic reference method. The use of differential pulse polarography shows that this method is equivalent to high-performance liquid chromatography with diode-array detection in terms of analytical parameters, allowing easier and faster determination of ascorbic acid. The polarographic
Acta Alimentaria 47, 2018
method is more suitable for routine analyses, owing to shorter time and simplicity of the analysis. BALOGH and SZARKA (2016) compared four methods for determination of ascorbic acid and indicated that because of the high throughput of the assays, the 2,2’-bipyridyl method based on a plate reader seems to be the most suitable method for ascorbic acid analysis in small or middle sized food analytic laboratories. The use of autosampler for fully automatic polarographic determination of ascorbic acid also allows obtaining high throughput of the assays, however, the polarographic method is more selective than the 2,2’-bipyridyl method.
References
AOAC (2012): Appendix F: Guidelines for standard method performance requirements. Offi cial Methods of Analysis of AOAC International, 19th ed., AOAC International, Gaithersburg, MD, USA.
BALOGH, T. & SZARKA, A. (2016): A comparative study: Methods for the determination of ascorbic acid in small and middle sized food analytic laboratories. Acta Alimentaria, 45, 354–362.
BRANCA, P. (1980): Sulla determinazione polarografi ca dell’acido ascorbico. (Determination of ascorbic acid by polarography). Boll. Chim. Lab. Prov., 6(92), 143–152.
CHERDKIATGUMCHAI, P. & GRANT, D.R. (1987): Note: The determination of ascorbic acid in wheat fl our suspension by differential pulse polarography. Cereal Chem., 64, 288–290.
CRASTON, D.H., JONES, C.P., WILLIAMS, D.E. & EL MURR, N. (1991): Microband electrodes fabricated by screen printing processes: Applications in electroanalysis. Talanta, 38(1), 17–26.
ESTEVE, M.J., FARRÉ, R. & FRÍGOLA, A. (1995a): Determination of ascorbic acid in asparagus by differential pulse polarography. Fresen. J. Anal. Chem., 351, 804–805.
ESTEVE, M.J., FARRE, R., FRIGOLA, A., LOPEZ, J.C., ROMERA, J.M., RAMIREZ, M. & GIL, A. (1995b): Comparison of voltammetric and high performance liquid chromatographic methods for ascorbic acid determination in infant formulas. Food Chem., 52, 99–102.
GERHARDT, U. & WINDERMIILLER, R. (1981): Die polarographie Bestimmung der Ascorbinsaure in Gewurzen.
Fleischwirtschaft, 61, 1389–1392.
ISSA, R.M., ABDEL-GAWAD, F.M., ALY, F.A. & EL-SHINAWI, A.M. (1984): Polarographic studies of vitamin C in buffer solutions of varying pH at the DME. Its determination in some pharmaceutical products and biological systems. J. Drug Res., 15, 133–141.
KONIECZKA, P. & NAMIEŚNIK, J. (2009): Quality assurance and quality control in the analytical chemical laboratory.
A practical approach. Boca Raton: CRC Press/Taylor and Francis. 232 pages.
MANGLANO, P., FARRÉ, R., LAGARDA, M.J., ABELLÁN, P., ROMERO, F. & CLEMENTE, G. (2004): Stability of ascorbic acid in adapted milk-based infant formulae during storage. J. Sci. Food Agr., 84, 1126–1130.
MAZUREK, A. & JAMROZ, J. (2015): Precision of dehydroascorbic acid quantitation with the use of the subtraction method – Validation of HPLC-DAD method for determination of total vitamin C in food. Food Chem., 173, 543–550.
NOVAKOVA, L., SOLICH, P. & SOLICHOVA, D. (2008): HPLC methods for simultaneous determination of ascorbic and dehydroascorbic acids. TrAC – Trend. Anal. Chem., 27, 942–958.
ZEMPLENI, J., RUCKER, R.B., MCCORMICK, D.B. & SUTTIE, J.W. (2007): Handbook of vitamins. 4th ed. CRC Press/
Taylor and Francis, Boca Raton. 618 pages.
ZULUETA, A., ESTEVE, M.J. & FRIGOLA, A. (2010): Ascorbic acid in orange juice-milk beverage treated by high intensity pulsed electric fi elds and its stability during storage. Innov. Food Sci. Emerg., 11(1), 84–90.