AN INTEGRATING STUDY OF GENETIC DIVERSITY AND ECOLOGICAL NICHE MODELLING
IN SALVIA ARISTATA (LAMIACEAE)
F. Moein1, Z. Jamzad2 and M. Rahiminejad1*
1Department of Biology, Faculty of Science, University of Isfahan, Iran E-mails: fatemeh.moein@gmail.com, *mrr@sci.ui.ac.ir, *mrrsci@gmail.com
2Department of Botany, Research Institute of Forest and Rangelands, Tehran, Iran E-mail: jamzad@rifr-ac.ir
(Received 24 January, 2018; Accepted 22 August, 2018)
Applying both molecular data and ecological niche modelling is essential to infer the spe- ciation mechanism and species delimitation in organisms. Salvia aristata Auch. ex Benth is an endemic species restricted to western, northwestern and centre of Iran and eastern parts of Turkey with variations in morphological character along its distributions. In this study, we applied SRAP marker and ecological niche modelling using climatic and geo- graphic data to detect and examine the genetic structure and niche differentiation in S.
aristata accessions. SRAP marker’s results showed 242 bands highly polymorph. Genetic distance analysis provided two main clusters. The STRUCTURE analysis provided two distinct ecotypes (K = 2). Our ecological niche model produced good results with high performance based on area under curve (AUC > 0.9) for both ecotypes. Altitude was the most important variable contributing in niche model of both ecotypes. The niche space of both ecotypes is different based on niche identity test and background test as well. Based on genetic and ecological evidence, it is concluded that S. aristata gene pool underwent a parapatric speciation process caused by niche divergence and reproductive isolations as a consequence of divergent selection on floral traits.
Key words: ecological niche modelling (ENM), genetic structure, Salvia
INTRODUCTION
Generally, a species is considered as the fundamental unit in almost all biological fields such as systematic, ecology and conservation biology (De Queiroz 2007). Identifying the accurate boundaries of a species is critical to have a better perspective of any biological studies. Therefore, species delimi- tation is a subject of extensive part of studies in the framework of biology (Rissler and Apodaca 2007, Rivera et al. 2011, Zheng et al. 2017). However, defining the criterion which could address the boundaries of species is differ- ent and the place of debates (Levin 2000). Integrating morphological, genetic and ecological criteria proved to be helpful not only for resolving taxonomic confusions (De Queiroz 2007, DeSalle et al. 2005, Fujita et al. 2012), but also is mainly useful for interpreting the concurrent geographical patterns of pheno-
typic and genotypic variations on special adaptive traits (Levin 2000, Richard- son and Urban 2013).
To examine the veracity of species limits based on genetic data, different PCR based methods such as AFLP (amplified fragment length polymorphism), RAPD (random amplified polymorphism DNA) and ISSR (inter simple se- quence repeat) are applied (Nguyen and Wu 2005, Penner et al. 1993, Vos et al.
1995). Although these methods produce useful data, they have some technical limitations. For instance, reproducibility of RAPD data is poor, AFLP method is expensive and ISSR could not produce enough polymorphic fragments in some plant groups (Robarts and Wolfe 2014). Sequence-related amplified pol- ymorphism (SRAP) is a marker which amplifies open reading frames (ORFs) with specific forward and reverse primers. Compared with the other dominant markers, simplicity, reproducibility, cost effectiveness and high throughput of SRAP make it more applicable in the genomic studies (Chang et al. 2012, Li and Quiros 2001, Li et al. 2015, Robarts and Wolfe 2014). According to the previous studies, SRAP marker is very successful for detecting inter- and intra-popu- lation genetic variations (Erbano et al. 2015, Robarts and Wolfe 2014, Talebi et al. 2015). Not only integrating morphological information with genetic data is a powerful tool in interpretation of speciation trends, adaptive radiation and many other evolutionary aspects is helpful for evaluation of lower levels of systematic classification among organisms displaying non-powerful diagnos- tic morphological characters and endemism patterns.
The integration of ecological niche modelling with genetic data can re- veal the influence of abiotic factors (precipitation, temperature and seasonal- ity) on the processes involved in genetic structuring of organisms (Alvarado- Serrano and Knowles 2014, Knowles et al. 2007, Rissler and Apodaca 2007).
Ecological niche modelling (ENM; also referred to as species distribution modelling [SDM]) uses species occurrence records in the form of GIS coor- dinates in combination with environmental variables (climatic or geospatial) to determine quantitatively the potential area of a species’ or population’s distributions (Kozak et al. 2008, Marchant et al. 2016, Raxworthy et al. 2007, Zhang et al. 2014). Different approaches and algorithms have been developed to predict species distributions (BIOCLIM: Busby 1991; GARP: Stockwell 1999; MAXENT: Phillips et al. 2006; BIOMOD: Thuiller et al. 2009). These tools are different in implemented method, treating occurrence records (presence- only or presence/absence) and the ability to generating continuous or discrete predictions of habitat suitability. Specific research aims and the domain of any given study determines which methods are most appropriate (Alvarado- Serrano and Knowles 2014).
ENM methods have not only been applied broadly to evaluate the ef- fect of climate change on species distribution (Guisian and Thuiller 2005), but another frequent use has been in the context of species delimitation (Anacker
and Strauss 2014, Pelletier et al. 2015, Reeves and Richards 2011, Zheng et al.
2017). ENMs have been successfully been integrated with genetic data to test whether the niches of putative populations or species are similar or differ- ent. Where niche divergence coincides with the incomplete separation of spe- cies or populations (i.e. divergence with some degree of gene flow) and with divergent selection on reproductive morphological traits, different stages of divergence among the populations or species (ecotypes, subspecies and new specie) through the time will be expected (Nosil and Sandoval 2008, Rundle and Nosil 2005).
Salvia L. is known as the largest genus in Lamiaceae (Mentheae-Salvii- nae) with approximately 1000 species diversified in three regions of the world:
Central and South America (500 spp.), Western Asia (200 spp.) and Eastern Asia (100 species) (Walker et al. 2004). Iran having 19 endemic species out of 61 is regarded as one of the important regions for Salvia diversity in Southwest Asia (Jamzad 2012).
S. aristata Auch. ex Benth. as the subject of this study is a perennial plant, 30–60 cm high, covered with short glandular and eglandular villose hairs; ca- lyx campanulate with three upper teeth (median tooth is reduced in some pop- ulations). This plant is an endemic species restricted to West, Northwest and Centre of Iran (Jamzad 2012) and East of Turkey (Behçet and Avlamaz 2009).
During our field work and herbarium studies, we realised that there is a significant variation regarding both vegetative and reproductive characters in S. aristata forming different morphological variants (Jamzad 2012). Leaf blade varies from sub entire to imparipinnate with variation in leaflets’ dimensions among the accessions examined. In flowers, presence or absence of traits such as annulus within the corolla tube, middle tooth in upper calyx were observed as well. In addition, the length of the calyx and pedicle ranges from 20–35 and 18–25 mm, respectively. Since S. aristata was first published (Bentham 1848), a long list of synonyms (S. sulcata Parsa, S. owerini Trautv. S. aristata var. viscida Bornm., Polakia paradoxa Stapf, S. anisodonta Hausskn. et Briq. ex Hausskn, S.
garrousii Parsa, S. pinnatifolia Parsa) were known under this species (Hedge 1982, Jamzad 2012). This is a clear reflection of the morphological variations encountered within the domain of S. aristata. These taxonomic confusions and morphological variations motivated us to investigate the influence of genetic composition and ecological influences on these morphological variations.
This study is focused on the integration of the ecological niche modelling and genetic structure data to evaluate the influence of genetics and ecology on S. aristata phenotypic variations and inferring the mechanism of speciation involved in. To the best of our knowledge, this is the first study of investigat- ing the influence of genetic data and ecology on phenotypic variation in south western Asian Salvia.
MATERIALS AND METHODS
A total of 25 specimens of S. aristata collected from 1987 to 2009 kept in TARI herbarium were used in this study (Table 1). Since the natural popu- lations are normally formed from a few and scattered individuals our sam- pling was limited to only one accession from each locality. Consequently, we mostly focused on the genetic structure of S. aristata accessions rather than estimating population genetic parameters. The necessity of having a general grouping before any genetic analysis made us to divide the accessions under study into four geographical groups with no taxonomic sense (i.e. Esfahan, Qazvin, Azerbaijan and Kurdistan).
Total DNA was extracted using dried leaf material based on a modified CTAB method (Doyle and Doyle 1987). To prevent the effect of and the break- ing down the secondary metabolites, CTAB and dried leaf solution was kept for 24 hours at room temperature. DNA extracts were dissolved in 70 µl deionised water. A total number of 16 combinations from 6 pairs (Table 2) of SRAP prim- ers (Li et al. 2015) were examined. PCR amplification was carried out in a vol- ume of 25 µl, containing 10.5 µl deionised water, 12.5 µl of Taq DNA polymer- ase r master mix Red (Amplicon, Cat. no. 180301), 0.5 µl (10 p mol / ml) of each of the primers and 1 µl (50 ng / µl) of template DNA. Polymerase chain reaction was based on (Li and Quiros 2001) as: initial denaturation at 94 °C for 4 min fol- lowed by five cycles including 1 min at 94 °C denaturation, 1 min annealing at 35 °C and 1 min of elongation at 72 °C. Following 35 cycles as: denaturation at 94 °C for 1 min, annealing at 55 °C for 1 min and elongation at 72 °C for 1 min with final extension for 1 min at 72 °C was carried out. The PCR products were ran on an electrophoresis gel of 1.5% agarose containing ethidium bromide.
Data analyses
Eleven primer combinations of SRAP primers were selected according to their ability to produce clear and polymorphic bands among accessions (Table 3). All the clear bands were scored as 1 for presence, 0 for absence and the faint bands were treated as missing data. The polymorphic information content (PIC) was used to evaluate the ability of SRAP markers in the assess- ment of inter accession genetic diversity of S. aristata as follows:
where fi is the frequency of the present marker fragments (Li et al. 2015).
Table 1
Localities of Salvia aristata specimens used for DNA extraction in this study. The letters (a
& b) are for subscript indicating the relevant groups in the STRUCTURE analysis Acces-
sions no.
Geographical
coordinate Origin Geographical re-
gions grouping lat. long.
Sa-01a 33.17° 50.18° Esfahan: Tiran to Damaneh, Tange kol-
ang, 2500 m, 12495 TARI Esfahan
Sa-02a 32.05° 51.47° Esfahan: Ghameshlou, Sanjab pass
(Halaj), 2230 m, 90369 TARI Esfahan
Sa-03a 33.07° 50.45° Esfahan: Khansar: Darre bid, 2700 m,
13607 TARI Esfahan
Sa-04a 32.05° 51.47° Esfahan: Ghameshlou protected area,
2350 m, 1118 TARI Esfahan
Sa-05a 33.21° 50.21° Esfahan: Faridan, Daran, Tarrar, 2450 m,
13266 TARI Esfahan
Sa-06a 32.05° 51.47° Esfahan: Ghameshlou, Sanjab, 2200 m,
90328 TARI Esfahan
Sa-07a 32.05° 51.47° Esfahan: Ghameshlou, protected area,
Tange darposht, 2200 m, 1203 TARI Esfahan Sa-08a 32.89° 50.07° Esfahan: Fereydunshahr, near the vil-
lage Sibak, 2900 m, 76486 TARI Esfahan Sa-09a 32.89° 50.07° Esfahan: Fereydunshahr, Sibak, 2670 m,
90331 TARI Esfahan
Sa-10a 32.05° 51.47° Esfahan: Ghameshlou, Sanjab, 90336
TARI Esfahan
Sa-11a 32.05° 51.47° Esfahan: Ghameshlou, Gardaneh ka-
hurak Esfahan
Sa-12a 32.94° 50.09° Esfahan: Fereydunshahr, 12691/23, 2500
m TARI Esfahan
Sa13a 33.42° 49.29° Lorestan, Oshtorankuh, above Tihun
village, 37072/24, 2000–2500 m TARI Esfahan Sa-14a 35.57° 49.21° Ghazvin to Hamedan just after Avaj,
2100 m, 36689 TARI Ghazvin
Sa-15b 36.42° 50.03° Ghazvin: Aloak to Esbzad, 2120 m,
90329 TARI Ghazvin
Sa-16a 34.89° 49.26° Arak: Komayjan, Pass of Chehregan vil-
lage, the margin road, 2350 m, 501 TARI Ghazvin Sa-17b 37.35° 45.15° Azerbaijan: Darre Ghameshlou Azerbaijan Sa-18b 37.68° 48.47° Azerbaijan: 78 km from Mianeh to
Khalkhal, 1500 m, 56889 TARI Azerbaijan
Genetic relationships and structure
To estimate the genetic distance among S. aristata specimens, we calculat- ed Euclidean genetic distance applying agglomerative (hierarchical) clustering using Ward’s variance minimisation algorithm implemented in scipy python package. In addition, a model based computation using Bayesian method im- plemented in SRUCTURE software (Pritchard et al. 2000) was performed. For input data, all samples are grouped into four geographical regions (Table 1) as a priori grouping knowledge for STRUCTURE analysis. The analysis was done under admixture ancestor and correlated allele frequency model. In each run
Table 1 (continued) Acces-
sions no.
Geographical
coordinate Origin Geographical re-
gions grouping lat. long.
Sa-19b 38.37° 45.47° Azerbaijan: from Tabriz to Marand after
Soufian, 1500 m Azerbaijan
Sa-20b 37.59° 48.22° Azerbaijan: 35 km from Kivi, Firou-
zabad, 1180–1350 m, 34230 TARI Azerbaijan Sa-21b 37.67° 48.47° Azerbaijan: 14 km from Khalkhal to
Kivi, Anavis, village, 1680 m, 34149 TARI.
Azerbaijan
Sa-22b 37.35° 45.15° Azerbaijan: Darreh Ghasemlou Azerbaijan Sa-23b 35.14° 47.10° Kurdistan: Sanandaj, Narran village,
1850 m, 72 Kurdistan
Sa-24b 35.14° 47.10° Kurdistan: 25 km from Sanandaj, moun- tain above Narran village, 1850–2600 m, 60235 (TARI).
Kurdistan
Sa-25b 36.38° 46.04° Kurdistan: Saghez, Zanbill village,
1300–1360 m, 5103 (TARI). Kurdistan
Table 2
Forwarded and reversed primers sequences using in this study for SRAP marker
Forwarded primers Reversed primers
Me2 5’-TGAGTCCAAACCGGAGC-3’ Em1 5’-GACTGCGTACGAATTAAT-3’
Me5 5’-TGAGTCCAAACCGGAAG-3’ Em2 5’-GACTGCGTACGAATTTGC-3’
Me1 5’-TGAGTCCAAACCGGAAT-3’ Em3 5’-GACTGCGTACGAATTGAC-3’
Me3 5’-TGAGTCCAAACCGGACC-3’ Em4 5’-GACTGCGTACGAATTTGA-3’
Me4 5’-TGAGTCCAAACCGGACC-3’ Em6 5’-GACTGCGTACGAATTGCA-3’
Me2 5’-TGAGTCCAAACCGGAGC-3’ Em17 5’-GACTGCGTACGAATTCCA-3’
50,000 Markov Chain Monte Carlo was simulated with 5000 burn in. Number of groups (K) was assumed from 1 to 8 and 20 independent runs were per- formed for each K value. The output of structure was analysed by Harvester (Earl and vonHoldt 2012). To determine the number of real clusters (K), per the
∆K CLUMPP software (Jakobsson and Rosenberg 2007) was used to find out the optimum alignment of replication in clustering analysis by STRUCTURE result. The output was visualised by Distruct (Rosenberg 2004).
Ecological niche modelling
Ecological niche modelling was applied to evaluate the degree of ecologi- cal divergence between the genetic clusters generated in S. aristata where K = 2.
All 25 accessions were assigned to putative lineages in group A (mostly central area of Iran) and group B (mostly western and northwestern area of Iran). Since group B had one genealogical clustering in STRUCTURE analyses, to provide additional points 11 more records (Hedge 1982) from northwestern part of Iran were georeferenced and were assigned to group B. Furthermore, due to the similarity between the climate conditions of the locality of S. aristata in Turkey (Van: Baskale district) with that of the area around Iranian Urmia Lake in north- western (Tali et al. 2013), the recent report of this species from Turkey (Behçet and Avlamaz 2009) was assigned to the putative lineage of group B. We used 14 occurrence points for group A and 23 occurrence point for group B.
A total of 19 bioclimatic variables along with altitude were downloaded from WorldClim database V. 1.4 and 2 (http://www.worldclim.org, Hijmans et al. 2005, Fick and Hijmans 2017). We performed ecological niche modelling to predict the potential distribution of S. aristata at present (1970–2000) and the last glacial maximum (LGM; ~22 Kya). For bioclimatic along with altitudinal layers, 2.5 arc-minute resolution was used for both building the model and projection into the present and LGM. Bioclim variables were extracted and cropped to the extent of Iran and Turkey (which contain all known occurrenc- es for S. aristata). To avoid model over-fit, we reduced variables for modelling by taking only one variable for each pairwise comparison where the Pearson’s correlation was at least 0.8. Seven Bioclim layers along with altitude were re- tained for modelling: Bio3 (isothermality), Bio4 (temperature seasonality), Bio7 (temperature annual range), Bio8 (mean temperature of wettest quarter), Bio12 (annual precipitation), and Bio18 (precipitation of warmest quarter). All analyses were carried out in R (R CoreTeam 2015) using the packages raster (Hijmans and Van Etten 2012) and rgdal (Bivand et al. 2014).
We generated ENMs for putative taxa in S. aristata using the maximum entropy algorithm implemented in Maxent v.3.3 (Phillips et al. 2006). Previous studies showed that Maxent performs well in comparison to other methods for relatively small occurrence record sample sizes (Baldwin 2009, Vroh et al.
2016), an important property for modelling narrow endemics. To generate models, we used 75% of occurrence point for testing and 25% for training with 5,000 iterations. The number of background points was set to 10,000. The con- vergence threshold of 0.00001 was applied and the output format was set to be logistic. Cross-validation replicated runs were used due to better performance for small data in comparison with bootstrap and sub-sampling methods (Phil- lips et al. 2006). To evaluate the model, the area under the receiver operating characteristic (ROC) curve (AUC) was estimated. AUC measures the ability of a model to discriminate between the present size and absent size by taking the random sample from the population (Phillips et al. 2006). We performed a Jack-knife test to assess the importance of each environmental variable in our modelling. The output models of Maxent were created using QGIS 2.18.0 (QGIS 2015). To evaluate the niche overlap among group A and group B of S.
aristata, we used Schoener’s D (Schoener and Schoener 2015) and Hellinger’s- based I (Warren et al. 2008) in R (R Core Team 2015) using package ENMTools 1.4.4 (Warren et al. 2010). Both D and I range between 0 (complete lack of niche overlap) and 1 (identical niches). Niche identity tests were performed with 100 replicates to determine whether any observed niche differences between the two putative ecotypes of S. aristata were significant, under a null hypothe- sis assuming no niche differentiation among putative species. In addition, we ran background test with 100 pseudo-replicates to evaluate whether ENMs were more similar than expected by chance, in case that species or individuals choose a random point from their geographic area.
RESULTS Molecular observations
Using 11/16 SRAP primer combinations a total of 242 scorable bands ranging in size from 120 to 1700 bp were produced. Our results showed that 98.33% of the amplified loci were polymorphic. The minimum (16) and maxi- mum (27) bands were scored for Me2-Em1 and Me3-Em1, respectively (Table 3). The polymorphic information content (PIC) values ranged from 0.39 to 0.49 with an average of 0.42. The highest and lowest PIC values were obtained for Me4Me2 and Me5Me4 combinations, respectively. The higher PIC is an indi- cator of the ability of primer combination to detect the allelic polymorphisms.
Genetic relationships and structure results
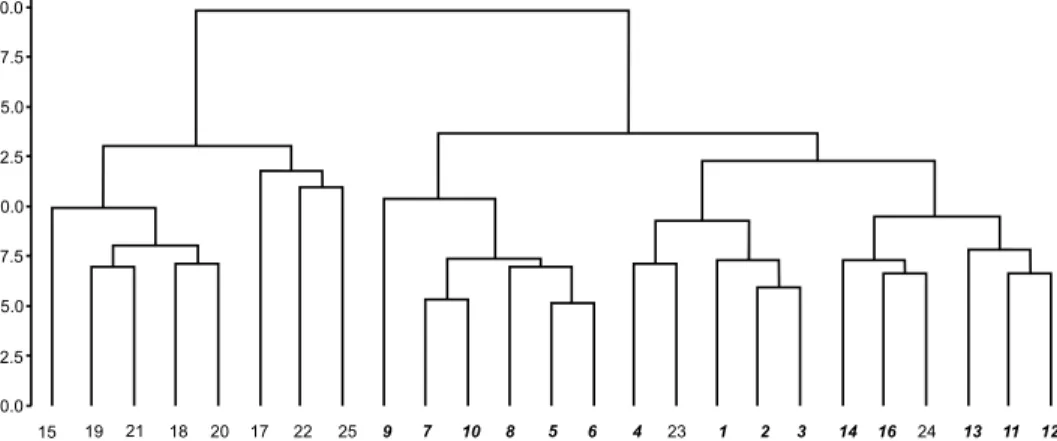
Genetic distance results showed that our accessions are grouped into two main clusters with two and three sub-clusters in each (Fig. 1). Cluster Ι com- prises most of Esfahan’s accessions along with two individuals from Kurd-
istan (Sa-24 and Sa-23) and two individuals from Qazvin (Sa-14 and Sa-16).
Cluster II includes most of Azerbaijan’s populations with one individual from Qazvin (Sa-15). STRUCTURE analysis revealed that the ∆K (Fig. 2) reaches the greatest value when the K = 2; it implies that S. aristata accessions are assigned to two different genetic ecotypes (groups A and B illustrated in Fig. 3).
Table 3
Total number of produced band, polymorphic bands, polymorphism percentage and polymorphic information criterion (PIC) obtained from 11 SRAP primer combinations Primer
combination Produced
band Polymorphic
band Polymor-
phism% PIC
Me3em3 18 17 94.4 0.46
Me3em1 24 24 100 0.47
Me5em6 19 18 94.7 0.40
Me4em2 22 22 100 0.49
Me3em2 20 19 95 0.29
Me4em1 19 19 100 0.40
Me3em4 24 21 87.5 0.39
Me2em17 17 16 94 0.46
Me1em2 26 26 100 0.46
Me5em1 26 26 100 0.36
Me4em3 27 27 100 0.47
Total/Average T: 242 T: 235 AVG: 96.87 AVG: 0.42
15 19 21 18 20 17 22 25 9 7 10 8 5 6 4 23 1 2 3 14 16 24 13 11 12
20.0
17.5
15.0
12.5
10.0
7.5
5.0
2.5
0.0
Fig. 1. The dendrogram is based on the genetic distance of S. aristata accessions using 11 primer combinations of SRAP marker. The bold italic locality numbers show the clusters of Groups A, regular locality numbers stand for the clusters of Groups B (in accordance
with structure analysis)
Ecological niche modelling
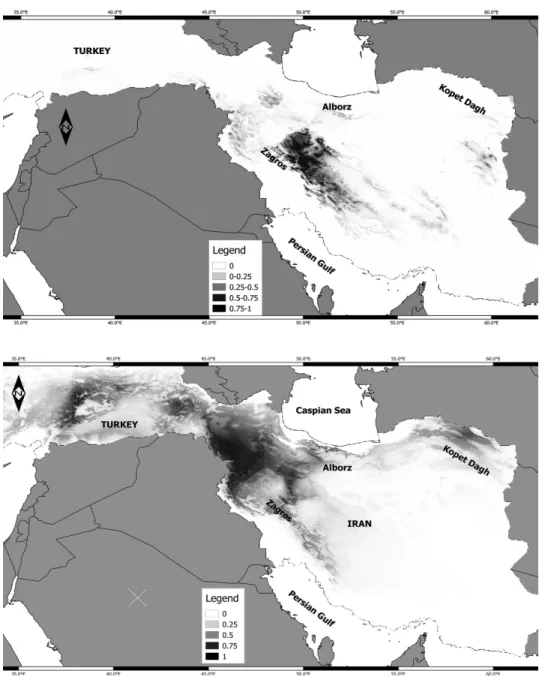
The predicted distribu- tion of the two ecotypes at present, during LGM (last glacial maximum) is shown in Figures 4 and 5, respective- ly. The AUC scores for group A was 0.94 and for group B was 0.96. The AUC scores showed that the model has a good fit for individuals. Our model predicted a patchily potential suitable area for S.aristata accessions. The re- sults suggested that Kopet Dagh Mts and a narrow part Fig. 2. The correlation of K and ∆K obtained from
Har vester analysis to determine the best K of struc- ture analysis
Fig. 3. STRUCTURE analysis showing delimitation of S. aristata accessions into two ecotypes. Vertical lines shows individuals within ecotypes. From left to right individuals
are arranged from Sa-1 to Sa-25 (for details see Table 1) Table 4
Level contribution of each bioclim variable in present niche model generated by Maxent for group A and group B based on Jacknife test
Description of variable Group A% Group B%
Bio3 Isothermality 13.3 16.7
Bio4 Temperature seasonality 0.3 5.8
Bio7 Temperature annual range 14.5 0.5
Bio8 Mean temperature of wettest quarter 56.7 1.3
Bio12 Annual precipitation 3.4 32.3
Bio18 Precipitation of warmest quarter test 13.3 11.7
Fig. 4. Potential current of occurrence for S. aristata in Group A (top) and Group B (bottom) generated by Maxent. Rang of suitable areas are shown in colour. Higher value indicates
of more suitable area for S. aristata
of Alborz Mountains in Northeast of Iran are potentially suitable areas for S.
aristata occurrence (Fig. 4). Although no S. aristata specimen is recorded from Kopet Dagh Mts so far, this area is potentially suitable habitat for occurrence
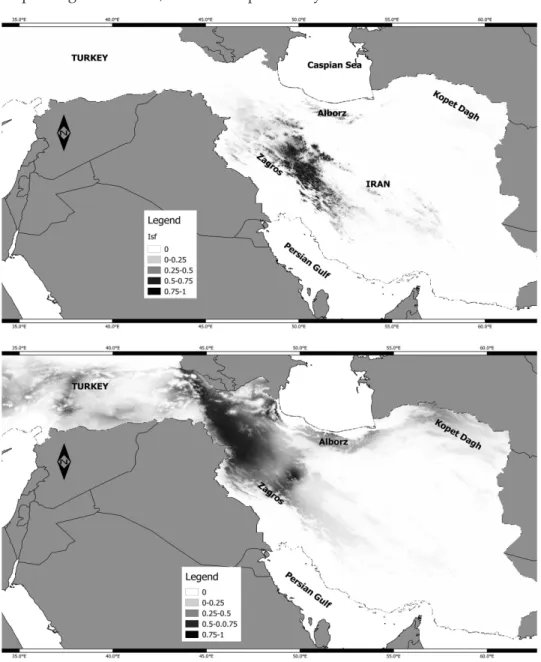
Fig. 5. Past distribution (last glacial maximum ~22 kya) of occurrence for S. aristata in Group A (top) and Group B (bottom) generated by Maxent. Rang of suitable areas are shown in
colour. Higher value indicates of more suitable area for S. aristata
of this species based on niche model generated by Maxent for group A. The Jack-knife test of Maxent analysis showed that altitude and mean temperature of the wettest quarter are the two highly contributing variables for group A. In addition, altitude and annual precipitation are the most contributing factors in niche model for group B (Table 4). While Schoner’s D and Hellinger’s-based I can range from 0 (no niche overlap) to 1 (identical niches), the estimated niche overlap of the groups A and B produced Schoner’s D = 0.21 and Hellinger’s- based I = 0.44 (Fig. 6). Niche identity test showed that the observed value for D and I are significant because the observed overlap falls outside of 95 percent confidence. Therefore, the null hypothesis of similar niches was rejected and different niches for group A and group B are accepted (Fig. 6A). The domain background test (Fig. 6B) with 100 pseudo-replicates rejected the null hypoth- esis of similar niches as well. We also estimated the raster niche overlap of last glacial maximum to be 0.53, which shows greater than the present raster overlap to be 0.44. Higher niche overlap indicates no functional barrier of gene flow between two ecotypes in the past.
DISCUSSION Genetic variability
In accordance with the recent studies (Robarts and Wolfe 2014, Talebi et al. 2015), our results showed that SRAP marker is a robust tool to show genetic variations among accessions so that 97.11% of the loci were polymorphic. PIC (polymorphic information content), which refers to the value of a marker for
Fig. 6. Niche overlap value D (Schoener’s) and I (Hellinger’s-based). Left: Niche identity test. Right: Background similarity test. The X axis shows the value of D and I and the Y axis indicates number of pseudo-replicates. The dotted lines are the observed overlap for real data. The observed overlap falls outside the 95% CI null distribution that means the null
hypothesis of similar niches are rejected
A B
detecting polymorphism could be classified into three groups. In the case of PIC > 0.5, 0.25 < PIC < 0.5 and PIC < 0.25 the value for that marker is high, medium and low, respectively (Liu and Cordes 2004). Eleven primer combi- nations of SRAP marker (Table 2) used in the present study having an average of PIC = 0.42 showed that SRAP marker could provide useful data to assess genetic variation in S. aristata accessions. Here, Me4em2 with a PIC of 0.49 among the others was the most informative primer combination.
Species delimitation and mode of speciation
Based on the genetic distance dendrogram illustrated in Figure 2, S.
aristata accessions are grouped into two main clusters (groups A and B) with three and two subclusters in each, respectively. The above grouping is also consistent with the structure clustering by detecting two main putative ge- netic lineages (Fig. 3). Reeves and Richards (2011) pointed out that in the case of incomplete sampling, evidence in favour of niche divergence or reproduc- tive isolation is essential rather than just focusing on genetic data. To make conclusion about the population’s behaviour in S. aristata and due to our in- sufficient sampling, we used ecological niche modelling method to examine niche divergence between these two ecotypes as well.
Nosil and Sandoval (2008) reported the role of niche divergence in stick insects (Timema) as a key factor in ecological speciation process through local adaptation even in the presence of gene flow. Elias et al. (2012), Khimoun et al. (2013) and Nosil et al. (2009), also expressed that ecological divergence and its contributing role in speciation is more prominent when characters related to gene flow such as pollinators, phenological properties and reproductive characters are diverged among populations. The results of structure cluster- ing (Fig. 3) are consistent with the variation encountered in some phenotypic floral traits. The accessions Sa-15, Sa-18, Sa-19, Sa-20 and Sa-21, belonging to group B (lacking the middle tooth in the upper lip of the calyx) form a dis- tinct ecotype, while the remaining having the middle tooth stand as a differ- ent ecotype. However, those with a mix genetic composition of both ecotypes (Fig. 3) showed middle tooth in the same length or smaller than the two ecotypes. The consistency between the phenotypic variability and the clusters of structure analysis can be taken as evidence to confirm a current divergence between the two ecotypes.
As a general rule, insects are the pollinators of Salvia in Old World (Cla- ßen-Bockhoff et al. 2004). At the lower elevations, bees and at the higher alti- tudes insects like flies are the dominate pollinators among bilabiate flowers such as Salvia (Pellissier et al. 2010). Based on the Maxent results of this study, altitude appeared as an important factor contributing to the niche model of
groups A and B, while all the accessions belonging to group A are occurring at the altitudes between 2000 to 2900 m, the accessions of group B are growing from 1180 to 2100 m. Therefore, it can be inferred that phenotypic variants of the calyx teeth could be considered as a pollinator-mediated adaptive diver- gence. To conclude, if we assume that this pattern of phenotypic divergence is somehow directed by both quantity and quality of the pollinators involved, it can be suggested that S. aristata is at a degree of speciation; providing the pres- ence of a progressing divergence accompanied with the reproductive isolation, the originating of varieties, subspecies and new species can be expected.
Although the general evolutionary mechanism of all species passes through the origin, expansion and demise, however each of them has their own exclusive pathway (Levin 2000). Traditionally, the mode of specifications is clas- sified into three categories: sympatric, allopatric and parapatric (Coyne and Orr 1998, Lowe et al. 2004). Allopatric mode depends on the geographical barriers and lack of gene flow. Sympatric (complete area overlap) and parapatric modes (partial area overlap) with no extrinsic barrier are controlled by the intrinsic genomic barriers (e.g. polyploidy and hybridisation) and show a decreasing gene flow as function of progressing speciation (Butlin et al. 2008, Feder et al.
2012, Zheng et al. 2017). The genetic structure of SRAP marker showed that despite the presence of a limited gene flow, two distinct ecotypes were formed which may be the consequences of reproductive isolation caused by altitude gradient and different niches through parapatric speciation.
In addition, the results of ecological niche modelling (Figs 4 and 5) showed that the niche overlap of the two ecotypes in last glacial maximum model was higher than the present model. It can be taken as evidence for the absence of a geographical barrier for conducting an allopatric speciation be- tween these two ecotypes in the past (Fig. 5).
Based on the all ecological and genetic line evidence generated in this study, it can be suggested that the parapatric mode is the most likely mecha- nism involved in S. aristata speciation.
CONCLUSIONS
Based on the genetic data and niche model results of this study it can concluded that the endemic gene pool of S. aristata is currently undergoing a dynamic speciation process in which central (group A) and northwestern (group B) accessions are diverging from each other. The distribution of mor- phological traits (absence/presence of middle calyx teeth) among the acces- sions revealed two distinct ecotypes and a mixture of phenotypic and genetic individuals. Although some individuals by presence or absence of middle calyx tooth formed distinctive ecotypes, still some individuals showed an in-
termediate phenotype by presence of gene flow and traits with each of the two ecotypes. In the case of selection on reproductive system supported by ecological factors, complete divergence of individuals can be predicted. In term of taxonomic conclusion, we need to consider both the morphological variability and nomenclature problems in this species. But before arranging a taxonomic revision for S. aristata, we prefer to examine other relevant mo- lecular markers and data. In this respect, collecting materials from the type localities of other closely related species to S. aristata (mostly known as syno- nyms) is essential to provide enough informative molecular data to solve the taxonomic confusions.
*
Acknowledgements – We are grateful to the staff of TARI Herbarium for their help and co- operation. Also, we would like to thank Dr Dan Warren for his helpful comments on niche modelling and niche overlap results. We also thank Dr Ryan Folk for reviewing part of the manuscript. This study was carried out by the financial support of the University of Isfahan.
REFERENCES
Alvarado-Serrano, D. F. and Knowles, K. (2014): Ecological niche models in phylogeo- graphic studies: applications, advances and precautions. – Mol. Ecol. Res. 14: 233–248.
https://doi.org/10.1111/1755-0998.12184
Anacker, B. L. and Strauss, S. Y. (2014): The geography and ecology of plant specia- tion: range overlap and niche divergence in sister species. – Proc. R. Soc. B Biol. Sci.
281(1778): 20132980. https://doi.org/10.1098/rspb.2013.2980
Baldwin, R. A. (2009): Use of maximum entropy modeling in wildlife research. – Entropy 11(4): 854–866. https://doi.org/10.3390/e11040854
Behçet, L. and Avlamaz, D. (2009): A new record for Turkey: Salvia aristata Aucher ex Benth. (Lamiaceae). – Turk. J. Bot. 33(1): 61–63. https://doi.org/10.3906/bot-0808-14 Bentham, G. (1848): Labiatae. – In: de Candolle, A. (ed.): Prodromus. Vol. 12. 1st ed. Paris,
France: Treuttel and Würtz, pp. 262–358.
Bivand, R., Keitt, T. and Rowlingson, B. (2014): Rgdal: bindings for the geospatial data abstrac- tion library. R Package Version 0.9-1. – http://CRAN.R-project.org/package=rgdal.
Busby, J. R. (1991): A bioclimatic analysis and prediction system. – In: Margules, C. R. and Austin, M. P. (eds): Nature conservation: cost effective biological surveys and data analysis. CSIRO, Sydney, New South Wales, pp. 64–68.
Butlin, R. K., Galindo, J., Grahame, J. W. and Sheffield, S. (2008): Sympatric, parapatric or allopatric: the most important way to classify speciation? – Trans. R. Soc. Land. B. 363:
2997–3007. https://doi.org/10.1098/rstb.2008.0076
Chang, D., Yang, F. Y., Yan, J. J., Wu, Y. Q., Bai, S. Q., Liang, X. Z. and Gan, Y. M. (2012):
SRAP analysis of genetic diversity of nine native populations of wild sugarcane, Saccharum spontaneum, from Sichuan, China. – Genet. Mol. Res. 11(2): 1245–1253.
https://doi.org/10.4238/2012.May.9.3\rgmr1521 [pii]
Claßen-Bockhoff, R., Speck, T., Tweraser, E., Wester, P., Thimm, S. and Reith, M. (2004):
The staminal lever mechanism in Salvia L. (Lamiaceae): a key innovation for adaptive radiation? – Org. Divers. Evol. 4(3): 189–205. https://doi.org/10.1016/j.ode.2004.01.004 Coyne, J. A. and Orr, H. A. (1998): The evolutionary genetics of speciation. – Phil. Trans. R.
Soc. Land. B. 353: 287–305.
De Queiroz, K. (2007): Species concepts and species delimitation. – Syst. Biol. 56(6): 879–
886. https://doi.org/10.1080/10635150701701083
DeSalle, R., Egan, M. G. and Siddall, M. (2005): The unholy trinity: taxonomy, species de- limitation and DNA barcoding. – Philos. Trans. R. Soc. B Biol. Sci. 360(1462): 1905–
1916. https://doi.org/10.1098/rstb.2005.1722
Doyle, J. J. and Doyle, J. L. (1987): A rapid isolation procedure for small quantities of fresh leaf tissue. – Phytochem. Bull. 19: 11–15.
Earl, D. A. and vonHoldt, B. M. (2012): STRUCTURE HARVESTER: A website and pro- gram for visualizing STRUCTURE output and implementing the Evanno method.
– Conserv. Genet. Resour. 4(2): 359–361. https://doi.org/10.1007/s12686-011-9548-7 Elias, M., Faria, R., Gompert, Z. & Hendry, A. (2012): Factors influencing progress toward
ecological speciation. – Int. J. Evol. Biol. 2012(i): 1–7. https://doi.org/10.1155/2012/235010 Erbano, M., Schnell e Schühli, G. and Pereira dos Santos, É. (2015): Genetic variability
and population structure of Salvia lachnostachys: implications for breeding and conservation programs. – Int. J. Mol. Sci. 16(4): 7839–7850. https://doi.org/10.3390 /ijms16047839
Feder, J. L., Egan, S. P. and Nosil, P. (2012): The genomics of speciation-with-gene-flow. – Trends Genet. 28(7): 342–350. https://doi.org/10.1016/j.tig.2012.03.009
Fick, S. E. and Hijmans, R. J. (2017): Worldclim 2: new 1-km spatial resolution climate surfaces for global land areas. – Int. J. Climatol. 37(12): 4302–4315. https://doi.org/10 .1002/joc.5086
Fujita, M. K., Leaché, A. D., Burbrink, F. T., McGuire, J. A. and Moritz, C. (2012): Coales- cent-based species delimitation in an integrative taxonomy. – Trends Ecol. Evol. 27(9):
480–488. https://doi.org/10.1016/j.tree.2012.04.012
Guisan, A. and Thuiller, W. (2005): Predicting species distribution: offering more than sim- ple habitat models. – Ecol. Lett. 8: 993–1009. https://doi.org/10.1111/j.1461-0248.2005 .00792.x
Hedge, I. C. (1982): Salvia L. – In Rechinger, K. H. (ed.): Red data book of Iran. Flora Iranica Hijmans, R. J. and Van Etten, J. (2012): Geographic analysis and modeling with raster data. – 150.
http://raster.r-forge.r-project.org/
Hijmans, R. J., Cameron, S. E., Parra, J. L., Jones, P. G. and Jarvis, A. (2005): Very high resolution interpolated climate surfaces for global land areas. – Int. J. Climatol. 25(15):
1965–1978. https://doi.org/10.1002/joc.1276
Jakobsson, M. and Rosenberg, N. A. (2007): CLUMPP: a cluster matching and permu- tation program for dealing with label switching and multimodality in analysis of population structure. – Bioinformatics 23(14): 1801–1806. https://doi.org/10.1093 /bioinformatics/btm233
Jamzad, Z. (2012): Lamiaceae. – In: Assadi, M., Maassoumi, A. and Mozaffarian, V. (eds):
Flora of Iran. Vol. 76. Research Institute of Forests and Rangelands, Tehran, 810 pp.
Khimoun, A., Cornuault, J., Burrus, M., Pujol, B., Thebaud, C. and Andalo, C. (2013): Ecol- ogy predicts parapatric distributions in two closely related Antirrhinum majus sub- species. – Evol. Ecol. 27(1): 51–64. https://doi.org/10.1007/s10682-012-9574-2
Knowles, L. L., Carstens, B. C. and Keat, M. L. (2007): Report coupling genetic and ecolog- ical-niche models to examine how past population distributions contribute to diver- gence. – Curr. Biol. 17: 940–946. https://doi.org/10.1016/j.cub.2007.04.033
Kozak, K. H., Graham, C. H. and Wiens, J. J. (2008): Integrating GIS-based environmental data into evolutionary biology. – Trends Ecol. Evol. 23(3): 141–148. https://doi.org/10 .1016/j.tree.2008.02.001
Levin, D. A. (2000): The origin, expansion, and demise of plant species. – Oxford University Press, Oxford, pp. 6–59.
Li, G. and Quiros, C. F. (2001): Sequence-related amplified polymorphism (SRAP), a new marker system based on a simple PCR reaction: Its application to mapping and gene tagging in Brassica. – Trends Ecol. Evol. 103(2–3): 455–461. https://doi.org/10.1007 /s001220100570
Li, P., Zhan, X., Que, Q., Qu, W., Liu, M., Ouyang, K. and Chen, X. (2015): Genetic diversity and population structure of Toona ciliata Roem. based on sequence-related ampli- fied polymorphism (SRAP) markers. – Forests 6(4): 1094–1106. https://doi.org/10.3390 /f6041094
Liu, Z. J. and Cordes, J. F. (2004): Erratum to “DNA marker technologies and their applica- tions in aquaculture genetics” [Aquaculture 238 (2004) 1–37]. – Aquaculture 242(1–4):
735–736. https://doi.org/10.1016/j.aquaculture.2004.08.022
Lowe, A., Harris, S. and Ashton, P. (2004): Ecological genetics design, analysis, and application.
– Blackwell Publishing, UK, 196 pp.
Marchant, D. B., Soltis, D. E. and Soltis, P. S. (2016): Patterns of abiotic niche shifts in al- lopolyploids relative to their progenitors. – New Phytol. 212: 708–718. https://doi.org /10.1111/nph.14069
Nguyen H. T. and Wu, X. (2005): Molecular marker systems for genetic mapping. – In: Mekse- mand, K. and Kahl, G. (eds): The handbook of plant genome mapping. Wiley-Black- well, pp. 23–50.
Nosil, P. and Sandoval, C. P. (2008): Ecological niche dimensionality and the evolutionary diversification of stick insects. – Plos One 3(4): 1–11. https://doi.org/10.1371/journal .pone.0001907
Nosil, P., Harmon, L. J. & Seehausen, O. (2009): Ecological explanations for (incomplete) speciation. – Trends Ecol. Evol. 24(3): 145–156. https://doi.org/10.1016/j.tree.2008.10.011 Pellissier, L., Pottier, J., Vittoz, P., Dubuis, A. and Guisan, A. (2010): Spatial pattern of floral
morphology: possible insight into the effects of pollinators on plant distributions. – Oikos 119(11): 1805–1813. https://doi.org/10.1111/j.1600-0706.2010.18560.x
Pelletier, T. A. R. A. A. P., Risafulli, C. H. C., Agner, S. T. W., Ellmer, A. M. J. Z. and Ar- stens, B. R. C. C. (2015): Historical species distribution models predict species limits in western Plethodon salamanders. – Syst. Biol. 64(6): 909–925. https://doi.org/10.1093 /sysbio/syu090
Penner, G. A., Bush, A., Wise, R., Kim, W., Domier, L., Kasha, K. and Fedak, G. (1993): Re- producibility of random amplified polymorphic DNA (RAPD) analysis among labo- ratories. – PCR Methods Appl. 2(4): 341–345. https://doi.org/10.1101/gr.2.4.341
Phillips, S. J., Anderson, R. P. and Schapire, R. E. (2006): Maximum entropy modeling of species geographic distributions. – Ecol. Modell. 190: 231–259. https://doi.org/10.1016 /j.ecolmodel.2005.03.026
Pritchard, J. K., Stephens, M. and Donnelly, P. (2000): Inference of population structure using multilocus genotype data. – Genetics 155(2): 945–959. https://doi.org/10.1111 /j.1471-8286.2007.01758.x
QGIS Development Team (2015): QGIS Geographic Information System. Open Source Geo- spatial Foundation Project. – Available online at: http://www.qgis.org/.
R Core Team (2015). R: a language and environment for statistical computing. – R Foundation for Statistical Computing, Vienna, Austria. http://www.R-project.org/.
Raxworthy, C., Ingram, C., Rabibisoa, N. and Pearson, R. (2007): Applications of ecologi- cal niche modeling for species delimitation: a review and empirical evaluation using day geckos (Phelsuma) from Madagascar. – Syst. Biol. 56(6): 907–923. https://doi.org /10.1080/10635150701775111
Reeves, P. A. and Richards, C. M. (2011): Species delimitation under the general lineage concept: an empirical example using wild North American hops (Cannabaceae: Hu- mulus lupulus). – Syst. Biol. 60(1): 45–59. https://doi.org/10.1093/sysbio/syq056 Richardson, J. L. and Urban, M. C. (2013): Strong selection barriers explain microgeograph-
ic adaptation in wild salamander populations. – Evolution. 67(6): 1729–1740. https://
doi.org/10.1111/evo.12052
Rissler, L. and Apodaca, J. (2007): Adding more ecology into species delimitation: ecologi- cal niche models and phylogeography help define cryptic species in the Black Sala- mander (Aneides flavipunctatus). – Syst. Biol. 56(6): 924–942. https://doi.org/10.1080 /10635150701703063
Rivera, P. C., Di Cola, V., Martínez, J. J., Gardenal, C. N. and Chiaraviglio, M. (2011): Spe- cies delimitation in the continental forms of the genus Epicrates (Serpentes, Boidae) integrating phylogenetics and environmental niche models. – PLoS One. 6(9): https://
doi.org/10.1371/journal.pone.0022199
Robarts, D. W. H. and Wolfe, A. D. (2014): Sequence-related amplified polymorphism (SRAP) markers: a potential resource for studies in plant molecular biology (1). – Appl. Plant Sci. 2(7): 1–13. https://doi.org/10.3732/apps.1400017
Rosenberg, N. A. (2004): DISTRUCT: a program for the graphical display of population structure. – Mol. Ecol. Notes 4(1): 137–138. https://doi.org/10.1046/j.1471-8286.2003 .00566.x
Rundle, H. D. and Nosil, P. (2005): Ecological speciation. – Ecol. Lett. 8(3): 336–352. https://
doi.org/10.1111/j.1461-0248.2004.00715.x
Schoener, T. W. and Schoener, T. W. (2015): The Anolis lizards of Bimini: resource parti- tioning in a complex fauna. – Ecology 49(4): 704–726. https://doi.org/10.2307/1935534 Stockwell, D. (1999): The GARP modelling system: problems and solutions to automat-
ed spatial prediction. – Int. J. Geogr. Inf. Sci. 13(2): 143–158. https://doi.org/10.1080 /136588199241391
Talebi, M., Rahimmalek, M. and Norouzi, M. (2015): Genetic diversity of Thymus daen- ensis subsp. daenensis using SRAP markers. – Biologia (Bratislava) 70(4): 453–459.
https://doi.org/10.1515/biolog-2015-0059
Tali, M., Abdoli, E. & Nezammahalleh, M. (2013): Geomorphological and sedimentological evidence of alpine glaciers in the Zagros Mountains, Dinevar, Iran. – J. Tethys 1(1), 85–95.
Thuiller, W., Lafourcade, B., Engler, R. and Araujó, M. B. (2009): BIOMOD – a platform for ensemble forecasting of species distributions. – Ecography 32(3): 369–373. https://doi .org/10.1111/j.1600-0587.2008.05742.x
Vos, P., Hogers, R., Bleeker, M., Reijans, M., van de Lee, T., Hornes, M., Friters, A., Pot, J., Paleman, J., Kuiper, M. and Zabeau, M. (1995): AFLP: a new technique for DNA finger- printing. – Nucleic Acids Res. 23(21): 4407–4414. https://doi.org/10.1093/nar/23 .21.4407 Vroh, B. T. A., Yao, C. Y. A., Kpangui, K. B., Gone Bi, Z. B., Kouame, D., Koffi, K. J. and
N. Guessan, K. E. (2016): Comparing suitable habitat models to predict rare and en-
demic plant species distributions: what are the limits of the niche of Cola lorougnonis (Malvaceae) in Cote d’Ivoire? – Env. Nat. Resour. Res. 6(3): 1–17. https://doi.org/10 .5539/enrr.v6n3p1
Walker, J. B., Sytsma, K. J., Treutlein, J. and Wink, M. (2004): Salvia (Lamiaceae) is not monophyletic: implications for the systematics, radiation, and ecological specializa- tions of Salvia and tribe Mentheae. – Amer. J. Bot. 91(7): 1115–1125. https://doi.org/10 .3732/ajb.91.7.1115
Warren, D. L., Glor, R. E. and Turelli, M. (2010): ENMTools: a toolbox for comparative stud- ies of environmental niche models. – Ecography (Cop.). 33(3): 607–611. https://doi.org /10.1111/j.1600-0587.2009.06142.x
Warren, D. L., Glor, R. E. and Turelli, M. (2008): Environmental niche equivalency versus conservatism: quantitative approaches to niche evolution. – Evolution 62(11): 2868–
2883. https://doi.org/10.1111/j.1558-5646.2008.00482.x
Zhang, Y., Chen, C., Li, L., Zhao, C., Chen, W. and Huang, Y. (2014): Insights from ecologi- cal niche modeling on the taxonomic distinction and niche differentiation between the blackspotted and red-spotted Tokay geckoes (Gekko gecko). – Ecol. Evol. 4(17):
3383–3394. https://doi.org/10.1002/ece3.1183
Zheng, H., Fan, L., Milne, R. I., Zhang, L., Wang, Y. & Mao, K. (2017): Species delimitation and lineage separation history of a species complex of aspens in China. – Frontiers in Plant Science 8: 1–17. https://doi.org/10.3389/fpls.2017.00375