The role of glial cells in the regulation of energy homeostasis
Ph.D. Thesis
Anett Stiftné Szilvásy-Szabó
Semmelweis University
János Szentágothai Ph.D. School of Neuroscience
Institute of Experimental Medicine Hungarian Academy of Sciences
Supervisor: Csaba Fekete, M.D., D.Sc.
Official reviewers: Árpád Dobolyi, D.Sc.
Balázs Gaszner, M.D., Ph.D.
Head of the Final Examination
Committee: András Csillag, M.D., D.Sc.
Members of the Final Examination
Committee: Krisztina Kovács, D.Sc.
Attila Patócs, M.D., Ph.D.
Budapest
2018
2
Table of contents
Table of contents ... 2
Abbreviations ... 6
1. Introduction ... 9
1.1. The key components of the energy homeostasis ... 9
1.2. The role of vagus nerve in the mediation of the energy homeostasis-related signals ... 9
1.3. The role of blood-born signals in the mediation of energy homeostasis-related information ... 10
The central melanocortin system ... 15
1.4. The role of ARC in the regulation of feeding and energy metabolism ... 16
1.4.1. The anorexigenic cell population of the ARC ... 16
1.4.2. The orexigenic cell population of the ARC ... 18
1.4.3. Intra-ARC connections ... 19
1.4.4. The perception of the peripheral signals by the ARC neurons ... 20
1.4.5. Connections of the ARC neurons with second-order neurons of the energy homeostasis ... 23
1.5. The role of tanycytes in the regulation of feeding and energy metabolism ... 24
1.5.1. Tanycytes, a special glial cell type of the hypothalamus ... 24
1.5.2. General features of tanycytes ... 24
1.5.3. Tanycytes as barrier forming cells... 25
1.5.4. The role of tanycytes in the regulation of glucose homeostasis ... 26
1.5.5. Tanycytes and leptin ... 29
1.5.6. Tanycytes and other metabolites ... 29
1.5.7. Tanycytes as diet-responsive neurogenic niche... 30
1.6. Diet-induced obesity and hypothalamic responses ... 31
3
1.6.1. Diet-induced peripheral and central responses ... 31
1.6.2. Diet induced inflammation in the ARC ... 31
1.6.3. The role of glial cells in the development of the diet- induced inflammation ... 32
2. Aims ... 35
3. Materials and methods ... 36
3.1. Experimental animals ... 36
3.2. Anesthesia ... 37
3.3. Transcardial perfusion with fixative ... 37
3.4. Tissue preparation for light microscopic investigations ... 38
3.5. Tissue preparation for electron microscopic investigations ... 38
3.6. Embedding for electron microscopic studies ... 39
3.7. Tissue preparation for in situ hybridization (ISH)... 39
3.8. Tissue preparation for laser capture microdissection (LCM) ... 39
3.9. Isolation of tanycytes and ARC using LCM ... 40
3.10. RNA isolation and RNA concentration measurements ... 40
3.11. Statistical analysis ... 40
3.12. The localization of Cx43 gap junctions and hemichannels in tanycytes ... 41
3.12.1. Loading the tanycytes with Lucifer yellow (LY) via patch pipette ... 41
3.12.2. Double-labeling immunofluorescence for Cx43 and vimentin ... 42
3.12.3. Ultrastructural detection of Cx43-immunoreactivity ... 43
3.13. Characterization of the POMC expression in tanycytes ... 43
3.13.1. Radioactive ISH ... 43
3.13.2. Fluorescent ISH combined with immunofluorescence ... 44
3.13.3. Immunofluorescent detection of POMC, β-endorphin, α-MSH and adrenocorticotropic hormone (ACTH) ... 45
4
3.13.4. Ultrastructural detection of POMC-immunoreactivity in tanycytes ... 45
3.13.5. RNA-seq analysis of tanycyte transcriptome ... 47
3.14. Importance of microglia in the development of HFD induced metabolic changes ... 48
3.14.1. Microglia-ablation with PLX5622-pretreatment ... 48
3.14.2. Short-term HFD treatment ... 48
3.14.3. Indirect calorimetric measurements and body composition analysis ... 49
3.14.4. Iba1 immunocytochemistry ... 49
3.14.5. cDNA synthesis and preamplification from the LCM samples ... 50
3.14.6. Quantitative TaqMan PCR ... 50
4. Results ... 52
4.1. The localization of Cx43 gap junctions and hemichannels in tanycytes ... 52
4.1.1. Presence of functional gap junctions between tanycytes... 52
4.1.2. Detection of Cx43-immunoreactivity in tanycytes ... 53
4.1.3. Ultrastructural localization of Cx43-immunoreactivity in tanycytes ... 54
4.2. Characterization of the POMC expression in tanycytes ... 58
4.2.1. Pomc mRNA expression in non-neuronal cells ... 58
4.2.2. Non-neuronal Pomc mRNA-expressing cells are vimentin-positive tanycytes ... 62
4.2.3. Variable POMC protein expression in tanycytes of adult rats ... 64
4.2.4. Ultrastructural examination of POMC-immunoreactive cells in the ME . 68 4.2.5. Detection of POMC-derived peptides in tanycytes ... 69
4.2.6. Expression of POMC-processing enzymes in tanycytes ... 71
4.3. Importance of microglia in the development of HFD induced metabolic changes ... 73
4.3.1. Effect of HFD and microglia ablation on the body composition and metabolic parameters ... 73
5
4.3.2. Verification of the microglia-ablation by Iba1 immunocytochemistry and
PCR ... 87
5. Discussion ... 89
5.1. The localization of Cx43 gap junctions and hemichannels in tanycytes ... 89
5.1.1. The presence of functional gap junctions in tanycytes ... 89
5.1.2. The presence of Cx43 hemichannels in tanycytes ... 91
5.2. Characterization of the POMC expression in tanycytes ... 93
5.2.1. Tanycyte Pomc ISH signal in previous studies ... 93
5.2.2. Diversity of POMC expression by tanycyte-subtypes ... 94
5.2.3. Variable POMC levels in tanycytes ... 94
5.2.4. POMC processing in tanycytes... 95
5.2.5. Potential functional implications ... 96
5.3. Importance of microglia in the development of HFD induced metabolic changes ... 97
5.3.1. The metabolic effects of short-term HFD ... 97
5.3.2. The metabolic effects of the absence of microglia ... 98
6. Conclusions ... 100
7. Summary ... 102
8. Összefoglalás ... 103
9. References ... 104
10. List of publications ... 124
10.1. List of publications the thesis is based on ... 124
10.2. Other publications ... 124
11. Acknowledgements ... 125
6
Abbreviations
2-DG 2-deoxy-D-glucose
A20 tumor necrosis factor alpha-induced protein 3 ABC avidin-biotin peroxidase complex
aCSF artificial cerebrospinal fluid ACTH adrenocorticotropic hormone AgRP agouti-related peptide
ARC hypothalamic arcuate nucleus
CART cocaine- and amphetamine-regulated transcript
CCK cholecystokinin
CNS central nervous system
CPM counts per million
CSF cerebrospinal fluid
CSF1R colony stimulating factor 1 receptor CVOs circumventricular organs
Cx43 connexin 43
DAB diaminobenzidine
DAPI 4',6-diamidino-2-phenylindole
DARP-32 dopamine- and cyclic adenosine-monophosphate-regulated phosphoprotein DEPC diethylpyrocarbonate
DMN dorsomedial hypothalamic nucleus ERK extracellular regulated kinase FFAs free fatty acids
GABA gamma-aminobutyric acid GFAP glial fibrillary acidic protein
GHSR growth hormone secretagogue receptor
GK glucokinase
GLP-1 glucagon-like peptide 1 GLUT1 glucose transporter 1 GLUT2 glucose transporter 2
HFD high-fat diet
7
Iba1 ionized calcium-binding adapter molecule 1 IGLE intraganglionic laminar endings
Ikbkb inhibitor of nuclear factor kappa-B kinase subunit beta Ikbke inhibitor of nuclear factor kappa-B kinase subunit epsilon
Il6 interleukin 6
ISH in situ hybridization
KATP ATP-inhibited potassium channel
KO knock out
LCM laser capture microdissection LepR leptin receptor
LH lateral hypothalamic area
LY Lucifer yellow
MCR3 melanocortin receptor 3 MCR4 melanocortin receptor 4
ME median eminence
NF-κB nuclear factor kappa B NGS next-generation sequencing
NHS normal horse serum
NPY neuropeptide Y
NSC neural stem cell
NTS nucleus tractus solitarii
PB phosphate buffer
PBS phosphate buffered saline PC1 prohormone convertase 1 PC2 prohormone convertase 2
PFA paraformaldehyde
PI3K phosphatidylinositol-3-kinase POMC proopiomelanocortin
PVN hypothalamic paraventricular nucleus
PYY peptide YY
SOCS3 suppressor of cytokine signaling 3
STAT3 signal transducer and activator of transcription 3
8 TLR toll-like receptor
TNFα tumor necrosis factor alpha TRH thyrotropin-releasing hormone TSH thyroid stimulating hormone
VEGF-A vascular endothelial growth factor A VMN ventromedial nucleus of the hypotahalmus WAT white adipose tissue
9
1. Introduction
1.1. The key components of the energy homeostasis
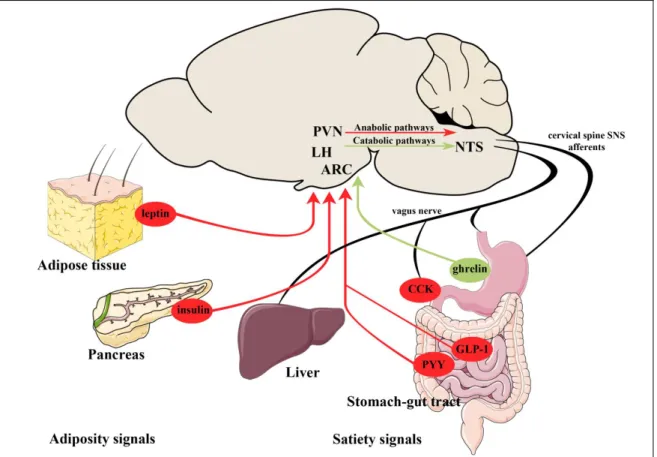
The perception of the status of energy stores and the quality and quantity of the consumed food by the central nervous system (CNS) plays crucial role in the regulation of energy homeostasis (Morton et al., 2006, Schwartz et al., 2000). This regulation is guided by the communication between the peripheral organs and the brain. The two main routes of this communication are the peripheral nerves (primarily the vagus nerve) and the blood circulation. The vagus nerve mediates the effects of some gastrointestinal hormones and the information from chemo- and mechanosensors of the gastrointestinal tract towards the nucleus tractus solitarii (NTS) in the brainstem (Li, 2007). The primary central target of peripheral, blood-derived energy homeostasis-related hormones is the hypothalamic arcuate nucleus (ARC), but these hormones can also directly influence other brain regions including the NTS (Kanoski et al., 2014) (Figure 1).
1.2. The role of vagus nerve in the mediation of the energy homeostasis-related signals
The vagus nerve represents the longest nerve of the autonomic nervous system and is involved in the regulation of the heart, lungs and the digestive tract. The sensory fibers of the vagus nerve convey afferent information from the mechano- and chemoreceptors of the gastrointestinal tract and mediates information about changes of local hormonal signals to the NTS (Schwartz et al., 2000).
The vagal afferent fibers can be found within all layers of the stomach and the small intestine, however, their location and morphology strongly influences their modality to mechanical or chemical stimuli. The intraganglionic laminar endings (IGLEs) are embedded between the longitudinal and circular smooth muscle layers (Berthoud and Powley, 1992) and being sensitive for both contractions and distensions, IGLEs represent the first candidates to sense the gastric distension after food consumption.
Besides stomach, IGLEs can be also found in the small intestine. The intramuscular arrays represent another type of vagus nerve ending either establishing parallel bundles
10
to the lamina muscularis externa or sphincter regions of the stomach (Berthoud and Powley, 1992) and their function is to sense the length of the stomach (Phillips and Powley, 2000). The mucosal afferents are both mechano- and chemosensitive components of the vagal sensory machinery. These afferents extend through the submucosal layer and can respond to mediators released from the enteroendocrine cells (Page et al., 2002).
In addition, the vagus nerve can also sense changes of certain hormones by expressing receptors for gastrointestinal hormones, like cholecystokinin (CCK), glucagon-like peptide 1 (GLP-1) and peptide YY (PYY) by which the mechanosensitivity of the vagal afferent fibers also can be modulated (Kentish and Page, 2014). The enteroendocrine cells of the intestine secrete CCK, which acting through the CCK-receptors of the vagal afferents inhibits gastric emptying and food intake (Glatzle et al., 2003). GLP-1 released from the intestinal L-cells was shown to activate both gastric and jejunal vagal afferents (Gaisano et al., 2010) resulting in decreased food intake. The L-cell derived PYY can act through PYY-receptors present on both the intestinal vagal afferents and on neurons of the ARC, indicating, that PYY can reduce food intake via the combination of more pathways (Broberger et al., 1997, Burdyga et al., 2008).
Thus, vagal afferents mediate the mechanical, chemical and hormonal information of the gastrointestinal tract and serve information about the quality and quantity of the consumed food to the NTS which integrates the food-related information. Besides the NTS, the brainstem contains other fields involved in the vagal sensory complex establishing the dorsovagal complex, including the chemosenory area, the circumventricular area postrema (AP) and the dorsal motor nucleus of the vagus, which integrates the motor and secretory drive of the gastro-intestinal tract (Young, 2012).
1.3. The role of blood-born signals in the mediation of energy homeostasis- related information
In order to regulate the food intake and energy expenditure, the brain has to sense the nutritional status and the condition of the peripheral energy stores. Blood-transported signals, like nutrients, such as glucose, amino and fatty acids, nutrition-dependent gastrointestinal hormones, like GLP-1, PYY, CCK and ghrelin or adiposity signals, like
11
the white adipose tissue (WAT) derived leptin and the pancreatic insulin (Berthoud, 2008, Schwartz et al., 2000), play critical role in this process.
The main feature of adiposity signals is that their circulating level is proportional to the size of the adipose tissue and other energy stores. The first described adipostatic hormone was the insulin. Insulin is produced by the pancreatic beta cells after carbohydrate intake (Begg and Woods, 2012). Its level is very quickly regulated by the circulating glucose levels. Thus insulin level is decreased during fasting and very quickly increased after food intake (Begg and Woods, 2012). This glucose induced regulation is, however, superimposed on a longer term regulation that makes the circulating insulin level proportional to the size of adipose depots (Woods, 2013).
Insulin acts through its receptor that is a member of the tyrosine kinase receptor family (Ebina et al., 1985, Ullrich et al., 1985). High level of insulin receptor is expressed in the skeletal muscle, where insulin supports the glucose uptake by the cells as energy source, resulting in decreased blood glucose level (Boucher et al., 2014). In the liver, insulin also promotes the uptake and the transformation of glucose to glycogen via glycogenesis and to fat via lipogenesis, moreover, insulin has opposite effect as glucagon, by inhibiting gluconeogenesis (Saltiel and Kahn, 2001). Similarly to skeletal muscle and liver, insulin regulates the uptake of glucose by the adipose tissue, promoting the development of fat depots (Mitrou et al., 2013). Since the changes of the insulin level in the CSF is relatively slow, it cannot follow the fast, glucose level induced fluctuation of the circulating insulin level. Therefore, it is likely, that the central insulin level is primarily regulated by the size of the adipose tissue. While peripheral administration of insulin indirectly stimulates food intake due to its hypoglycemic effect, insulin exerts opposite effects in the brain: it inhibits food intake and stimulates energy expenditure (Woods et al., 1979).
In 1994, the gene coding another adiposity signal, leptin, was identified (Zhang et al., 1994). Leptin is predominantly produced by the adipocytes of the WAT (Flier, 1998) and as an adipostatic hormone, the circulating level of leptin is proportional to the size of the WAT (Schwartz et al., 2000). Leptin was identified as the hormone missing from the obese ob/ob mouse line (Halaas et al., 1995). Administration of leptin to rodents with normal body weight results in inhibition of food intake and decrease of body weight (Halaas et al., 1995). Leptin also regulates energy expenditure as both central
12
and peripheral leptin administration markedly stimulates the basal energy expenditure.
While leptin has potent anorexigenic effect in animals with normal body weight, obese rodents and humans have high leptin level and develop leptin resistance (Zhou and Rui, 2013). Therefore, leptin is crucial for the normal regulation of energy homeostasis, but cannot be used to treat obesity. In humans, the mutation of leptin gene causes similar obese phenotype than in rodents (Farooqi et al., 1998).
GLP-1 is a food intake-related peptide secreted by the L-cells of the small intestine (Herrmann et al., 1995). In addition, GLP-1 is also synthesized in a neuronal group of the NTS (Herrmann et al., 1995). By acting in the pancreas, GLP-1 induces insulin secretion, while it inhibits glucagon release (Holst, 2007), thus, GLP-1 has a crucial role in the regulation of glucose homeostasis. Peripheral as well as central administration of GLP-1 was proved to inhibit food intake and increase energy expenditure (Gutzwiller et al., 1999, Tang-Christensen et al., 1996). Analogues of the hormone, like exendine-4 and liraglutide were also shown to reduce body weight both in rodents and humans (Edwards et al., 2001, Hayes et al., 2011). GLP-1 and its analogues are able to cross the blood-brain barrier (BBB) (Hunter and Holscher, 2012) and GLP-1 receptors have been shown to be present in several brain regions involved in the regulation of energy homeostasis (Cork et al., 2015). These data together suggest that GLP-1 have important role in the regulation of energy homeostasis. GLP-1 has, however, a very short half-life raising the question whether peripheral GLP-1 may reach the CNS in effective dose.
However, the high amount of GLP-1 receptor in the ARC, where relatively few GLP-1 axons can be found suggests that peripheral GLP-1 may influence this nucleus (Personal observation). This effect of GLP-1 may be enhanced by inhibition of the GLP-1 degrading dipeptidyl peptidase-4 or by administration of the agonists of GLP-1 with longer half-time. These strategies are widely used in the treatment of type 2 diabetes and investigated as the targets in the treatment of obesity (Dailey and Moran, 2013, Lovshin and Drucker, 2009)
PYY is a 36-amino acid peptide released from the distal segments of the gastrointestinal tract, predominantly from the ileum and colon (Tatemoto, 1982). The main function of PYY is to inhibit gastric motility and to promote the absorption of water and electrolytes in the colon (Liu et al., 1996). PYY is secreted from the gut into the blood circulation in a nutrient-dependent manner. During fasting, PYY level is low, however,
13
during food intake the PYY level is rising (Adrian et al., 1985). It has been shown that intraperitoneal injection of the predominant circulating form, the PYY3-36, decreases food intake in rats (Batterham et al., 2002). Additionally, peripheral infusion of PYY3-36
reduces the appetite of non-obese humans (Batterham et al., 2002). Moreover, PYY knock out (KO) mice are hyperphagic, their food consumption is significantly higher and show increased subcutaneous and visceral adiposity (Batterham et al., 2006). These data all confirm the anorexigenic nature of PYY.
CCK is secreted from the enteroendocrine I cells of the small intestine and it has an important role in the regulation of the exocrine pancreatic secretion, in the modulation of gastric motility and the digestion of fat by increasing the release of bile from the gallbladder (Sayegh, 2013, Stengel and Tache, 2011). The secretion of CCK occurs in a nutrition dependent manner, the peak of the CCK level can be observed 15 min after the start of the meal in human (Stengel and Tache, 2011). The anorexigenic feature of CCK was shown several years ago by central administration of the peptide that markedly reduced the amount of the consumed food. CCK was also shown to decrease food intake in humans (Goebel-Stengel et al., 2012, Smith et al., 1981). The CCK58 isoform decreases the consumed food during one meal; nevertheless, it cannot reduce the daily food intake, as intraperitoneal injection of the peptide increases the frequency of meals (Goebel-Stengel et al., 2012). While, other nutrition dependent hormones regulate food intake via crossing the BBB, the main pathway that mediates the effects of CCK is the vagus nerve-NTS pathway (Smith et al., 1981).
The common feature of the above mentioned gastrointestinal hormones is their anorexigenic effect, however, in 1999 a new gastrointestinal peptide, ghrelin was discovered with opposite effect (Kojima et al., 1999, Nakazato et al., 2001).
Ghrelin was shown to be secreted from the mucosa of the stomach (Date et al., 2000) before and during nutrition and to have potent effect on appetite (Cummings et al., 2001). The serum level of ghrelin is the highest just before the expected meal time and decreases after food consumption (Tschop et al., 2001). Ghrelin was named after its ability to bind to the growth hormone secretagogue receptor (GHSR) and to stimulate the secretion of growth hormone (Kojima et al., 1999). Both central and peripheral administration of ghrelin was shown to increase food intake, moreover it results in body
14
weight gain (Tschop et al., 2000). Additionally, intraperitoneal injection of ghrelin significantly increases the appetite of humans (Wren et al., 2001). According to these data, ghrelin is the only peripheral hormone with orexigenic effect (Iwakura et al., 2015).
Besides regulating food intake, ghrelin also decreases energy expenditure and the two processes together lead to the increase of the WAT (Davies et al., 2009).
Figure 1: Schematic illustration of the peripheral adiposity and satiety signals regulating energy homeostasis
Adiposity signals like leptin and insulin from the adipose tissue and pancreas, respectively and satiety signals like the anorexigenic GLP-1, PYY and the orexigenic ghrelin from the gastrointestinal tract are released into the blood and delivered to the neurons of the ARC. The ARC contains first order neurons of the regulation of energy homeostasis. These neurons sense the peripheral signals, integrate with neuronal inputs and transmit this information toward second order neuronal groups, like neurons of the LH and PVN. The other energy expenditure-related sensory area of the brain is the NTS integrating the information carried by the vagus nerve from the gastrointestinal tract.
The descending pathways from the hypothalamus can change the sensitivity of the NTS neurons to the vagal afferents.
Abbreviations: PVN –hypothalamic paraventricular nucleus; LH – lateral hypothalamic area; ARC – arcuate nucleus; NTS – nucleus tractus solitarii; CCK – cholecysokinin;
GLP-1 – glucagon-like peptide 1; PYY – peptide YY.
Modified from (Schwartz et al., 2000)
15
The central melanocortin system
The central melanocortin system plays a crucial role in the regulation of energy homeostasis including the mediation of the peripheral signals toward the brain (Cone, 2005, Ellacott and Cone, 2006). The melanocortin system is composed of the 5 melanocortin receptors (MCRs) and their ligands the proopiomelanocortin (POMC) derived peptide agonists and the endogenous antagonists, like the agouti-related peptide (AGRP). The melanocortin system of the brain includes the POMC expressing neurons of the ARC and the NTS, the AGRP neurons of the ARC and the downstream targets of these neuronal groups expressing MCRs (Cone, 2005).
The role of the melanocortin system in the regulation of energy homeostasis has been shown by genetic lesions of this signaling pathway. Deletion of the POMC gene in mice results in obesity (Yaswen et al., 1999), moreover, the loss of either melanocortin receptor 3 or 4 (MCR3 or MCR4) also cause obese phenotype (Butler et al., 2000, Huszar et al., 1997).Similarly to rodents, deficiency of the human melanocortin system has been shown to lead to failures in the regulation of energy homeostasis and thus obesity (Farooqi et al., 2000, Krude et al., 1998).
The elements of the melanocortin system.
The POMC serves as a precursor that is cleaved by prohormone convertase enzymes resulting in smaller tissue-specific melanocortin peptides. The melanocortin receptor family consists of 5 7- transmembrane G protein- coupled receptors that have different tissue specific expression pattern and different affinity for their agonists, melanocortins and antagonists, like AgRP.
The agonists of the different receptors are listed in the order of their affinity. Modified from (Dib et al., 2017).
16
1.4. The role of ARC in the regulation of feeding and energy metabolism
The main central target of the above mentioned energy homeostasis related peripheral hormones is the ARC, containing several elements of the central melanocortin system.
The ARC is located in the vicinity of the BBB free median eminence (ME). This way, blood-derived hormones and metabolites can easily reach the neurons in this brain area.
The ARC contains at least two feeding-related neuronal populations: the proopiomelanocortin (POMC) and cocaine- and amphetamine-regulated transcript (CART) synthesizing anorexigenic neurons and the neuropeptide Y (NPY), agouti- related peptide (AgRP) and gamma-aminobutyric acid (GABA) producing orexigenic cell population (Blouet and Schwartz, 2010, Hillebrand et al., 2002). The two distinct neuronal groups are located in different parts of the ARC, while the POMC/CART neurons reside in the more lateral parts of the ARC; the NPY/AgRP neurons are located in the ventromedial part of the nucleus. These two neuronal groups have antagonistic effects in the regulation of food intake and energy expenditure (Ollmann et al., 1997).
1.4.1. The anorexigenic cell population of the ARC
The anorexigenic neuronal group of the ARC co-synthesizes two peptide precursors, the POMC and CART (Dhillo et al., 2002, Fekete et al., 2000c).
Proteolytic cleavage of POMC results in biological active peptides that plays crucial role in the regulation of energy homeostasis (See detailes in The central melanocortin system textbox). The role of POMC is widely investigated by animal models. Pomc-null mutant mice have early onset obesity, failure in the adrenal development, and alteration in hair pigmentation (Challis et al., 2004, Yaswen et al., 1999). Neuronal specific deletion of POMC results in similar obesity phenotype without effects on adrenal function and hair pigmentation further demonstrating the role of centrally synthesized POMC in the regulation of energy homeostasis (Smart and Low, 2003). In contrast, overexpression of POMC has been shown to prevent the development of obesity in mice (Mizuno et al., 2003). In the field of energy homeostasis, the most widely studied POMC derived peptide is α-MSH. Central administration of α-MSH decreases food intake and markedly stimulates energy expenditure (Murphy et al., 1998). α-MSH primarily exerts its central effects via two types of MCRs, the MC3R and the MC4R.
17
Similarly to the neuronal absence of POMC, the loss of MC4R leads to increased food intake, decreased energy expenditure and obesity in mice (Adan et al., 2006, Huszar et al., 1997). In humans, the mutations of Pomc and Mc4r genes also exist (Challis et al., 2002, Farooqi et al., 2006, Krude et al., 1998). These mutations can be detected in approximately 6-10% of the clinically obese patients (Farooqi et al., 2006). Similarly to rodents, POMC deficiency is characterized by adrenal deficiency, red-hair pigmentation and early onset obesity in humans (Farooqi et al., 2006, Krude et al., 1998). Mutations of the Mc4r gene result in increased food intake, decreased energy expenditure and obese phenotype in humans (Farooqi and O'Rahilly, 2008).
CART is also proteolitically processed in neurons (Douglass et al., 1995). The most abundant CART peptides in the brain are the CART 55-102 and CART 62-102 (Douglass and Daoud, 1996, Gautvik et al., 1996). Both intracerebroventricular administration and hypothalamic intranuclear injections of CART can cause inhibition of food intake (Abbott et al., 2001, Kristensen et al., 1998). Moreover, central administration of neutralizing CART antibodies leads to hyperphagic response, demonstrating that not only the exogenous, but also the endogenous CART inhibits food intake (Kristensen et al., 1998). Interestingly, overexpression of CART in different neuronal groups of the hypothalamus provided inconsistent data suggesting that in some neuronal connections CART may have rather orexigenic effect (Kong et al., 2003, Qing and Chen, 2007). In order to better understand the consequences of the absence of CART expression, several KO models have been generated, summarized in the work of Lau and Herzog (Lau and Herzog, 2014). CART KO mice have increased body weight only after 40 weeks of age when kept on standard chow (Wierup et al., 2005). These mice have, however, elevated blood insulin level with normal circulating glucose level suggesting that they develop insulin resistance (Wierup et al., 2005). However, when CART KO mice are fed with high-fat diet (HFD), they have significantly increased food intake and body weight and altered behavior (Asnicar et al., 2001). Surprisingly, CART is not expressed in the POMC neurons of the human infundibular nucleus, the homologue of the rodent ARC (Menyhert et al., 2007). CART is rather expressed in the orexigenic AGRP/NPY neurons of the human hypothalamus (Menyhert et al., 2007) raising the possibility that CART may have different role in humans. However, polymorphism of the CART gene is associated with reduced metabolic rate,
18
hyperphagia, obesity and increased chance to develop type II diabetes suggesting its anorexigenic effect even in the human hypothalamus (Banke et al., 2013).
In rodents, the unequivocal proof for the anorexigenic nature of the POMC/CART neurons is that ablation of these neurons in adult mice results in hyperphagia and weight gain (Gropp et al., 2005).
1.4.2. The orexigenic cell population of the ARC
The ventromedial part of the ARC contains the orexigenic neurons that express AgRP and NPY and utilize GABA as classical transmitter (Aponte et al., 2011, Krashes et al., 2011).
Shortly after the discovery of NPY, its orexigenic effect was also described (Clark et al., 1985, Levine and Morley, 1984). Intracerebroventricular administration of NPY stimulates food intake in a dosage dependent manner (Clark et al., 1985). Furthermore, chronic intrahypothalamic injection of NPY results in increased body weight (Beck et al., 1992). The NPY release from the terminals of the ARC neurons is regulated by the nutritional status. NPY release is the highest in the hypothalamic paraventricular nucleus (PVN) just before the time of the scheduled feeding and continuously decreases during feeding (Kalra et al., 1991). Animal models with obese phenotype caused for example by the loss of MCR or by leptin deficiency have elevated NPY levels (Kesterson et al., 1997). Surprisingly, NPY KO animals have normal body weight and respond to fasting with regular hyperphagia (Erickson et al., 1996a) suggesting that the lack of NPY can be compensated. However, if NPY KO mice are crossed with leptin- deficient mice, the lack of NPY attenuates the obesity of ob/ob mice by reducing the food intake and stimulating the energy expenditure emphasizing the importance of NPY in the leptin dependent energy balance pathway (Erickson et al., 1996b). Conversely, the viral overexpression of NPY causes a marked obesity syndrome with elevated adiposity and hyperinsulaemia (Lin et al., 2006), further demonstrating the orexigenic role of NPY.
A great majority of the ARC NPY neurons co-express AgRP, a second orexigenic peptide (Hahn et al., 1998). Central injection of AgRP increases food intake as an antagonist of the MC3R and MC4R (Ollmann et al., 1997). Both overexpression of
19
AgRP and the central administration of the peptide cause significant increase in food intake with simultaneous decrease in energy expenditure (Goto et al., 2003, Korner et al., 2003). The effect of AGRP on the energy expenditure is mediated at least partly via the hypothalamic-pituitary-thyroid axis as central administration of AGRP markedly inhibits the TRH expression of the hypophysiotropic neurons and results in a fall of peripheral thyroid hormone levels (Fekete et al., 2004). Rodents sensitive to diet- induced obesity show altered AgRP/NPY expression (Wang et al., 2002a) and similarly in humans, a strong correlation can be found between body mass index and hypothalamic AgRP/NPY expression (Alkemade et al., 2012). In spite of the clear correlation between obese phenotype and the elevated AgRP expression, the lack of Agrp gene does not induce an obvious phenotype. Similarly to those seen in the case of NPY KO animals, the inactivation of Agrp gene does not have any effect on the body weight regulation (Qian et al., 2002). Furthermore, even the NPY/AgRP double KO mice have normal body composition (Flier, 2006, Qian et al., 2002).
As slow, progressive post-embryonic ablation of the NPY/AgRP neurons results in moderate reduction of body weight of adult mice (Bewick et al., 2005), however, rapid ablation of the AgRP neurons in adult animals leads to life threatening anorexia and weight loss (Gropp et al., 2005), it is likely, that there are compensatory processes that can balance the absence of these neurons and their transmitters. This is further supported by the experiments that if the mice are treated for two weeks with GABAA
agonist after the ablation of these neurons, their energy homeostasis can normalize (Wu and Palmiter, 2011).
1.4.3. Intra-ARC connections
During the last decades, several investigations have substantiated the existence of neuroanatomical connections between the orexigenic and anorexigenic cell populations of the ARC. These connections utilize GABA and melanocortin peptides (Bagnol et al., 1999, Cowley et al., 2001). GABA release from the NPY/AgRP/GABA-containing nerve terminals induces inhibitory currents and hyperpolarization of the innervated POMC/CART neurons (Cowley et al., 2001). This way GABA decreases the firing rate of the POMC/CART cells. On the other hand, POMC/CART neurons were shown to express MC3R, which specifically binds POMC derivates with high affinity. The
20
activation of POMC/CART neurons evokes elevated release of POMC-products forming a short autoinhibitory feedback loop through MC3R activation (Cowley et al., 2001).
1.4.4. The perception of the peripheral signals by the ARC neurons
A critical area of the brain that can sense the energy homeostasis-related hormones and circulating nutrients is the ARC (Schwartz et al., 2000). Neonatal ablation of ARC causes obesity and leptin resistance (Morris et al., 1998). Both the NPY/AGRP and the POMC/CART neurons can sense the peripheral energy homeostasis-related signals (Schwartz et al., 2000). These neuronal groups express leptin, insulin, ghrelin, PYY and glucocorticoid receptors and are sensitive to glucose, amino- and fatty acids (Blouet et al., 2009, Cheng et al., 1998, Corander and Coll, 2011, Hakansson et al., 1996, Havrankova et al., 1978, Ibrahim et al., 2003, Morton et al., 2006, Willesen et al., 1999). Thus, changes of the energy availability regulate both neuronal groups of the ARC. Fasting increases the firing of the NPY/AGRP neurons and stimulates the NPY and AGRP synthesis in these cells (Takahashi and Cone, 2005). In contrast, fasting inhibits the anorexigenic neurons and decreases the POMC and CART synthesis in these cells (Mizuno et al., 1998). Both central and peripheral administration of leptin to fasted animals completely reverse these fasting induced changes (Takahashi and Cone, 2005).
Leptin has both direct and indirect effects on the POMC neurons (Cowley et al., 2001, Elias et al., 1999). The POMC neurons express leptin receptors (LepRs) and leptin directly excites these cells, but the effect of the selective ablation of LepR from the POMC neurons is relatively modest compared to the effect of the deletion of POMC or the MC4R (Balthasar et al., 2004) suggesting that other neuronal populations also play role in the mediation of leptin’s effect on the POMC neurons. As absence of lepR from glutamatergic neurons has also only mild phenotype, but the lack of this receptor from GABAergic neurons induces obesity, it was suggested that leptin induced inhibition of the GABAergic input of POMC neurons is important for the leptin induced activation of the POMC neurons (Cowley et al., 2001, Elias et al., 1999).
Similarly to leptin, glucose and insulin also stimulates the POMC/CART neurons (Ibrahim et al., 2003, Schwartz et al., 2000). Interestingly, however, these signals have
21
different effects on the synthesis of POMC and CART when administered to fasted animals. While leptin stimulates the synthesis of both peptides, glucose and insulin has stimulatory effect only on the POMC gene (Fekete et al., 2006). This would suggest that the activation of POMC/CART neurons by different peripheral signals may exert different effect on the second order neuronal groups.
GHRS1a is also present in a population of POMC neurons; however, data suggest that the effect of ghrelin on the POMC neurons may be primarily indirect via the NPY/AGRP neurons (Chen et al., 2004).
The NPY/AGRP neurons are oppositely regulated by peripheral signals compared to the POMC/CART neurons. Leptin administration hyperpolarizes these neurons and inhibits their NPY and AGRP synthesis (Vong et al., 2011). Glucose and insulin also inhibit these cells, but while insulin inhibits only the NPY synthesis in these cells, glucose influences neither the NPY nor the AGRP synthesis (Fekete et al., 2006). Ghrelin directly stimulates these neurons (Hewson and Dickson, 2000, Wang et al., 2002b).
The presence of Y2 receptor in the NPY expressing neurons of the ARC suggest, that besides NPY, PYY can also act directly on these cells (Broberger et al., 1997). Injection of PYY into the ARC inhibits the nerve terminals of NPY/AGRP neurons (Batterham et al., 2002) (Figure 2).
The ARC can also sense and respond to the changes of the plasma levels of free fatty acids (FFAs) (Lam et al., 2005). Increased FFA levels of the plasma in the case of HFD were shown to be associated with higher levels of FFAs in the orexigenic and anorexigenic neurons of the ARC. Furthermore, both long-term diet rich in the saturated fatty acid palmitate or rapid enteral palmitate-rich milk injection leads to the elevation of FFA levels of ARC, suggesting, that not only prolonged HFD, but also postprandial elevations of the peripheral FFA levels can be sensed by hypothalamic neurons (Valdearcos et al., 2014). The sensation of FFAs and the induction of the adaptive inflammatory response by the ARC neurons can occur by the involvement of receptor- and metabolism-dependent mechanisms. As ARC neurons express toll-like receptor 2 (TLR2) (Shechter et al., 2013), it is likely, that these neurons are able to directly sense FFAs. On the other hand, as FFAs are normally unreactive, the esterification of FFAs is essential in order to initiate lipid signaling pathways (Schmelz and Naismith, 2009). It
22
has been shown, that NPY/AgRP neurons express a key enzyme of FFA metabolism further proving the involvement of ARC feeding-related neurons in the sensation of lipids (Andrews et al., 2008).
Figure 2: Schematic illustration of the perception of the peripheral signals by the ARC neurons, intra-ARC connections and transmission of the signals to second-order neurons.
The peripheral hormones regulate the activity of the feeding-related neurons by acting directly on their own receptors. The feeding-related neurons of the ARC, containing either orexigenic NPY and AgRP or anorexigenic POMC and CART form a well- organized autoregulatory network. NPY/AgRP neurons also co-express GABA, inhibiting POMC/CART neurons, while POMC/CART neurons inhibit NPY/AgRP neurons via MCRs. The signals from the ARC neurons are transmitted to second-order neurons by activating them via MCRs or Y receptors.
Abbreviations: GABAA – gamma aminobutyric acid receptors A; GHSR – growth hormone secretagogue receptor; INSR – insulin receptor; LEPR – leptin receptor;
MC3R, MC4R – melanocortin receptor 3 or 4; PYY – peptide YY; Y1R, Y2R – neuropeptide Y 1 or 2 receptor.
Based on (Cone, 2005) and (Schwartz et al., 2000) after modification.
23
1.4.5. Connections of the ARC neurons with second-order neurons of the energy homeostasis
The NPY/AGRP and the POMC/CART neurons of the ARC transmit the peripheral information toward the so-called second-order neurons. These neurons express melanocortin and NPY receptors. As both the NPY/AgRP and the POMC/CART neurons have widespread projections, the second order neurons are also found in many brain areas including the PVN, the hypothalamic dorsomedial nucleus (DMN) and cell groups of the lateral hypothalamic area (LH) which are also involved in the regulation of energy homeostasis (Elmquist et al., 1998).
The DMN receives very dense innervations from both AGRP and the POMC neurons (Gao and Horvath, 2007). In addition to this ARC inputs, de DMN also receives information from the circadian master regulator, the suprachiasmatic nucleus via relay neurons of the subparaventricular zone (Huang et al., 2011), thus this nucleus can integrate the energy homeostasis and circadian information. Besides its projections to other energy homeostasis related hypothalamic nuclei, like the PVN (Bernardis and Bellinger, 1998, Gao and Horvath, 2007), the DMN sends a multisynaptic descending pathway to the brown adipose tissue that has important role in the regulation of thermogenesis and energy expenditure (Bamshad et al., 1999, Chitravanshi et al., 2016).
The PVN also receives very dense innervations from the two feeding-related neuronal groups of the ARC and these inputs converge on the very same PVN neurons indicating that the two antagonistic ARC neuron populations together fine tune the activity of the PVN neurons (Cone, 2005, Fekete et al., 2000a, Schwartz et al., 2000). In accordance to the very dense AGRP and α-MSH-containing input of this nucleus, the PVN has the highest MC4R content among the hypothalamic nuclei (Shukla et al., 2012). The PVN has critical role in the regulation of energy homeostasis. Hypophysiotropic TRH, CRH and somatostatin neurons of the PVN regulate energy homeostasis by controlling the hypothalamic-pituitary-thyroid and adrenal axes and the hypothalamic-somatotrop axis (Fekete and Lechan, 2014). In addition, descending inputs from the PVN innervates important vegetative nuclei of the brainstem, thus PVN can also regulate food intake and energy expenditure via these brainstem connections.
24
The LH is also a target of the of the ARC neurons (Elias et al., 1999). In this hypothalamic region, the MCH, orexin and neurotensin neurons are the most well known energy homeostasis related neuronal groups (Schwartz et al., 2000). In addition to other hypothalamic nuclei, these LH neuronal groups are also interconnected with reward-related neuronal circuits suggesting their role in the integration of the energy homeostasis and reward related signals (Stuber and Wise, 2016).
1.5. The role of tanycytes in the regulation of feeding and energy metabolism 1.5.1. Tanycytes, a special glial cell type of the hypothalamus
Tanycytes are specialized glial cells that line the floor and the ventrolateral walls of the third ventricle between the rostral and caudal limits of the hypothalamic ME. Earlier, tanycytes were simply considered as supporting and barrier forming cells, but during the last years number of data was published demonstrating that tanycytes can actively regulate neuronal functions in the hypothalamus (Lechan and Fekete, 2007).
1.5.2. General features of tanycytes
A dominant feature of tanycytes is their obvious polarization (Bruni, 1974, Rodriguez et al., 2005). The small cell bodies of tanycytes are located in the ependymal layer of the third ventricle. Microvilli or bulbous protrusions project from their ventricular surface into the cerebrospinal fluid (CSF) (Firth and Bock, 1976), while a single, long process projects into the neuropil of the hypothalamus from their basal surface (Akmayev and Popov, 1977, Monroe and Paull, 1974).
According to the localization and anatomy of these cells, tanycytes can be classified into four subtypes (Akmayev and Fidelina, 1976, Akmayev et al., 1973, Akmayev and Popov, 1977, Rodriguez et al., 1979). The α1- and α2-tanycytes line the ventrolateral walls of the third ventricle (Akmayev et al., 1973, Rodriguez et al., 1979), β1-tanycytes line the lateral extensions of the infundibular recess of the third ventricle (Amat et al., 1999) and β2-tanycytes are situated in the floor of the ventricle. The projection field of the four subtypes differs. The basal process of α1-tanycytes projects to the DMN and ventromedial nuclei, the α2-tanycytes project to the ARC, the process of β1-tanycytes terminate on the surface of the tuberoinfundibular sulcus, while the basal process of β2-
25
tanycytes terminate around the portal capillaries of the ME (Flament-Durand and Brion, 1985, Kozlowski and Coates, 1985, Peruzzo et al., 2000).
By forming tight junctions in the wall of third ventricle, tanycytes are involved in the formation of the blood-brain barrier separating the CSF from the extracellular fluid of the BBB free ME (Mullier et al., 2010). Tanycytes are also involved in the formation of the BBB around the capillaries of the ARC. In addition, tanycytes actively regulate neuroendocrine functions including the hypothalamic-pituitary-gonadal (Prevot, 2002) and -thyroid axes (Fekete et al., 2000b, Tu et al., 1997), and play role in the control of physiological functions such as thermoregulation, feeding and energy balance (Bolborea and Dale, 2013).
1.5.3. Tanycytes as barrier forming cells
In most brain areas the molecular trafficking is restricted between the blood and the neuropil by the BBB, built up by tight junctions of the adjacent endothelial cells that line the capillaries and the surrounding glial end feet (Neuwelt et al., 2011). The exemptions are the so called circumventricular organs (CVOs) where the endothelium around microvessels is fenestrated, thus allowing the free passage of the blood-borne molecules (Ciofi, 2011).
The ME represents one of the CVOs, however, tight junctions among the cell bodies of β-tanycytes in the ventral wall of the third ventricle act as a shifted physical barrier between blood and CSF, preventing the uncontrolled diffusion of the blood-borne molecules to other brain areas. Indeed, β-tanycytes express elements of tight junctions like zonula occludens 1, occludin and claudin 1 and 5 (Mullier et al., 2010). In contrast, α-tanycytes do not express claudin 1 and form less organized tight junction pattern of zonula occludens 1, occluding and claudin 5, thus lack barrier properties (Rodriguez et al., 2005). On the other hand, tanycytes located on the border of ME and ARC; establish an interface between the CSF, blood and the ARC promoting the passage of peripheral signals to the energy homeostasis-related brain regions.
Changes of energy homeostasis are able to restructure the barrier composed of tanycytes between ME and ARC and thus change the permeability of this barrier (Prevot et al., 2013). Fasting increases the organization of tight junction proteins and also enhances
26
the fenestration of the capillary loops in the ME and ARC (Langlet et al., 2013). Thus the permeability of the ARC ME blood vessels increases, but the tanycytes prevent the leakage of blood born molecules to the CSF and other brain regions. Similarly to fasting, glucose deprivation and 2-deoxy-D-glucose (2-DG) treatment that inhibits glucose metabolism cause tight junction reorganization, while intravenous glucose administration prevents this process (Langlet et al., 2013). Both fasting and 2-DG treatment result in increased synthesis of vascular endothelial growth factor A (VEGF- A) in tanycytes. Selective ablation of Vegfa prevents the above mentioned structural reorganization of tight junctions and the increase of the permeability of microvessels (Langlet et al., 2013) indicating that VEGF-A is a crucial factor mediating the BBB rearrangement.
According to these data, the blood-hypothalamus barrier composed by tanycytes is changing its permeability in response to metabolic challenges, thus, tanycytes might act as the first line reached by peripheral signals and play a crucial role in the regulation of the availability of peripheral signals for the ARC neurons.
1.5.4. The role of tanycytes in the regulation of glucose homeostasis
The presence of tight junctions in tanycytes not only ensures the barrier properties for these special cells, but also regulates the polarity of the cell and the intracellular trafficking of the blood-borne molecules.
Tanycytes ability to respond to changes of glucose level is indicated by the expression of the elements of the glucose sensing molecular machinery in these cells (Rodriguez et al., 2005). α- and β1-tanycytes express glucose transporter 1 (GLUT1), that play a crucial role in the entry of glucose into the cells (Garcia et al., 2001, Peruzzo et al., 2000), while glucose transporter 2 (GLUT2) is present in the apical membranes of β1- and β2-tanycytes (Garcia et al., 2003), making them candidates for sensors of CSF glucose levels. Moreover, glucokinase (GK), an enzyme that catalyses the phosphorylation of glucose, was detected in β1-tanycytes by Western blot analysis and immunocytochemistry. The subcellular distribution of GK is altered depending on the glycemic status of the animal (Millan et al., 2010). Glucokinase regulatory protein (GKRP), another key enzyme of glucose metabolism, that controls both the intracellular localization and the activity of GK, is also present in tanycytes (Salgado et al., 2014).
27
The presence of the above mentioned glucose sensing molecular elements in tanycytes that are critical for the glucose-sensing in the pancreatic β-cells (Schuit et al., 2001), suggests that glucose is able to enter into tanycytes through glucose transporters, then it is phosphorylated by GK. The resultant glucose-6-phosphate enters the Krebs-cycle, resulting in ATP production and the alteration of ATP-ADP ratio, which leads to the closure of ATP-inhibited potassium channels (KATP) also present in tanycytes (Thomzig et al., 2005). The closing of this channels leads to membrane depolarization and the increase of the intracellular Ca2+ levels (Figure 3A).
Beside the above mentioned process, it is proved that tanycytes perform another, more complex response to external glucose. Tanycytes of acute brain slices were shown to respond to glucose and glucose analogue puffs on their cell bodies (Frayling et al., 2011). Essentially, tanycytes are able to respond to the increase of local glucose levels with elevated intracellular Ca2+ levels, triggering the release of ATP to their extracellular space. Tanycytes have the ability of perceiving ATP via purinoreceptor 1 (P2Y1) that supports the propagation of Ca2+ waves to the neighboring tanycytes. This process allows a rapid response to the changes of glucose levels (Frayling et al., 2011).
This glucose induced ATP release occurs via connexin 43 (Cx43) hemichannels based on in vitro data of cell cultures derived from one day old rat pups (Orellana et al., 2012).
However, it is currently unknown whether tanycytes of adult animals express Cx43 and whether this protein form hemichannels, gap junctions or both in tanycytes.
Tanycytes may also utilize other alternative mechanisms of glucose sensing. Glucose may be taken up by tanycytes via Na+/glucose co-transporters (Bolborea and Dale, 2013). This way, entry of glucose into tanycytes results in an increase of the intracellular Na+ levels, resulting in depolarization that may lead to the inversal of the Na+/Ca2+ exchanger, transporting Na+ to the extracellular and Ca2+ to the intracellular space (Figure 3B). The other proposed mechanism of tanycyte glucosensing is the activation of a G-protein coupled receptor. This mechanism is proved by the presence of the heterodimer sweet taste receptor Tas1r2/Tas1r3 in tanycytes (Figure 3C) (Benford et al., 2017).
28
Figure 3: Schematic illustration of the glucose sensing mechanisms of tanycytes According to the pancreatic β-cell paradigm (A), glucose is taken up into cells and converted to glucose-6-phosphate via glucokinases. G-6-P then enters the Krebs-cycle resulting in ATP production which causes the closure of the ATP-dependent K+- channels and depolarization, opening the voltage-gated Ca2+ channels and increasing the intracellular calcium level. As tanycytes express all elements of this mechanism, it is likely, that tanycytes may sense glucose on the same way like pancreatic cells. B and C represent alternative mechanisms by which tanycytes may perform glucose sensation.
On B, glucose enters into tanycytes via Na+-linked glucose transporter. The increasing intracellular Na+ level leads to the reversal of the Na+-Ca2+ exchanger, which increases the intracellular Ca2+ level promoting the release of ATP which can act through P2Y1 receptors and modulate the mobilization of the intracellular Ca2+ stores in the neighboring tanycytes. C shows that glucose may act through G-protein coupled receptors like the Tas1r2/Tas1r3 heterodimer sweet taste receptor that leads to direct increase of intracellular Ca2+ level resulting in further ATP release.
Based on (Benford et al., 2017, Bolborea and Dale, 2013, Dale, 2011) after modification.
29 1.5.5. Tanycytes and leptin
Leptin regulates energy homeostasis and food intake and can act in the brain via activation of the LepR (Ahima et al., 2000) initiating several pathways, including the signal transducer and activator of transcription 3 (STAT3), extracellular regulated kinase (ERK) and the phosphatidylinositol-3-kinase (PI3K) pathways (Munzberg and Myers, 2005).
Peripheral administration of the adiposity signal leptin activates the feeding-related neurons in the ARC along a gradient moving from the ventral to the dorsal site of the hypothalamus. However, central injection of leptin can access all the hypothalamic nuclei within a few minutes (Faouzi et al., 2007). It has also been proved by using fluorescently labeled leptin that this adiposity signal is able to cross the wall of the fenestrated capillaries in the external zone of the ME (Vauthier et al., 2013) raising the possibility that tanycytes represent the first line reached by the peripheral leptin. Indeed, five-minutes after peripheral leptin administration phosphorylated STAT3 is already present in the tanycytes, but not in the neurons of the ARC (Balland et al., 2014).
Similarly, the fluorescent leptin administered intravenously labeled tanycytes 5 minutes after injection. As a further proof of the involvement of tanycytes in the leptin signaling, all LepR isoforms, the a, b, c and e are expressed in the tanycytes, moreover, ERK and STAT3 phosphorylation have been shown after leptin treatment in tanycyte cell cultures (Balland et al., 2014) suggesting the presence of the functional LepR signaling in tanycytes. According to these data, tanycytes represent the first line reached by the adipostatic leptin, thus tanycytes my act as a conduit also between other peripheral signals and the brain.
1.5.6. Tanycytes and other metabolites
Besides exploring the role of tanycytes in the perception to leptin or glucose, a few researchers aimed to explore the potent ability of tanycytes to respond to other metabolites.
The above mentioned Tas1r2/Tas1r3 heterodimer G-protein coupled sweet-taste receptor shares a subunit with the special glutamate receptor which is responsible for the perception of umami taste and can be found in the tongue (Nelson et al., 2002). As
30
tanycytes express the Tas1r2/Tas1r3 receptor and the umami taste receptor differs from this only in one subunit, the hypothesis was that tanycytes might be able to sense and respond to amino acids via Tas1r1/Tas1r3 receptor similarly to those, seen in the case of glucose sensation. Indeed, it has been proved by calcium imaging and ATP biosensing, that tanycytes can represent the umami taste signaling pathway by expressing the Tas1r1/Tas1r3 receptor exhibiting the first non-neuronal mechanism of amino acid sensing (Lazutkaite et al., 2017). Another study points to the potential role of tanycytes in the sensation of lipids (Hofmann et al., 2017). Tanycytes of obese animals increase the size of their lipid droplets. In addition, tanycytes have different immune response for saturated or unsaturated lipids (Hofmann et al., 2017) raising the possibility, that tanycytes can sense the quality of fatty acids, as well.
1.5.7. Tanycytes as diet-responsive neurogenic niche
In the last years, several publications proved the neural stem cell (NSC) properties of tanycytes meaning their ability to generate new neurons in adult animals (Kriegstein and Gotz, 2003). Tanycytes express a series of NSC markers like vimentin, nestin, Sox2 and glial fibrillary acidic protein (GFAP) reviewed by Rodriguez (Rodriguez et al., 2005). Furthermore, tanycytes were also shown to retain the expression of progenitor markers Notch1 and 2 and Rax in the adult brain (Lee et al., 2012). Besides the self- renewing ability of α-tanycytes (Robins et al., 2013a), these cells also produce neurons that migrate to the ME, ARC and ventromedial nucleus (VMN) (Haan et al., 2013, Lee et al., 2012). As the ARC and the VMN are involved in the regulation of energy metabolism, and HFD regulates the number of the newborn neurons, it is likely, that tanycytes have the ability to renew neuronal populations involved in the regulation of energy homeostasis. As a further proof of the role of tanycytes in the renewal of energy homeostasis-related neuronal populations, tanycyte-derived neurons born from prepubertal period in the ARC respond to leptin with STAT3 phosphorylation (Haan et al., 2013), moreover, the blockade of tanycyte neurogenesis results in altered weight and metabolic activity in adult mice (Lee et al., 2012).
31
1.6. Diet-induced obesity and hypothalamic responses 1.6.1. Diet-induced peripheral and central responses
Obesity represents one of the major health problems in both industrialized and emerging nations. The main reasons that make obesity a worldwide problem can be traced back to the reduced physical activity partly due to sedentary lifestyle and to the increased consumption of dietary fats. Obesity can be characterized by the increase of excess body fat and associated with the elevated risk of type 2 diabetes, cardiovascular disease and atherosclerosis (Semenkovich, 2006). Previous investigations have shown that, diet- induced obesity (Thaler et al.) is linked to immune cell-mediated inflammatory responses initiating insulin resistance in several organs like liver, skeletal muscle and adipose tissue (Shoelson et al., 2006). Besides peripheral consequences of the HFD, it was also shown, that the hypothalamus is also affected by diet-induced inflammation, moreover, the central inflammatory response represents a more rapid process initiated by the activation of microglia (Thaler et al., 2012c, Tran et al., 2016).
1.6.2. Diet induced inflammation in the ARC
Long-term consumption of 60% fat containing chow can increase the expression of proinflammatory cytokines in the hypothalamic ARC (De Souza et al., 2005). However, recent studies demonstrated that the expression of proinflammatory cytokines is very quickly increased in the ARC by HFD (Thaler et al., 2012c). Only 3 days of HFD is sufficient to induce inflammation in this nucleus (Thaler et al., 2012c). The initiation of the inflammation in the ARC is triggered by FFAs resulting in endoplasmatic reticulum stress (Ozcan et al., 2009, Zhang et al., 2008). The increased production of reactive oxygen species, then, facilitates the induction of inflammation (Zhang and Kaufman, 2008). This inflammatory process plays important role in the development of the diet induced obesity. Indeed, specific ablation of the nuclear factor kappa B (NF-κB) signaling, a key second messenger of cytokine receptors, in the AgRP neurons, results in resistance to diet induced obesity (Zhang et al., 2008). Thaler and his colleagues reported the measurable level of markers of the inflammation within 24 hours of HFD and the neuronal injury associated with reactive gliosis in the first week of HFD (Thaler et al., 2012c). The expression levels of proinflammatory interleukin-6 (Il6,) tumor
32
necrosis factor alpha (Tnfa), suppressor of cytokine signaling 3 (Socs3), inhibitor of nuclear factor kappa-B kinase subunit beta (Ikbkb) and epsilon (Ikbke) are rising in the initiation of the HFD and then stagnating between the days 7 to 14 and elevating again suggesting the existence of an early adaptive response (Thaler et al., 2012c).
According to all of these data it is likely, that hypothalamic ARC neurons are able to sense and initiate the appropriate response to elevated levels of dietary fats, however, the role of other non-neuronal cell types, like glial cells cannot be excluded from the central inflammatory responses.
1.6.3. The role of glial cells in the development of the diet- induced inflammation
Glial cells, including microglia, astrocytes, NG2-positive glial cells and tanycytes play a pivotal role in the homeostatic regulation of the CNS (Jha and Suk, 2013). Moreover, these cells are also involved in the metabolic sensing within the hypothalamus (Freire- Regatillo et al., 2017). In physiological conditions, glial cells support the normal energy homeostasis of the ARC neurons, however, certain conditions, like HFD can lead to misregulation of this glia-neuron cooperation. HFD induces activation of both microglial cells and astrocytes in the ARC that is apparent from the morphological and gene expression changes (Hanisch and Kettenmann, 2007, Pekny and Nilsson, 2005).
This glial activation is claimed to be important in the development of diet induced obesity and the associated metabolic changes (Horvath et al., 2010, Thaler et al., 2012c).
Microglia is a special neuroglial cell type located in the spinal cord and the brain and performs the task like the macrophage cells and monocytes in the peripheral tissues, namely, the main role of the microglia is to scavenge all the foreign materials and the damaged cells and to secrete immune factors (Graeber et al., 2011).
In response to HFD, the number of cells expressing the microglia-specific marker, the ionized calcium-binding adapter molecule 1 (Iba1) (Ito et al., 1998) increases accompanied by morphological changes of microglia (Thaler et al., 2012c) indicating that HFD induces microglial activation. The HFD induced microglial activation is further suggested by the increased expression of the EGF-like module-containing
33
mucin-like hormone receptor-like 1 (Emr1), a marker of activated microglia, in the ARC (Thaler et al., 2012c), however, the exact role of this process in the initiation of the central inflammatory process is still contentious (Thaler et al., 2012c, Valdearcos et al., 2014). According to Thaler (Thaler et al., 2012c), the microglia accumulation and activation only occurs, when the hypothalamic inflammation has developed, however the microglial response is still trackable, even when the inflammatory response has decayed. Based on this interpretation, microglia has neuroprotective effect during HFD (Thaler et al., 2012c). According to Valdearcos (Valdearcos et al., 2014), however, during HFD a rapid microglial activation can be observed and the depletion of microglia perfectly repressed the hypothalamic inflammation, therefore, microglia are responsible for the HFD-induced hypothalamic inflammation (Valdearcos et al., 2014). In spite of this, the long-term effect of microglia in the inflammatory process in both interpretations is similar: prolonged activation of microglial cells leads to high level of proinflammatory mediators like cytokines and chemokines.
Astroglia represent the other supporting glial cell type of the brain. Astrocytes are involved in many neuronal homeostatic functions, such as regulation of synaptic transmission, maintaining the BBB and the fluid and ion homeostasis by spatial buffering (Abbott et al., 2010, Kofuji and Newman, 2004). Astrocytes seem to be sensitive for leptin by expressing LepRs, moreover, leptin is essential for their proliferation (Rottkamp et al., 2015) raising the possibility of their involvement in the control of appetite. During obesity, astrocytes show significantly altered morphology in the ARC that is characteristic for astrocyte activation (Pekny and Nilsson, 2005, Thaler et al., 2012c). The alteration of astrocyte morphology may change the ensheatment of hypothalamic neurons (Horvath et al., 2010). Moreover, this reactive gliosis causes the release of proinflammatory cytokines from astrocytes resulting in local inflammation via IKKβ/NF-κB signaling (Douglass et al., 2017).
NG2-positive cells play a crucial role in the control of hypothalamic function by contacting neuronal processes (Robins et al., 2013b). A recent study has shown that, NG2-positive cells directly contact the ARC processes in the ME regulating their responsiveness to leptin (Djogo et al., 2016).
34
The effect of diet-induced obesity on the hypothalamic ARC and the involvement of glial cells in the inflammatory process seems to be evident, however, it is still unclear, which hypothalamic cell population is responsible for the initiation of the hypothalamic inflammatory response. As tanycytes represent the first line reached by peripheral signals, thus play a crucial role in the hypothalamic control of metabolism, moreover, tanycytes are proved to be able to respond to neurotransmitters, glucose and leptin, it is likely, that these special cells besides other glial cells also play a role in the regulation of the inflammatory processes in the case of HFD.